
Current trends in the post and telecommunications industry
The post and telecommunications industry experienced notable changes in the period 2019–2022, according to a recent report. Shifts in both telecommunication and postal services reflect broader changes in the economy.
Fact #1: Mobile lines dominate telecommunications income
Consumers love their phones! This is evident in Figure 1, which provides an overview of services that help keep the telecommunications sector afloat. Mobile lines dominate this space, accounting for almost two-thirds of income.
On a more granular level, mobile voice and mobile data were the largest contributors to mobile lines, with SMS services taking up a smaller portion. Overall, mobile voice generated just over a third of the entire pie (click on the image to enlarge).
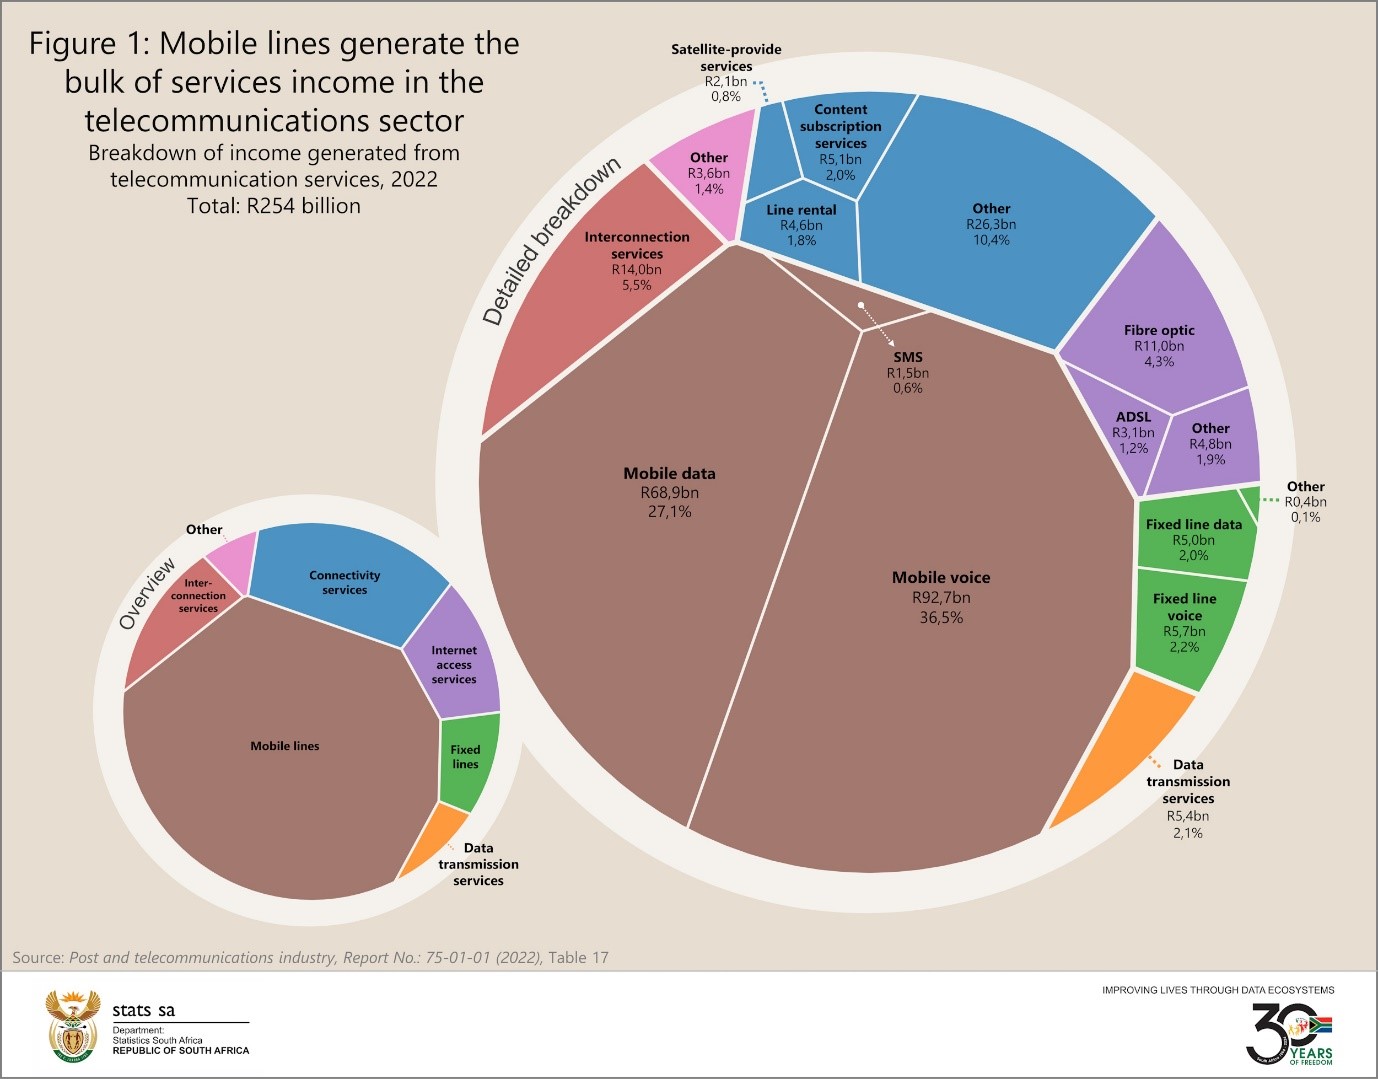
Note that Figure 1 only considers services income related to telecommunication activities. There are other forms of income not considered here and are covered in more detail in the report. These include services income related to broadcasting activities and non-services income such as interest and the sales of goods.
Fact #2: ADSL on its way out as fibre broadband takes over
The most striking change in the 2019–2022 period concerns ADSL and fibre-optic broadband. ADSL, which makes use of copper wire infrastructure, declined sharply in this period. In 2019, ADSL was the largest generator of income in the internet access services category, falling to third place in 2022 (Figure 2). Fibre-optic broadband expanded to fill the gap, increasing by more than three-fold. The rise in fibre-optic could be due to a number of reasons, including increased demand during the pandemic.1
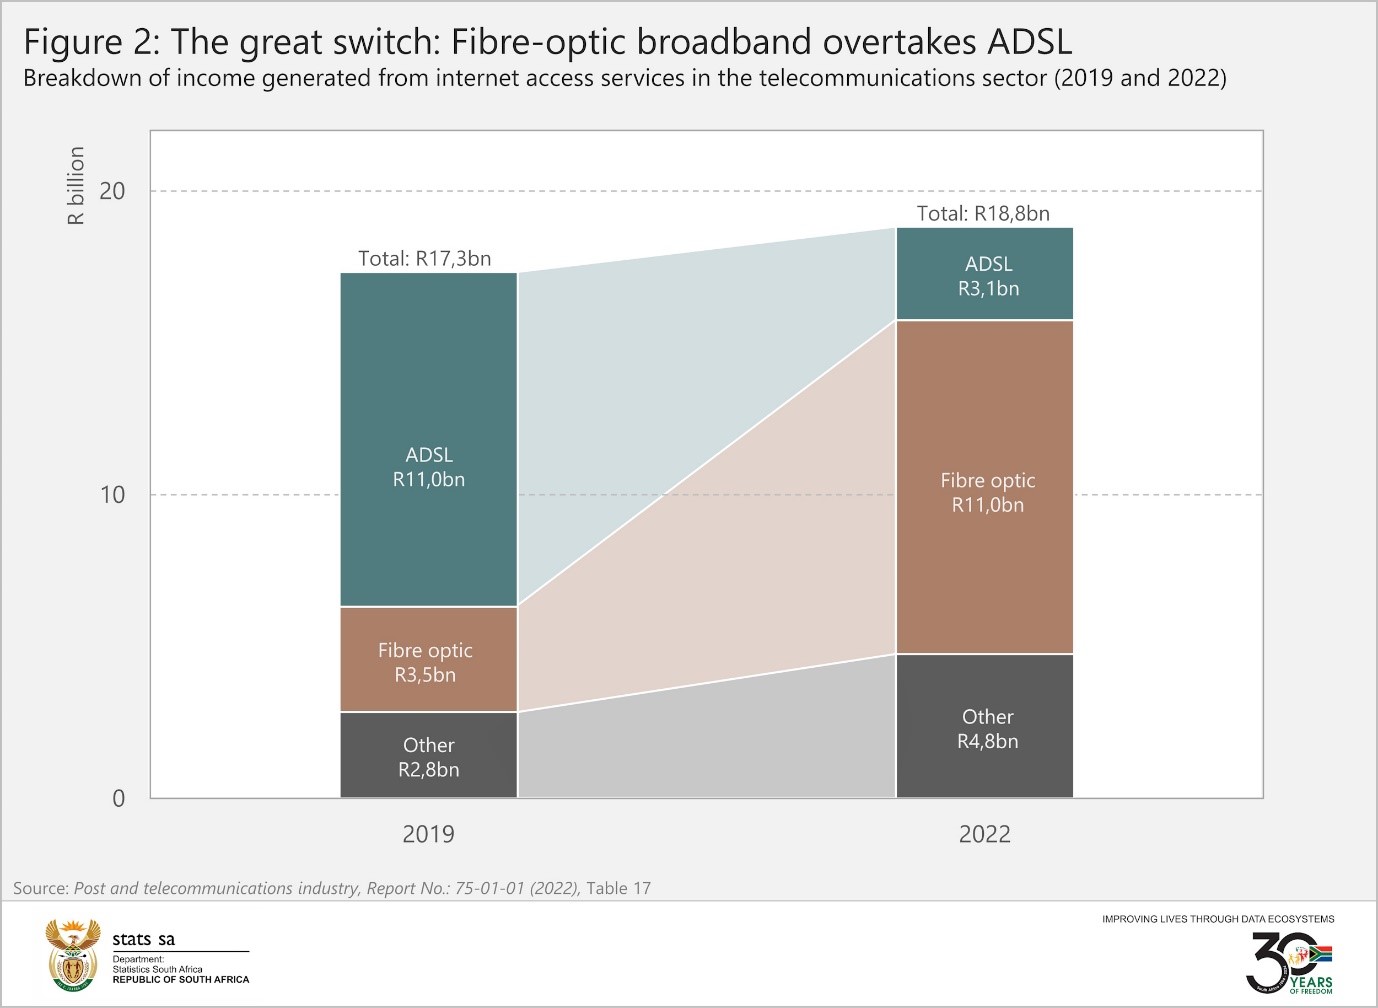
Other internet access services increased too, helping to push total income for the category up from R17,3 billion in 2019 to R18,8 billion in 2022.
Fact #3: SMS services record the second largest decline
When last did you use SMS to communicate with family? Figure 3 shows that ADSL broadband recorded the largest decrease in the 2019–2022 period, reflecting the decline highlighted in Figure 2. The second largest decrease was recorded by SMS services, which retreated by 24% per annum. In 2019, SMS services generated R3,4 billion, contracting to R1,5 billion in 2022.
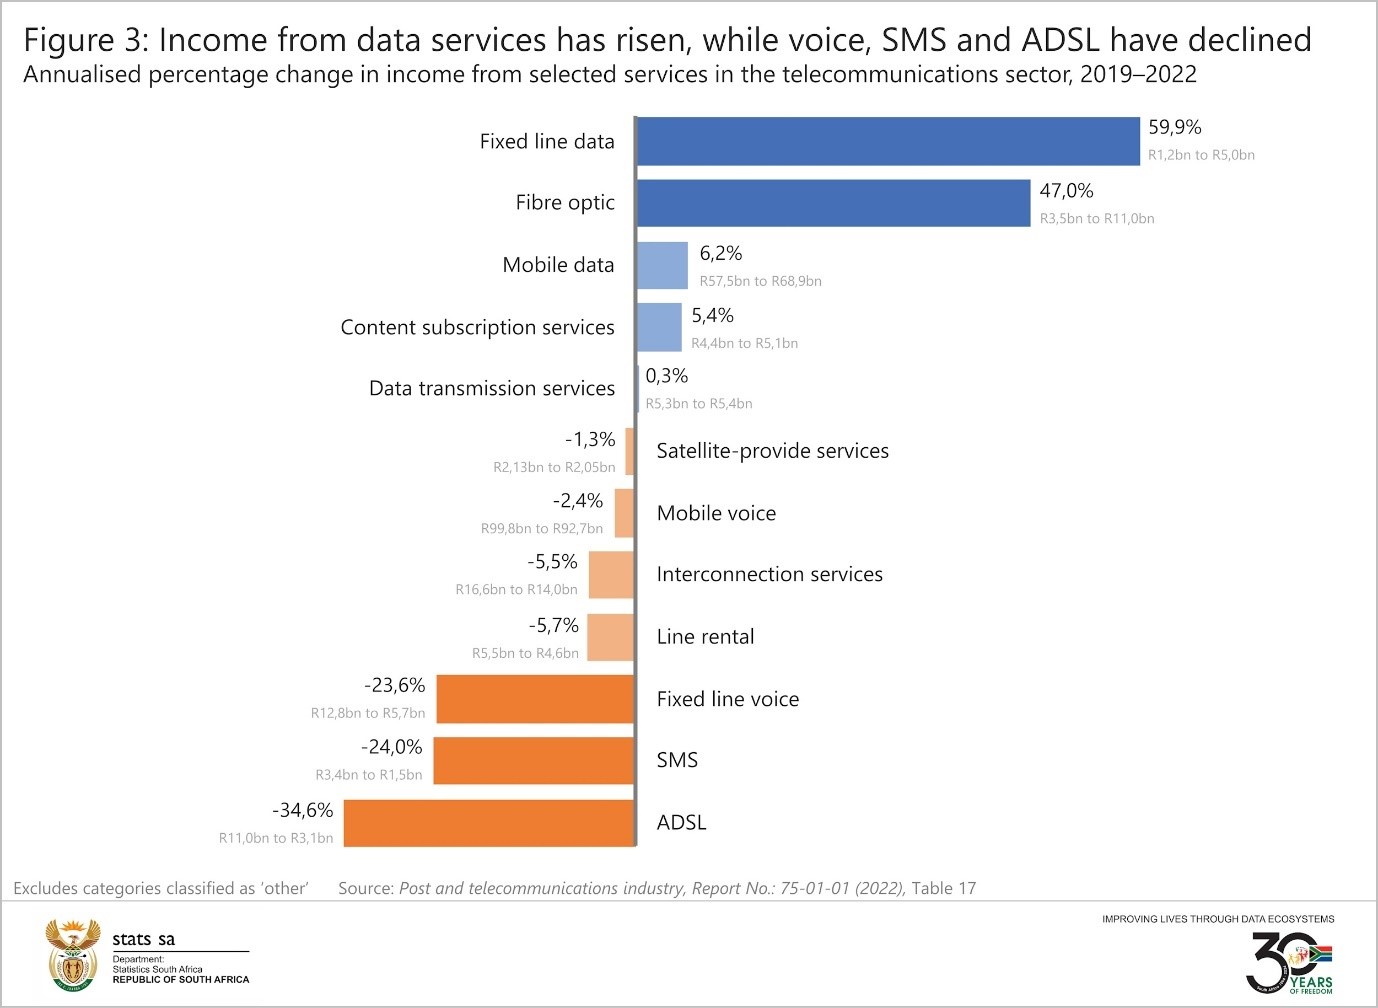
Voice services (fixed and mobile), line rental, interconnection services and satellite-provide services also recorded decreases in this period.
Stronger results were recorded for items related to the transmission and consumption of data, including fixed line data, fibre-optic broadband, mobile data, content subscription and data transmission services.
Fact #4: Traditional mail loses out as courier services grow
The post and associated courier activities sector is the smaller brother in the industry, accounting for 6% of total income while the telecommunications sector accounts for 94%. Despite its smaller size, businesses, households and government rely on post and courier services for the delivery of hard-copy documents, parcels and other goods.
This sector also experienced notable changes in the 2019–2022 period. In terms of income, there was a shift away from traditional postal services and towards courier services (Figure 4).
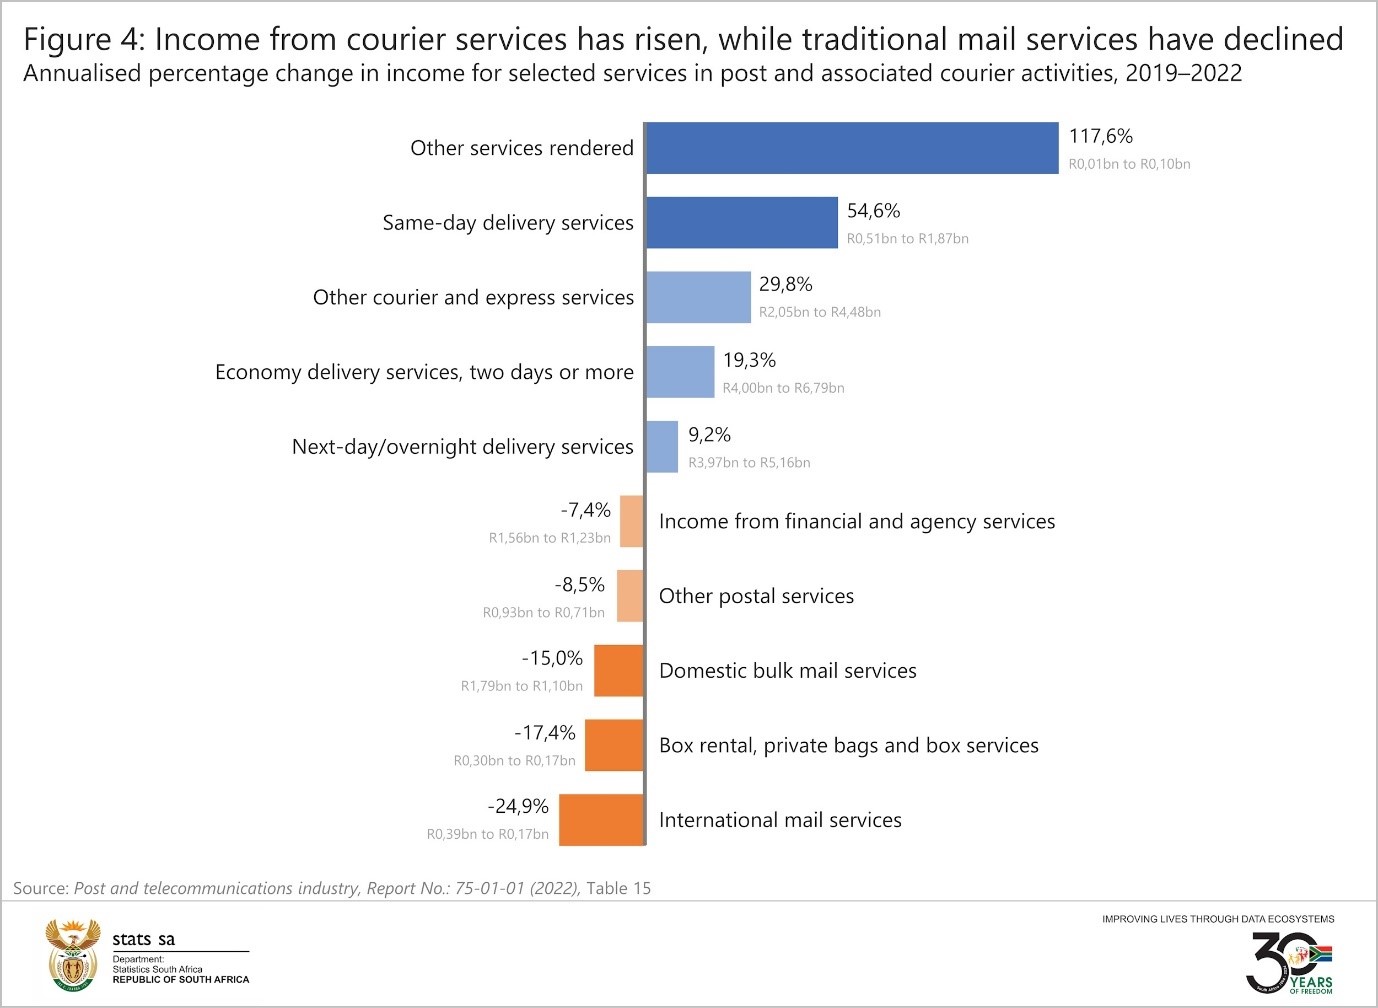
Courier-related activities – such as same-day delivery services, express services, economy delivery services and overnight delivery services – have become more popular. Traditional postal services – such as bulk mail services, box rental and international mail services – all recorded decreases.
In summary, the post and telecommunications industry has experienced key shifts in its service offerings in the period from 2019 to 2022. These include a rapid decrease in income generated by ADSL, a rise in fibre-optic broadband, a decline in the importance of SMS, and a move towards courier services (away from traditional mail).
For more information, download the Post and telecommunications industry, 2022 report here.
1 Cape Business News, 2022. Why South Africa is seeing a fibre boom (read here).
Similar articles are available on the Stats SA website and can be accessed here.
For a monthly overview of economic indicators and infographics, catch the latest edition of the Stats Biz newsletter here.