
Which municipalities spent the most per resident in 2022?
The primary role of South Africa’s 257 municipalities is to provide water, electricity, refuse removal, sanitation and other services to millions of households. This mammoth task requires extensive resources.
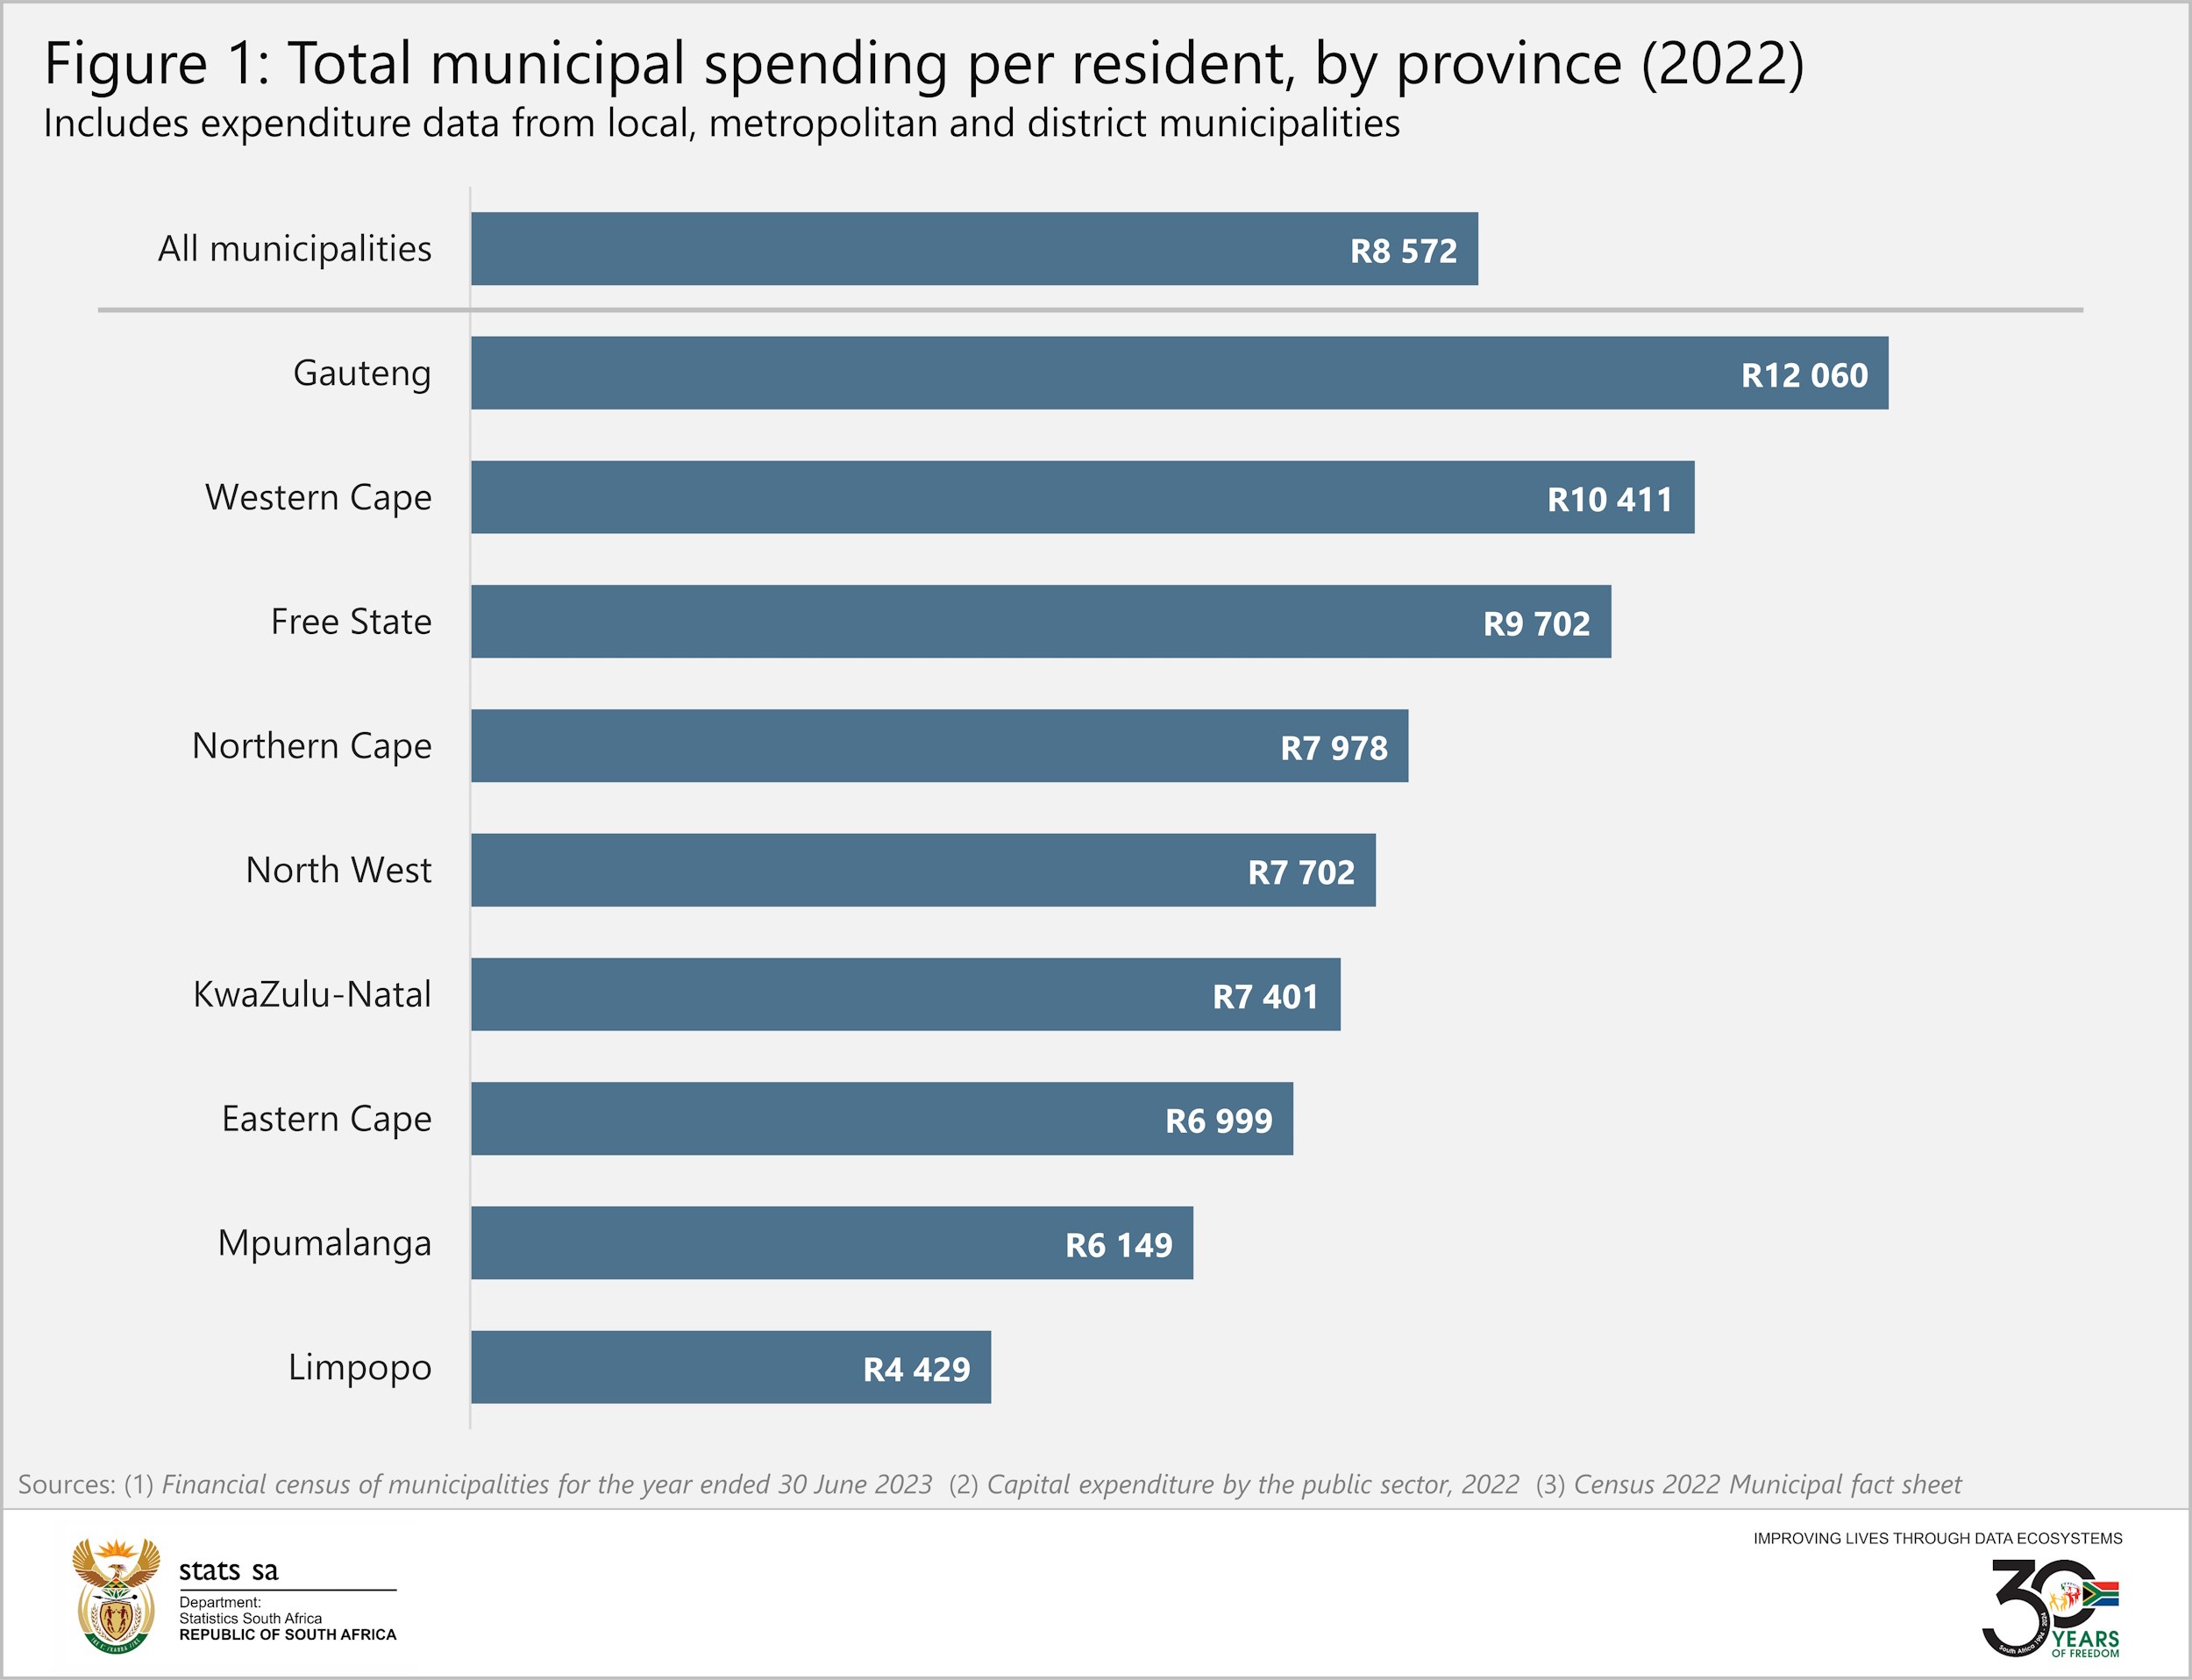
Municipalities spent R532 billion in 2022. This total includes both operational1 and capital expenditure,2 published in two separate statistical releases. If we consider the Census 20223 national population count of 62,0 million, this equates to an average municipal expenditure of R8 572 per resident. At a more granular level, the municipalities of Gauteng recorded the highest level of municipal spending per resident, at R12 060 (Figure 1). Eastern Cape, Mpumalanga and Limpopo registered the lowest values.
The top 20 list: Do you live in any of these municipalities?
If we filter this down to individual local and metropolitan municipalities, the analysis shows spending per resident ranging from a low of R1 389 (Nongoma LM in KwaZulu-Natal) to a high of R23 201 (Gamagara LM in Northern Cape). A list of the top 20 spenders shows a splattering of local and metropolitan municipalities across eight provinces (Figure 2).
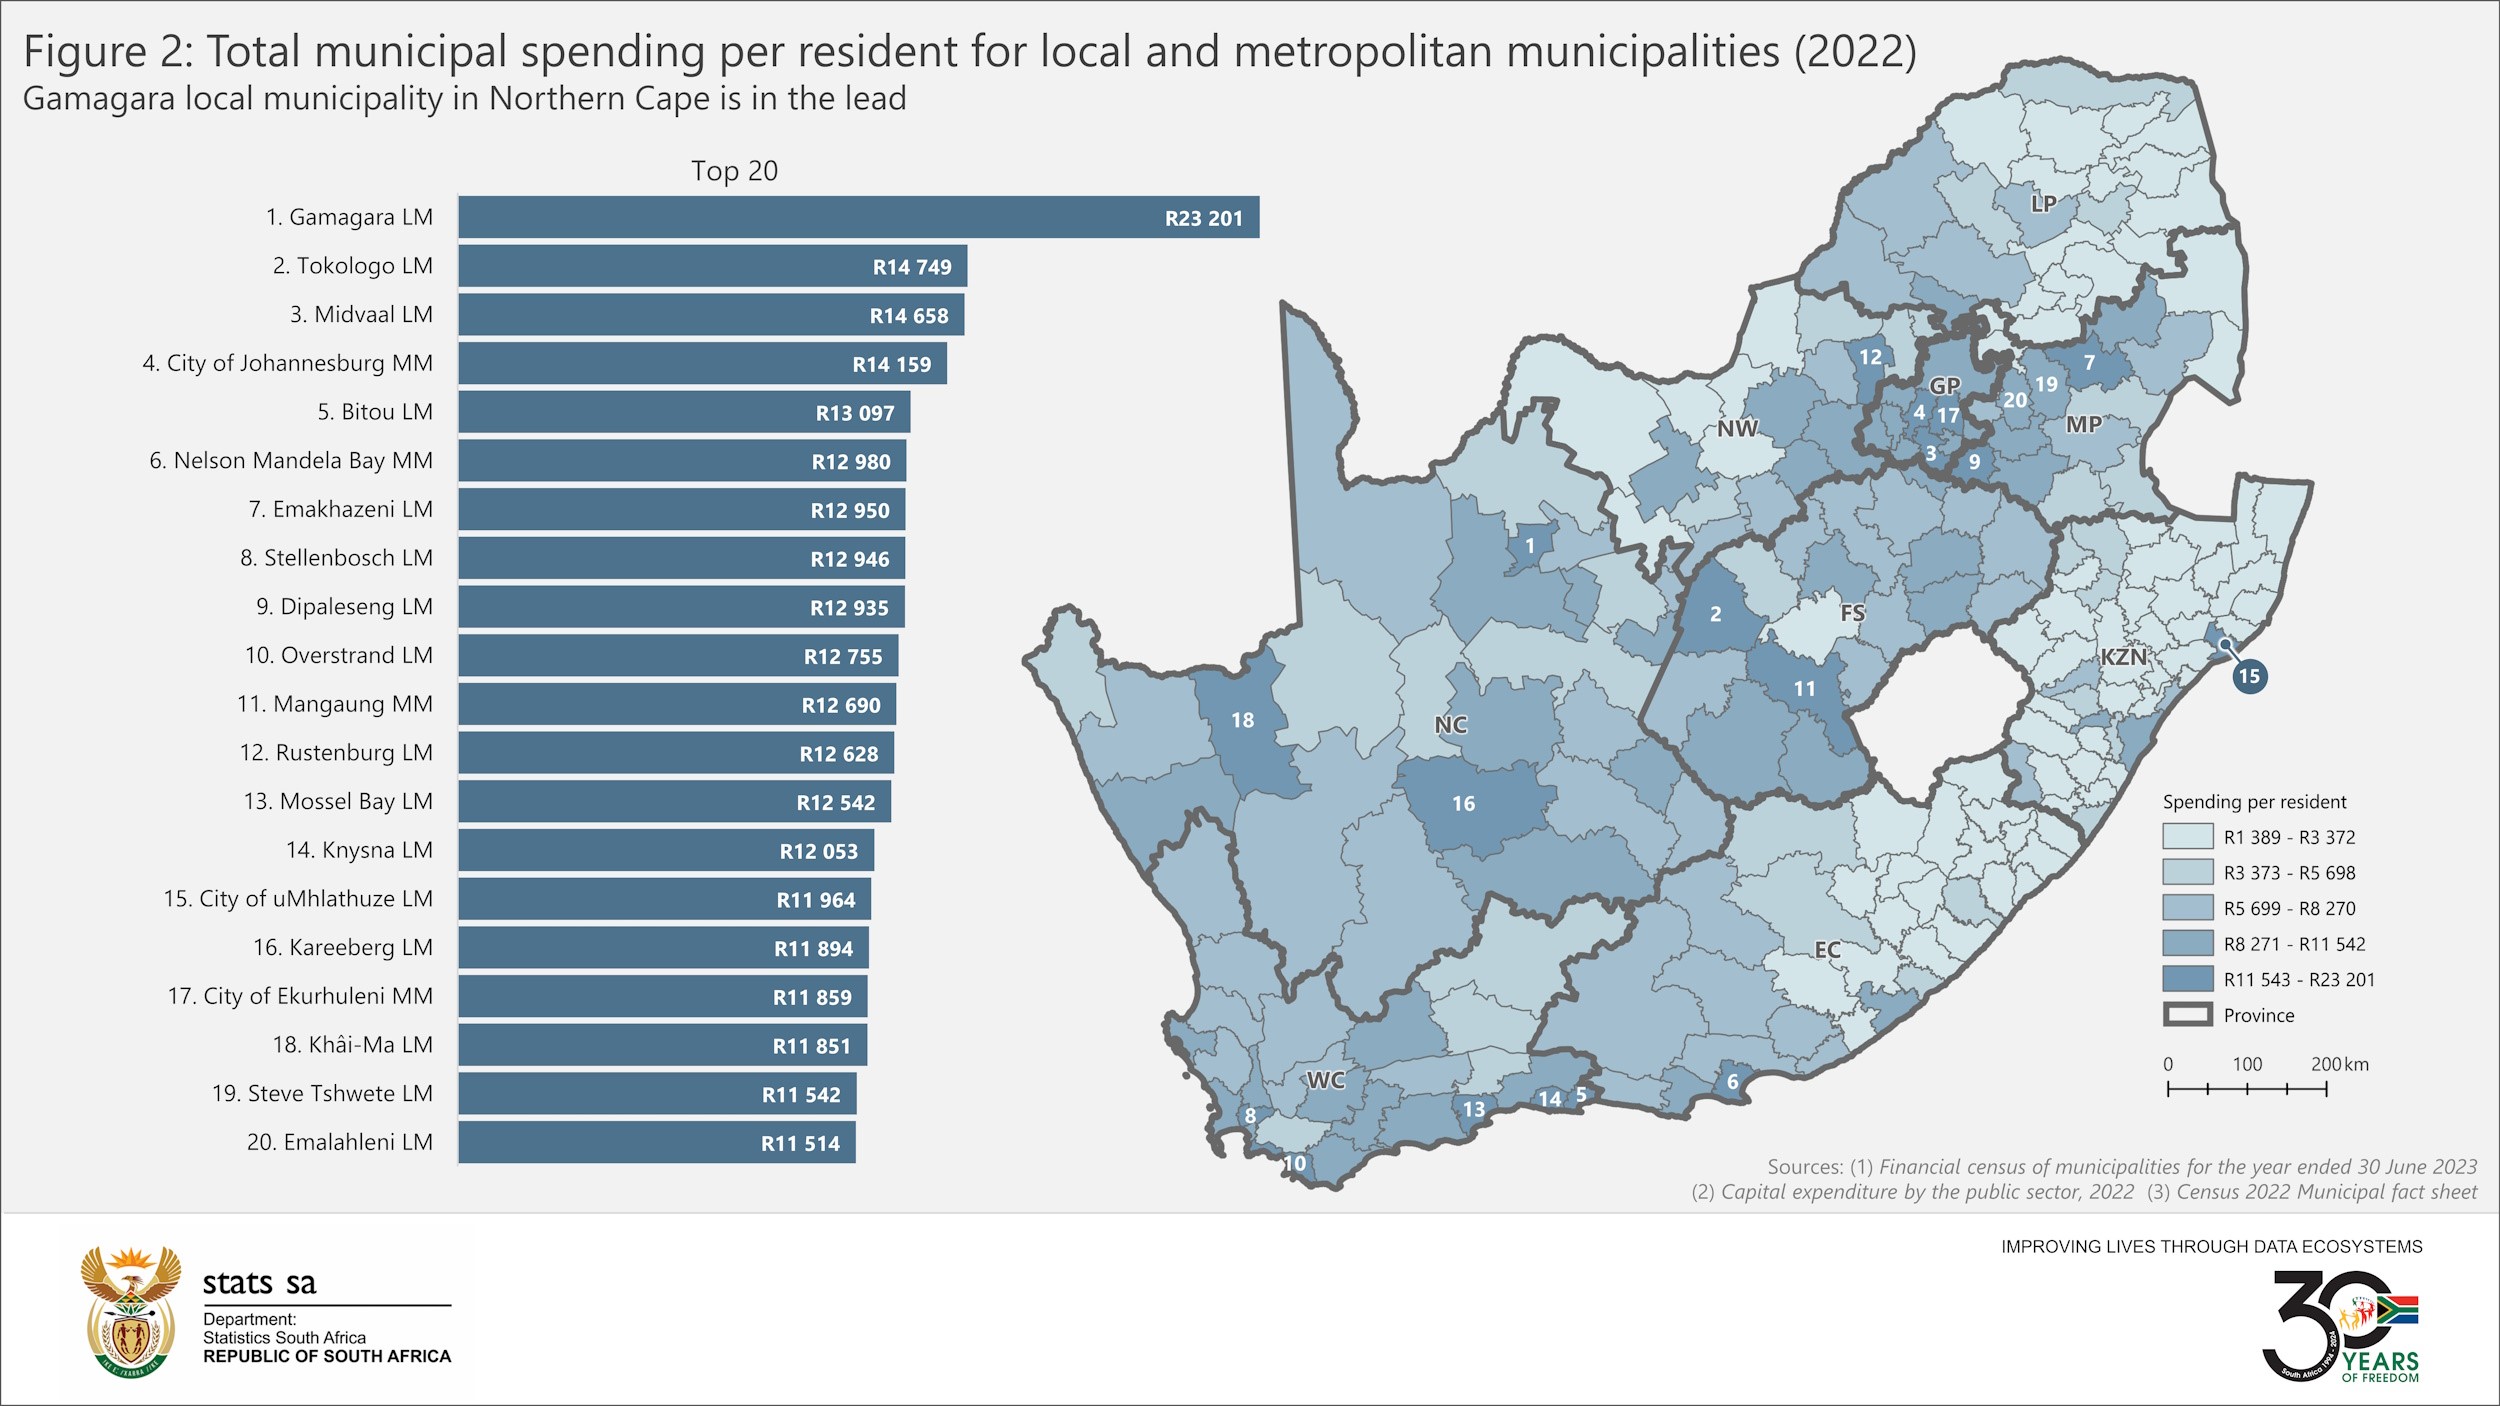
Interestingly, several municipalities in the top 20 are clustered in an area that includes parts of Gauteng and Mpumalanga. Lighter-coloured municipalities – with relatively low per capita spending – are prevalent in provinces such as Limpopo, Eastern Cape, KwaZulu-Natal and North West.
For the data nerds
Figure 3 shows where each local and metropolitan municipality fits on the per capita spending range. Provinces appear on the y-axis according to their provincial averages. Limpopo has the lowest average, with many municipalities clustered at the bottom end. Gauteng, with the highest average, has municipalities appearing higher up on the scale.
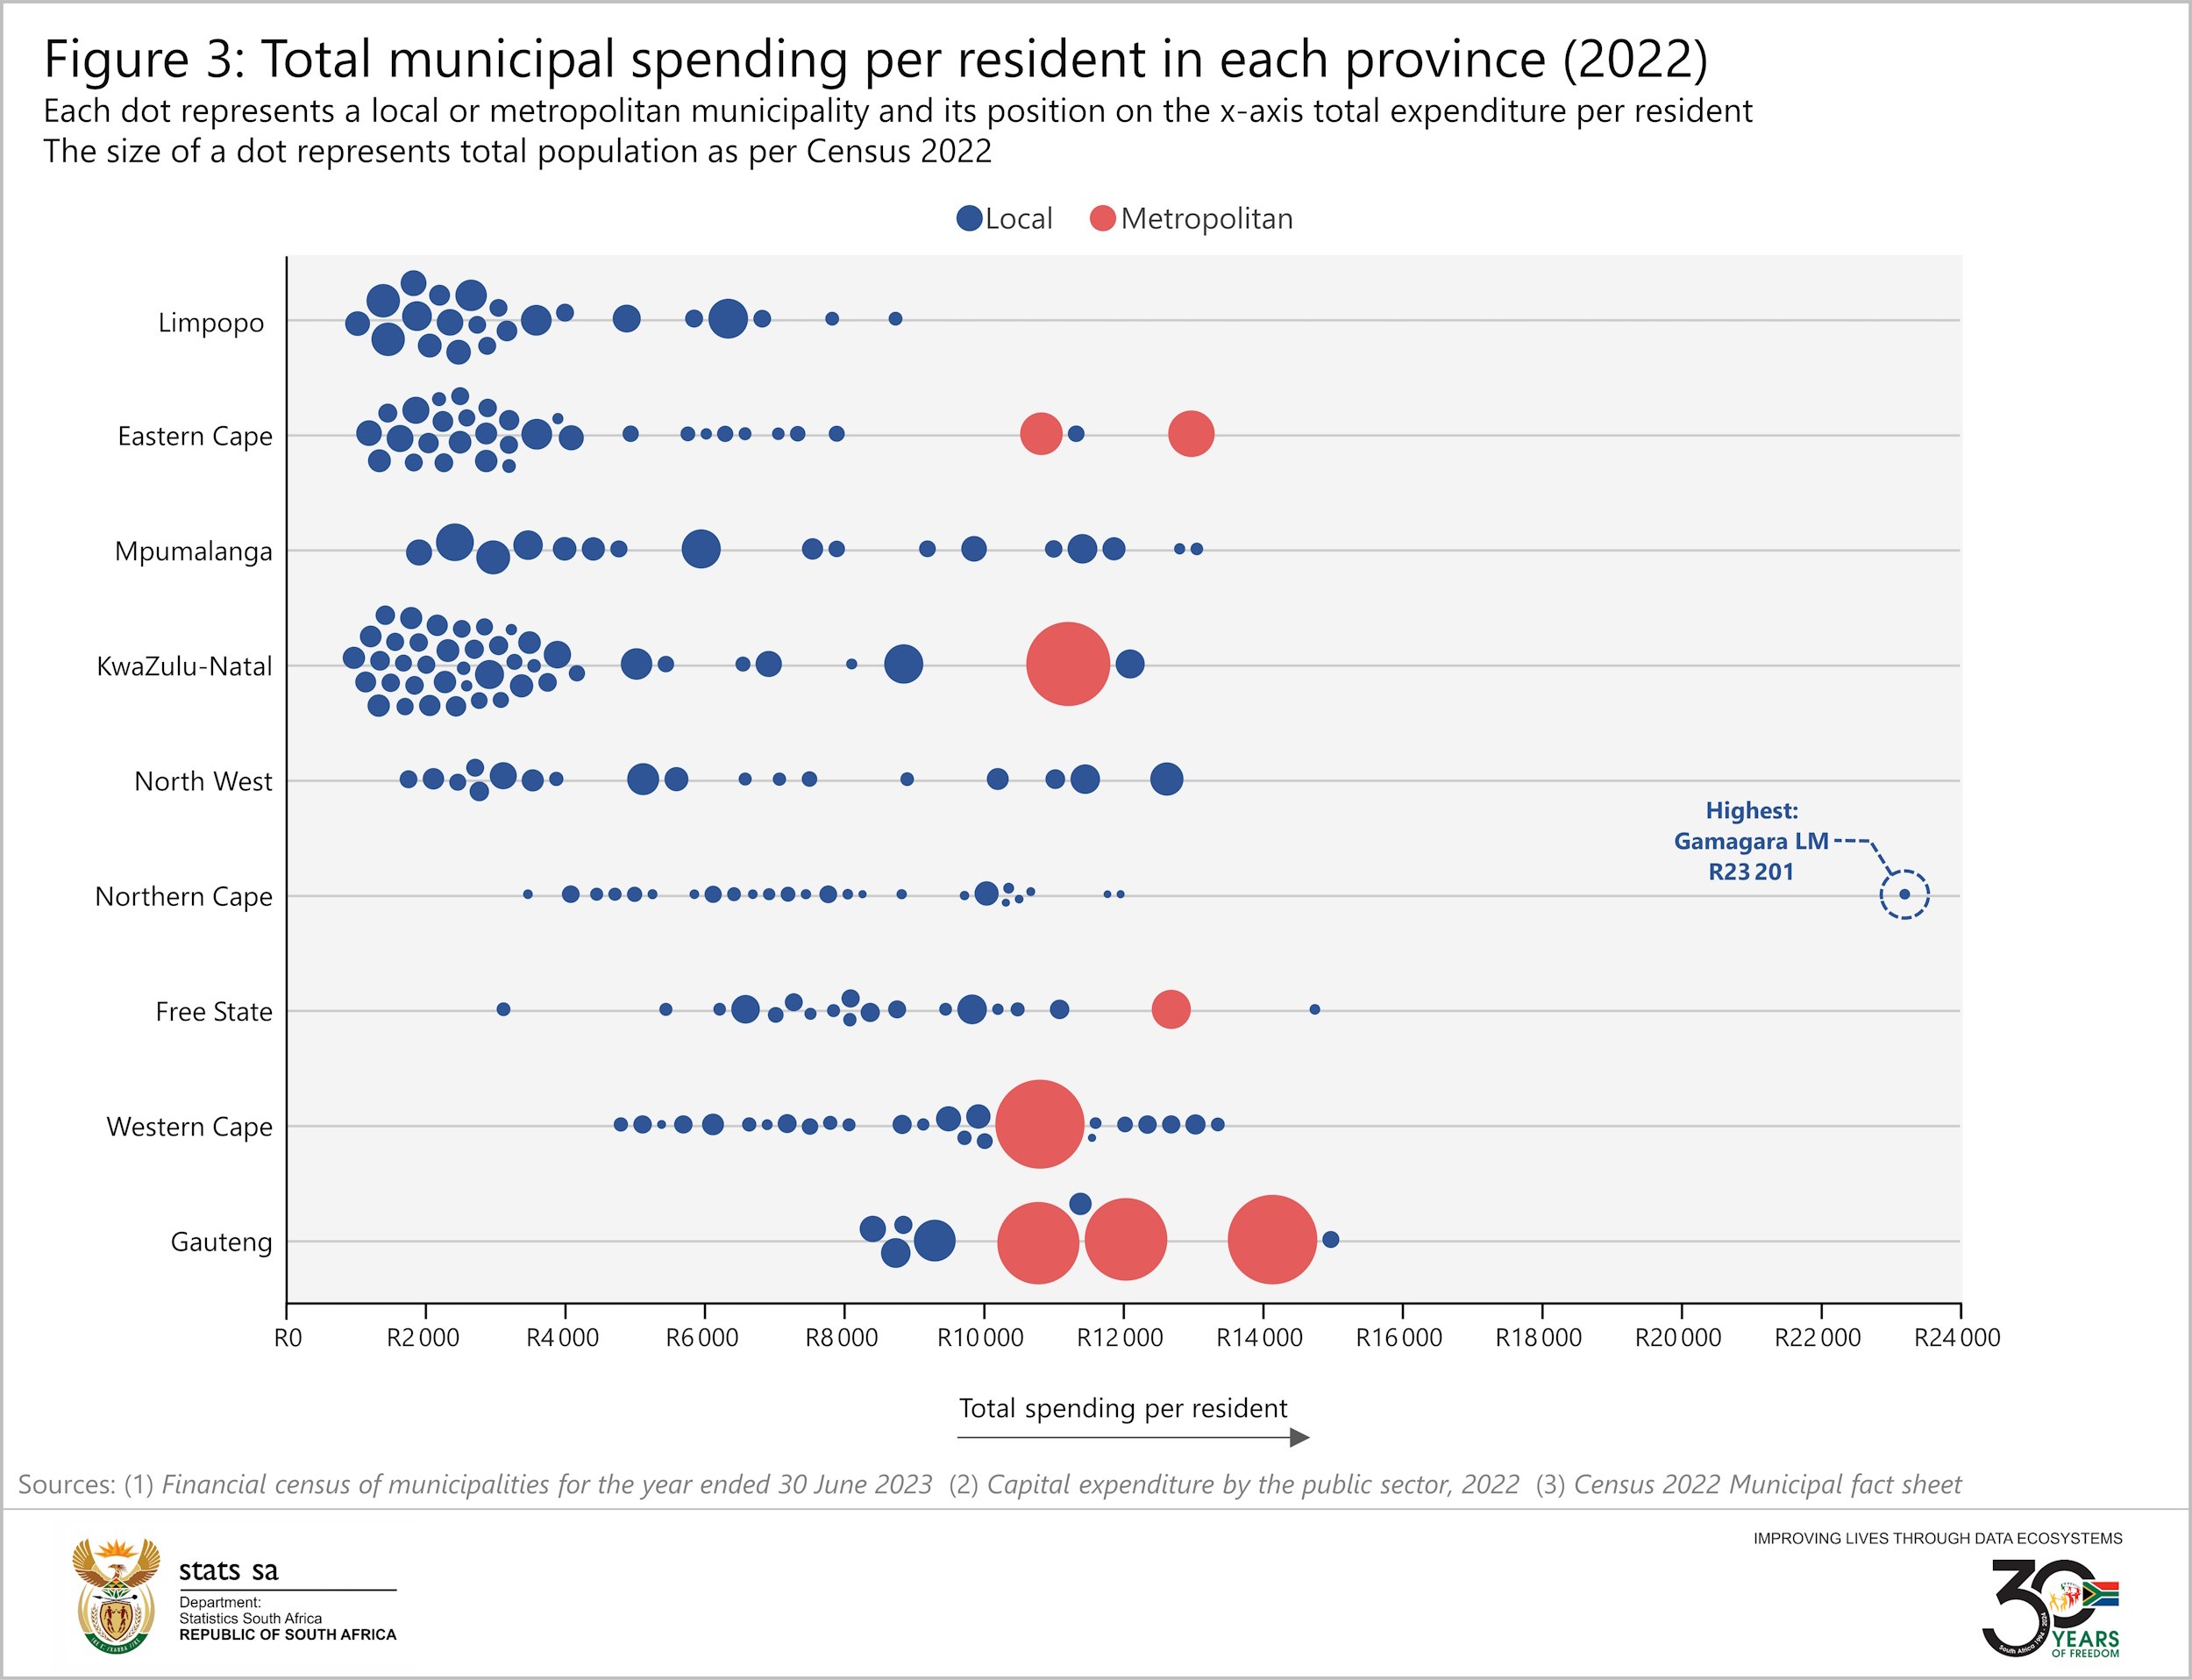
The range between the lowest and highest municipalities within each province tells a story. Northern Cape had the largest spread between lowest and highest. This is attributed to the outlier of Gamagara LM, which appears on the far right. But more on this later!
Apart from the Northern Cape, the provinces of Free State, Eastern Cape and North West registered the widest ranges between minimum and maximum. Municipalities in Gauteng and Limpopo are more clustered.
Figure 4 might provide a clue to why these differences exist. The Municipal Infrastructure Investment Framework (MIIF) – developed by the Department of Cooperative Governance and Traditional Affairs in partnership with the Development Bank of South Africa – categorises local and metropolitan municipalities into five groups. These are metropolitan municipalities (A), secondary cities (B1), municipalities with a large town as its core (B2), municipalities with small towns (B3), and municipalities that are predominantly rural (B4).4
According to Figure 4, B4 (predominantly rural) municipalities recorded the lowest per capita spending figures in 2022, while A (predominantly urban) municipalities registered the highest. This shows that the more urbanised the municipality, the higher the municipal spending per resident.
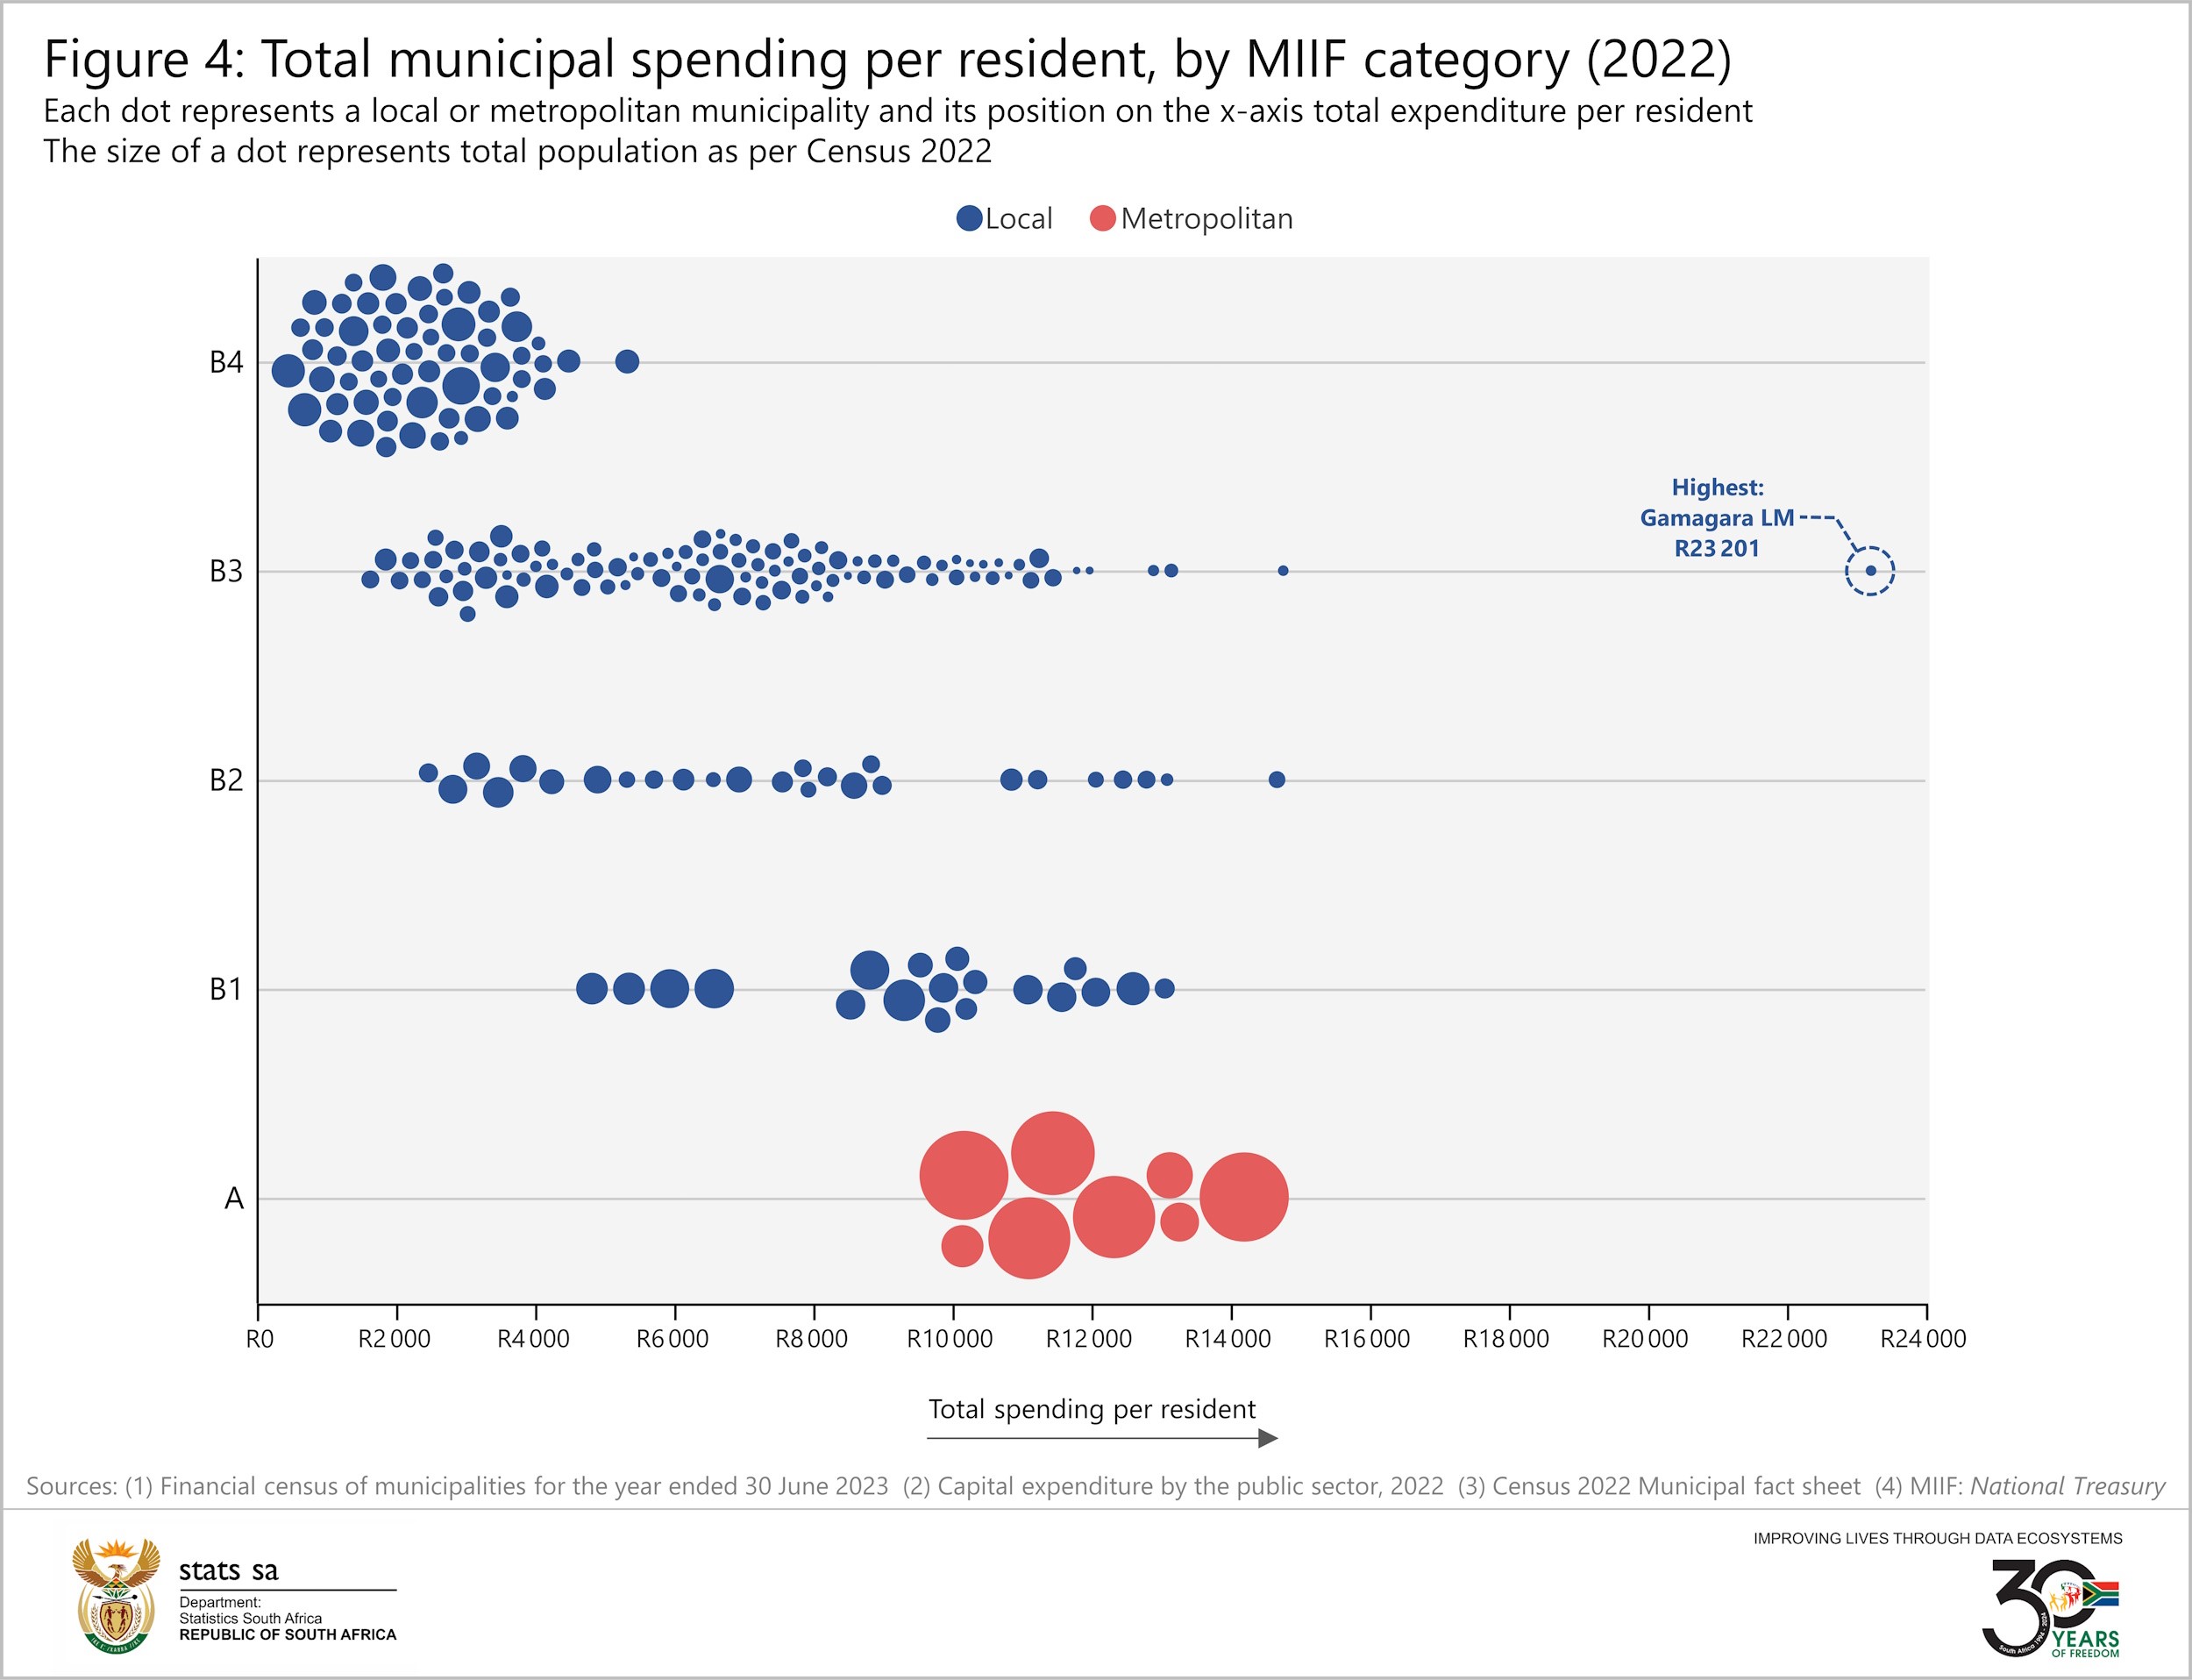
The distribution patterns are also interesting. B4 and A municipalities are tightly clustered on the scale. In contrast, B1, B2 and B3 municipalities are more dispersed.
Gamagara LM, our wayward municipality, is again the notable exception. This B3 municipality spends more per resident than the country’s largest cities.
We need to talk about Gamagara
The outlier of Gamagara LM isn’t a once off occurrence. This municipality also recorded the highest level of per capita spending in a similar analysis using 2016 data.5 What might be going on?
In its annual financial statements, the municipality recorded a high value for the line item of ‘inventories losses/write-downs’ in 2022. This contributed significantly to its total expenditure.6
Another reason could be the town of Kathu. Situated in Gamagara LM, Kathu’s economy is mainly driven by Sishen, a large iron ore mine. The town attracts skilled workers and high-income earners. The Mail & Guardian in 20197 and BusinessTech in 20208 listed Gamagara as the third richest municipality in the country, based on average taxable income per resident.
The municipality is also relatively self-sufficient in terms of revenue. For every R100 of revenue in 2022, R90 was self-generated (i.e. sourced from property taxes, service charges, fines, etc.), while R10 was sourced from national and provincial government. This is notable, as the R90 figure is above the B3 municipality average of R62 and the national average of R73. If this metric is used as a measure of self-reliance, Gamagara was the most financially independent municipality in 2022.
Gamagara LM is ranked the 12th most populous municipality in the Northern Cape, with a population of 29 580. Despite its relatively small population, it was the fourth largest generator of revenue and the fourth largest spender in Northern Cape.
Future research
There is a weakness in the analysis shown in Figure 2, Figure 3 and Figure 4, which may result in an underestimation of the per capita spending figures for rural municipalities. Only local and metropolitan municipalities are considered in the analysis; district municipalities are excluded. This is because each district oversees several local municipalities. If there is district expenditure that targets residents on the ground, it is not clear from the data how this spending is allocated across local areas.
Districts mainly fill an administrative function. However, there are several districts – mainly in rural provinces – that help with the provision of services, which is reflected in their financial reports. In other words, the analysis above excludes the benefits that may arise from district municipal spending, especially in provinces where districts play a more active role. Future research may find value in addressing this gap.
1 Operational expenditure data for 2022 was sourced from the Financial census of municipalities, for the year ended 30 June 2023 statistical report and associated Excel file. These are available for download here. Note that total revenue and total expenditure include gains and losses such as ‘fair value adjustments’, ‘actuarial gains/losses’ and other similar items.
2 Capital expenditure data for 2022 was sourced from the Capital expenditure of the public sector, 2022 statistical report and Excel file, available for download here. Revised capital expenditure figures for 2022 will be released in October 2024.
3 Population data are available from the Census 2022 Municipal Fact Sheet, available for download here.
4 Development Bank of South Africa, 2011. The Municipal Infrastructure Investment Framework (MIIF 7), Round 7 (2009–2010): A capital investment perspective (download here). A list of municipalities categorised by the MIIF classification is accessible from Stats SA’s Census 2022: Provinces at a glance report, available for download here.
5 Stats SA, 2017. Which municipalities spend the most per resident? (read here). This analysis only considered operational expenditure; capital expenditure was not included.
6 Gamagara Local Municipality, Annual Financial Statements for the year ended 30 June 2023, page 6 (download here).
7 Mail & Guardian, 2019. The small town with the big money (read here).
8 BusinessTech, 2020. These are the richest municipalities in South Africa – based on the average taxable income per resident (read here).
Similar articles are available on the Stats SA website and can be accessed here.
For a monthly overview of economic indicators and infographics, catch the latest edition of the Stats Biz newsletter here.