
National government spending breaks the R2 trillion mark
The South African national government spent R2,04 trillion1 in the 2022/23 financial year, representing a rise of 6,1% from R1,92 trillion in 2021/22. Stats SA’s latest set of national government financial data shows how these funds were distributed.
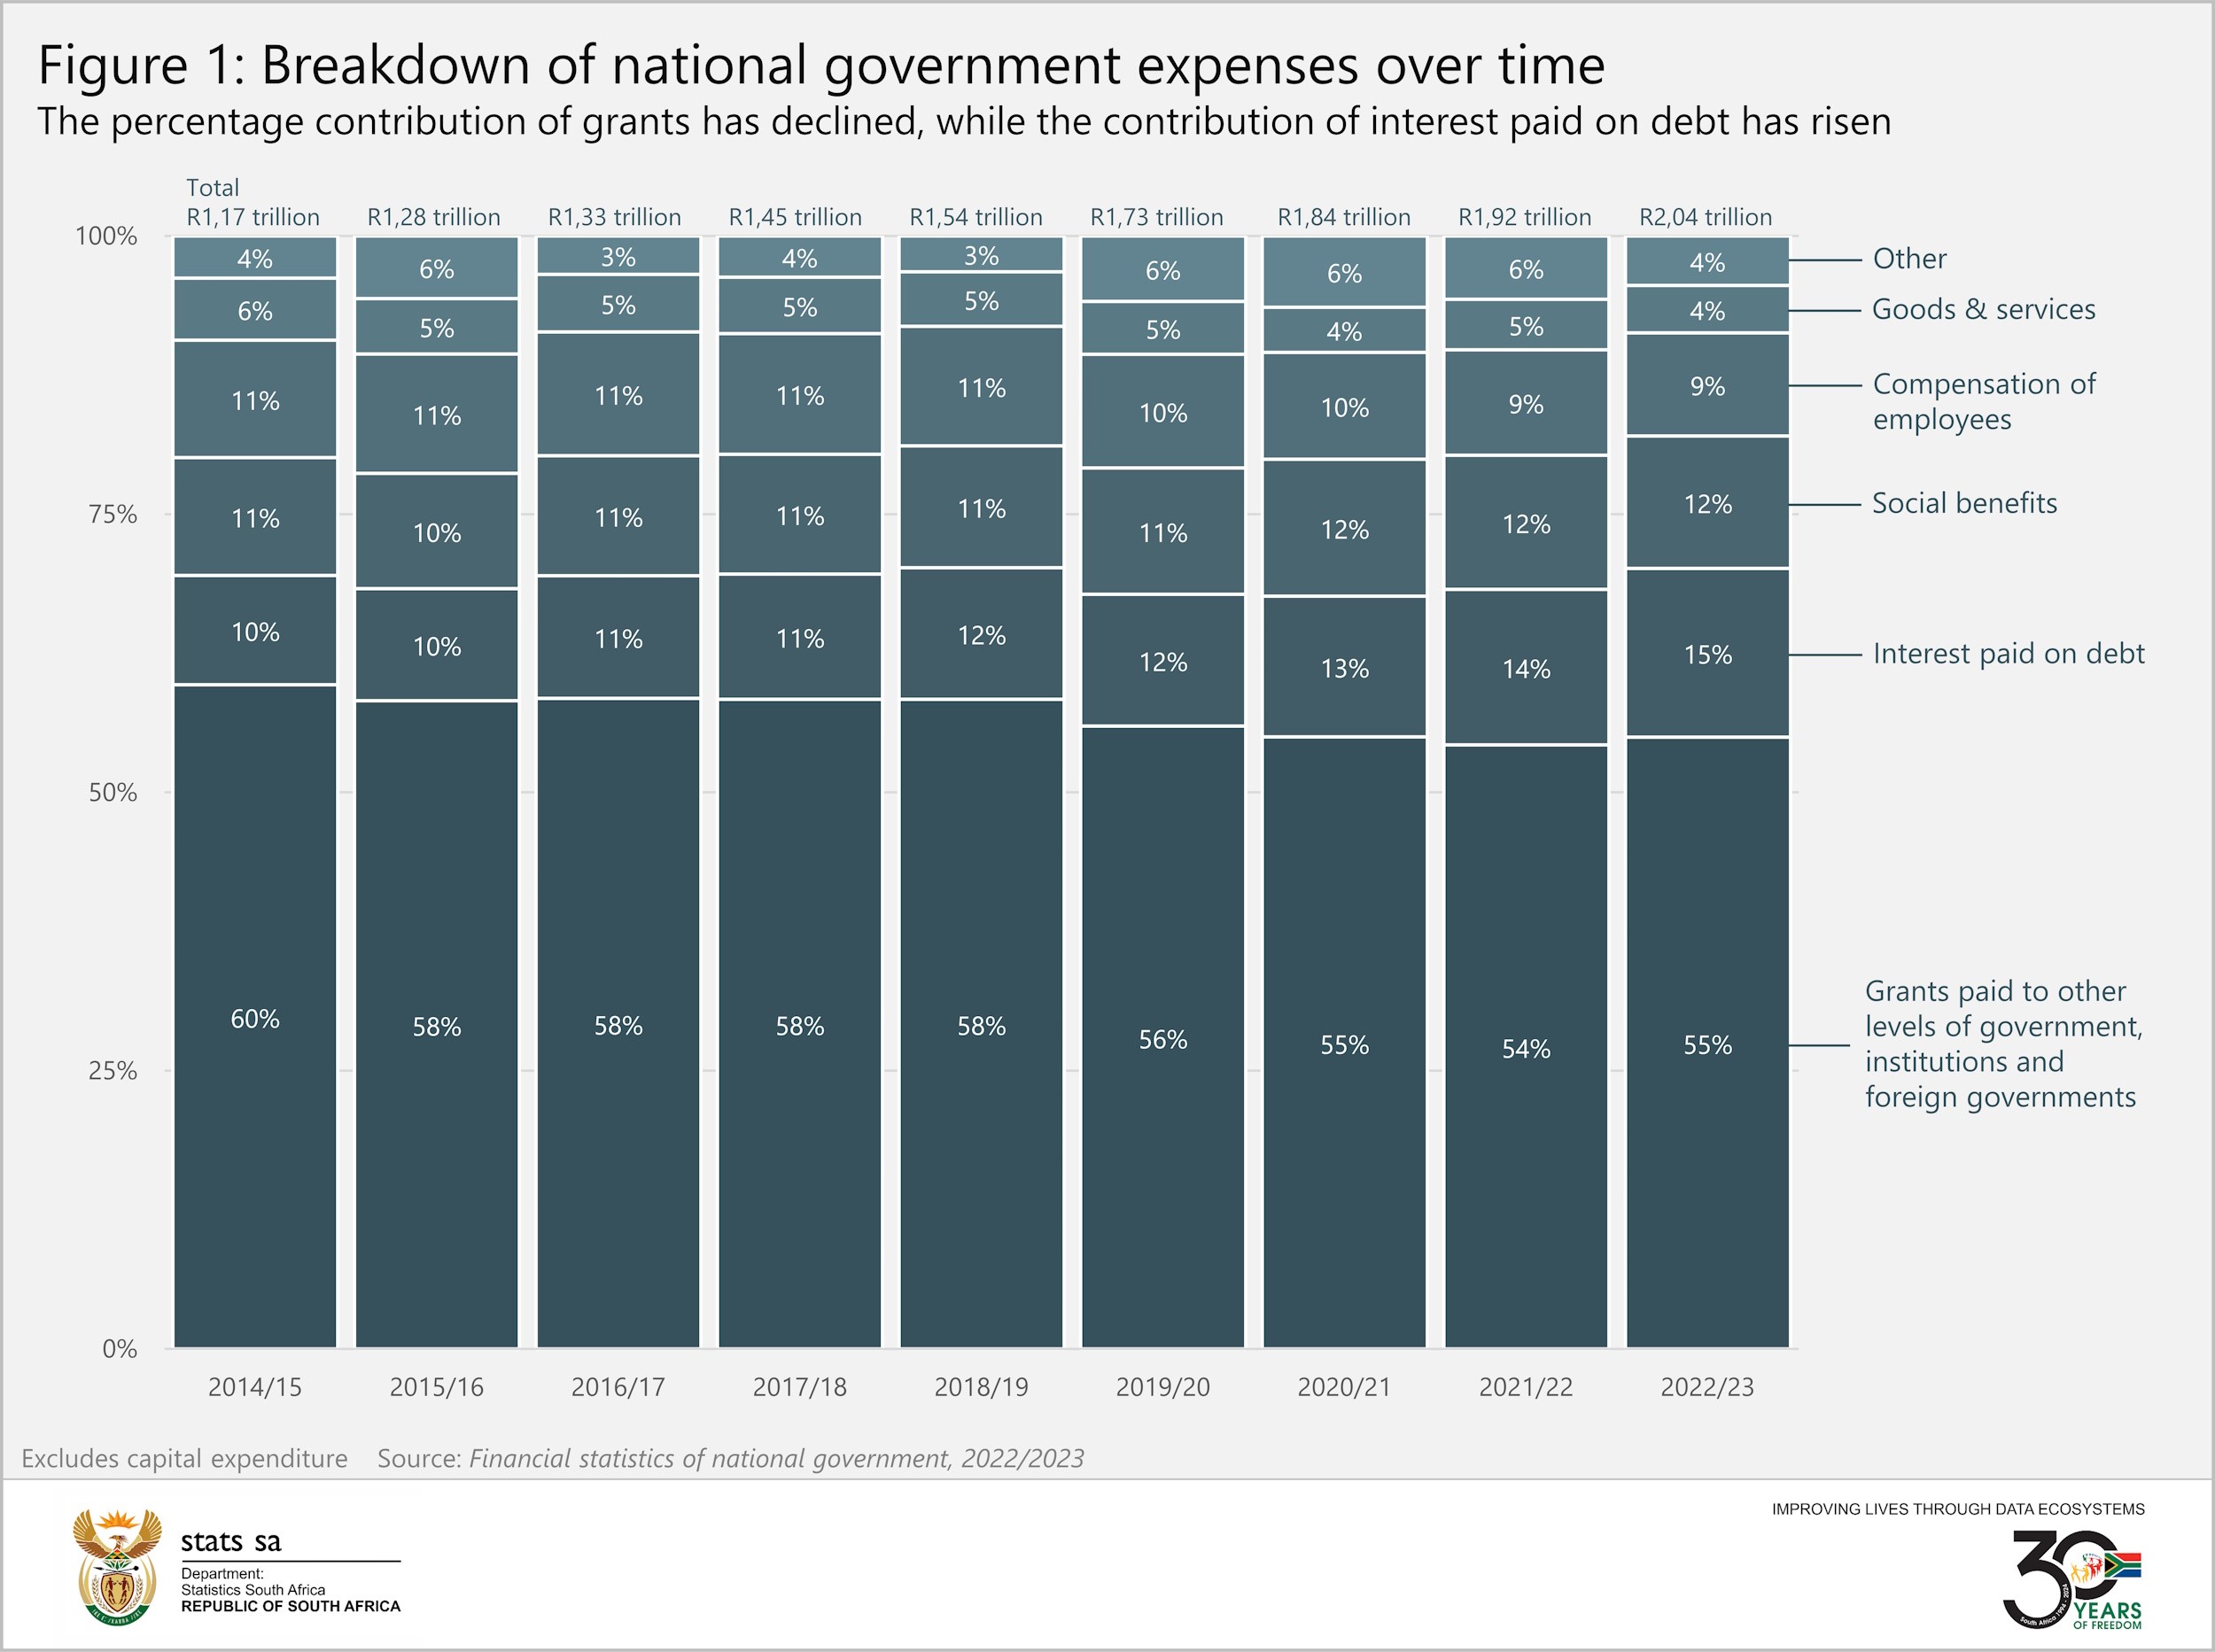
Just over half of total expenses in 2022/23 was allocated to grants paid to other levels of government, institutions and foreign governments (Figure 1). Not to be confused with social grants, this line item represents financial transfers that flow from national government to these institutions. This is not surprising, as one of the tasks of national government is to collect funds (mainly from taxes) and to redistribute these funds to other sectors of the economy.
How are grants allocated?
Grants accounted for R1,12 trillion in 2022/23. Provincial government was the main beneficiary, receiving almost two-thirds (or R694 billion). South Africa’s provincial government departments are responsible for various functions, most notably health and education.
Extra-budgetary accounts & funds – public institutions that are responsible for delivering services to the public on behalf of government – received R180 billion (or 16%) of grants, followed by local government (R151 billion or 13%). Examples of extra-budgetary accounts & funds include the Road Accident Fund, the South African Revenue Service and the Unemployment Insurance Fund.
Higher education institutions and foreign governments received less than R50 billion (or 4%) each. International institutions benefitted from R4 billion (or 0,4%).
The rise in interest paid on debt
As seen in Figure 1, the contribution of interest paid on debt increased from 10% in 2014/15 to 15% in 2022/23. In fact, in rand terms, interest paid on debt more than doubled in the 2014/15 to 2022/23 period, from R114,8 billion to R308,5 billion. This represents an average growth rate of 13,2% per year2, outstripping the rise in total expenses (up 7,2% per year) and all other expense items shown in Figure 1.
What are social benefits?
Social benefits represented the third largest line item in 2022/23 after grants and interest paid on debt, accounting for R242,4 billion. The bulk (96,7%) of this allocation was for the country’s social grant programme, funding household grants for child support, old-age, sickness & disability, as well as others. The remaining 3,3% was for employment-related social benefits.
Since 2014/15, the social benefit allocation has grown by an average of 8,8% per year.
More government financial statistics on the way
The financial statistics covered in this article only represent data collected from national government, which forms a part of the broader general government. The general government comprises national, provincial, local, extra-budgetary accounts & funds and institutions of higher learning. Stats SA publishes separate financial reports on each of these during the year. A consolidated report will be released in November, providing a complete overview of South African government revenue and expenditure.3
Do you want to know more about the figures covered in this article? Download the Financial statistics of national government statistical report for 2022/23 here.
1 The R2,04 trillion excludes capital expenditure and represents expense cash flows recorded by all 42 national government departments. The financial year covers the period 1 April 2022 to 31 March 2023.
2 Calculated using the Compound Annual Growth Rate (CAGR).
3 Reports are scheduled to be published for extra-budgetary accounts & funds in August, provincial government in September, higher education institutions in October, and consolidated general government in November.
Similar articles are available on the Stats SA website and can be accessed here.
For a monthly overview of economic indicators and infographics, catch the latest edition of the Stats Biz newsletter here.