
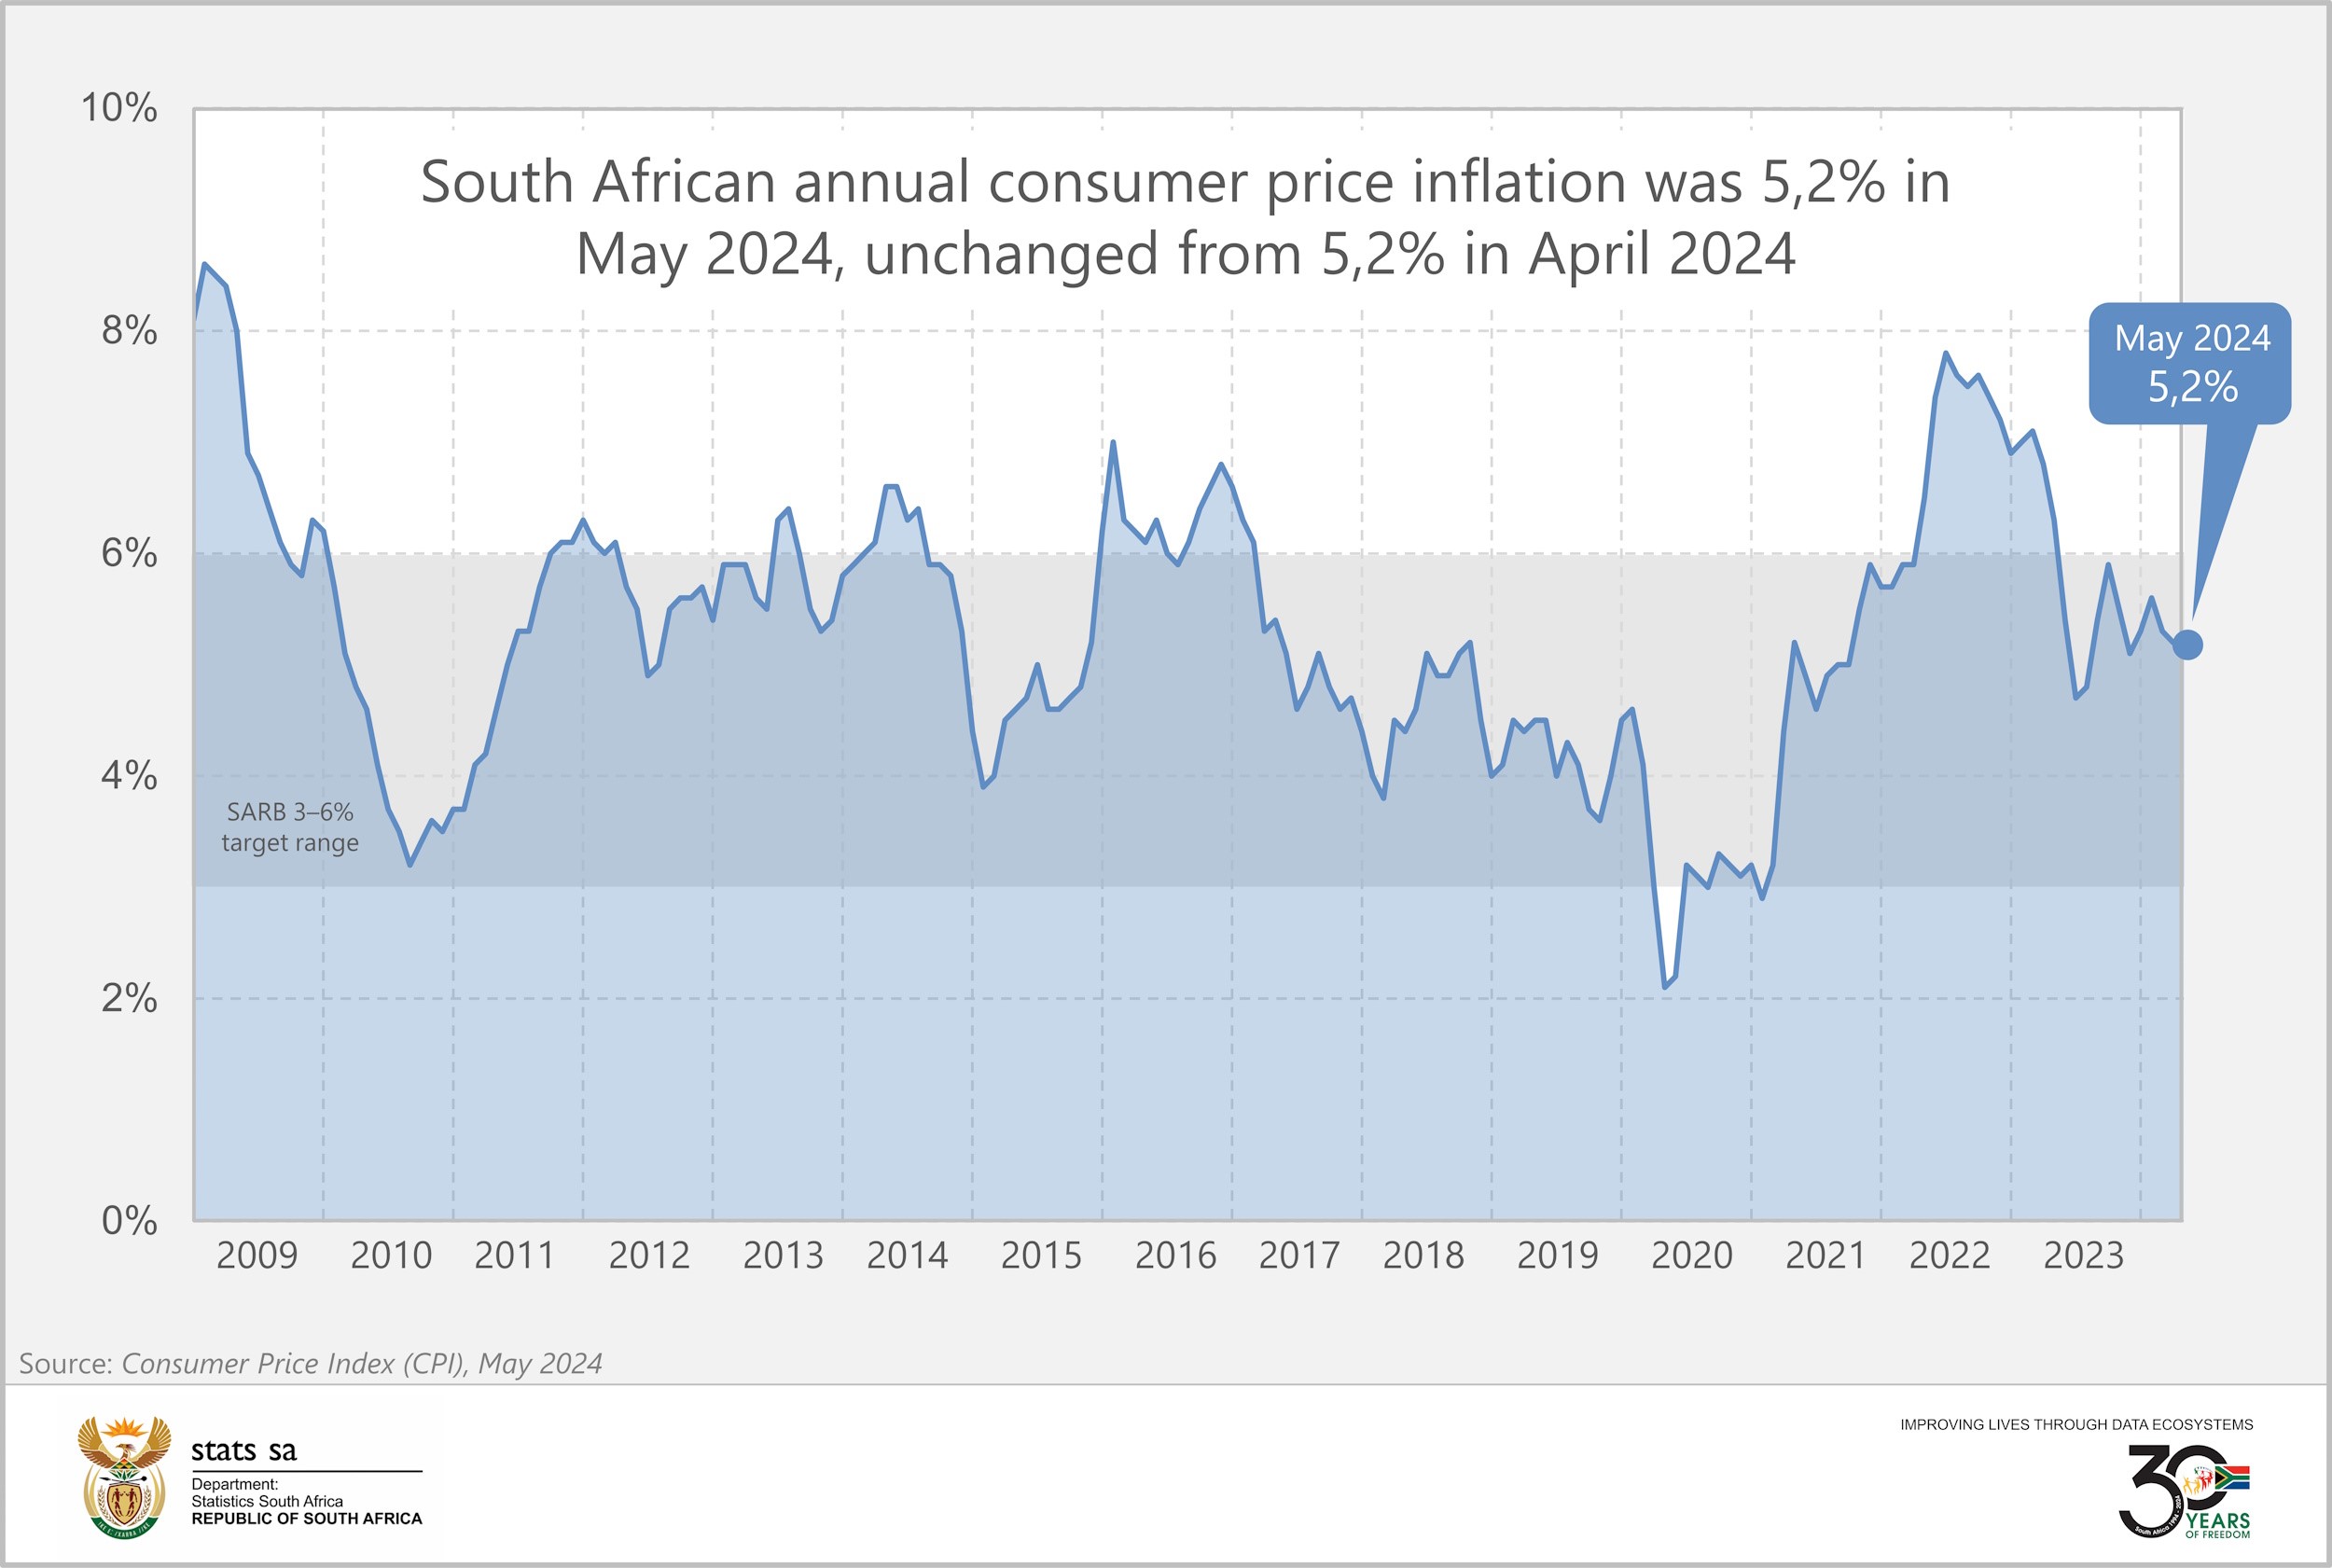
Consumer inflation holds steady in May
Annual consumer price inflation was 5,2% in May, unchanged from April. The monthly change in the consumer price index (CPI) was 0,2%.
Annual rates for four of the twelve product groups remained steady between April and May, including food & non-alcoholic beverages (NAB). Higher rates were recorded for transport, alcoholic beverages & tobacco and recreation & culture. Inflation was softer for miscellaneous goods & services, communication, clothing & footwear, health and restaurants & hotels
Food inflation stalls
After five consecutive months of decline, food & NAB inflation remained steady at 4,7% in May, unchanged from April. Bread & cereals continued to trend downward, slowing further to 3,9%. This is the lowest annual reading for bread & cereals since February 2022 when the rate was 3,7%.
Nine of the twenty bread & cereal products in the inflation basket are cheaper than a year ago. Rusks, hot cereals, pasta and savoury biscuits registered the largest price decreases. Inflation remains notably hot, however, for rice, pizza & pies, sweet biscuits, cakes & tarts and bread rolls.
Milk, eggs & cheese inflation moderated for a fifth consecutive month, on the back of slower price increases for cheese, selected milk products and eggs. The annual rate for eggs remains elevated at 21,0% but is softer than April’s 25,1%.
Inflation for sugar, sweets & desserts also continued a downward trajectory, dampened by lower rates for sugar, jam, chocolate and ice cream. Although sugar inflation cooled in May, annual increases for both white and brown varieties remain in double-digit territory, at 18,8% and 15,8% respectively.
May saw an uptick in inflation for hot beverages, oils & fats, fish, fruit, vegetables and meat. Hot beverages quickened from 11,4% in April to 14,2% in May, the highest since January 2023 (16,4%). Inflation for instant coffee, ground coffee or coffee beans and black tea stands above 10%. Instant coffee prices rose by an annual 17,9%, up from 13,8% in April.
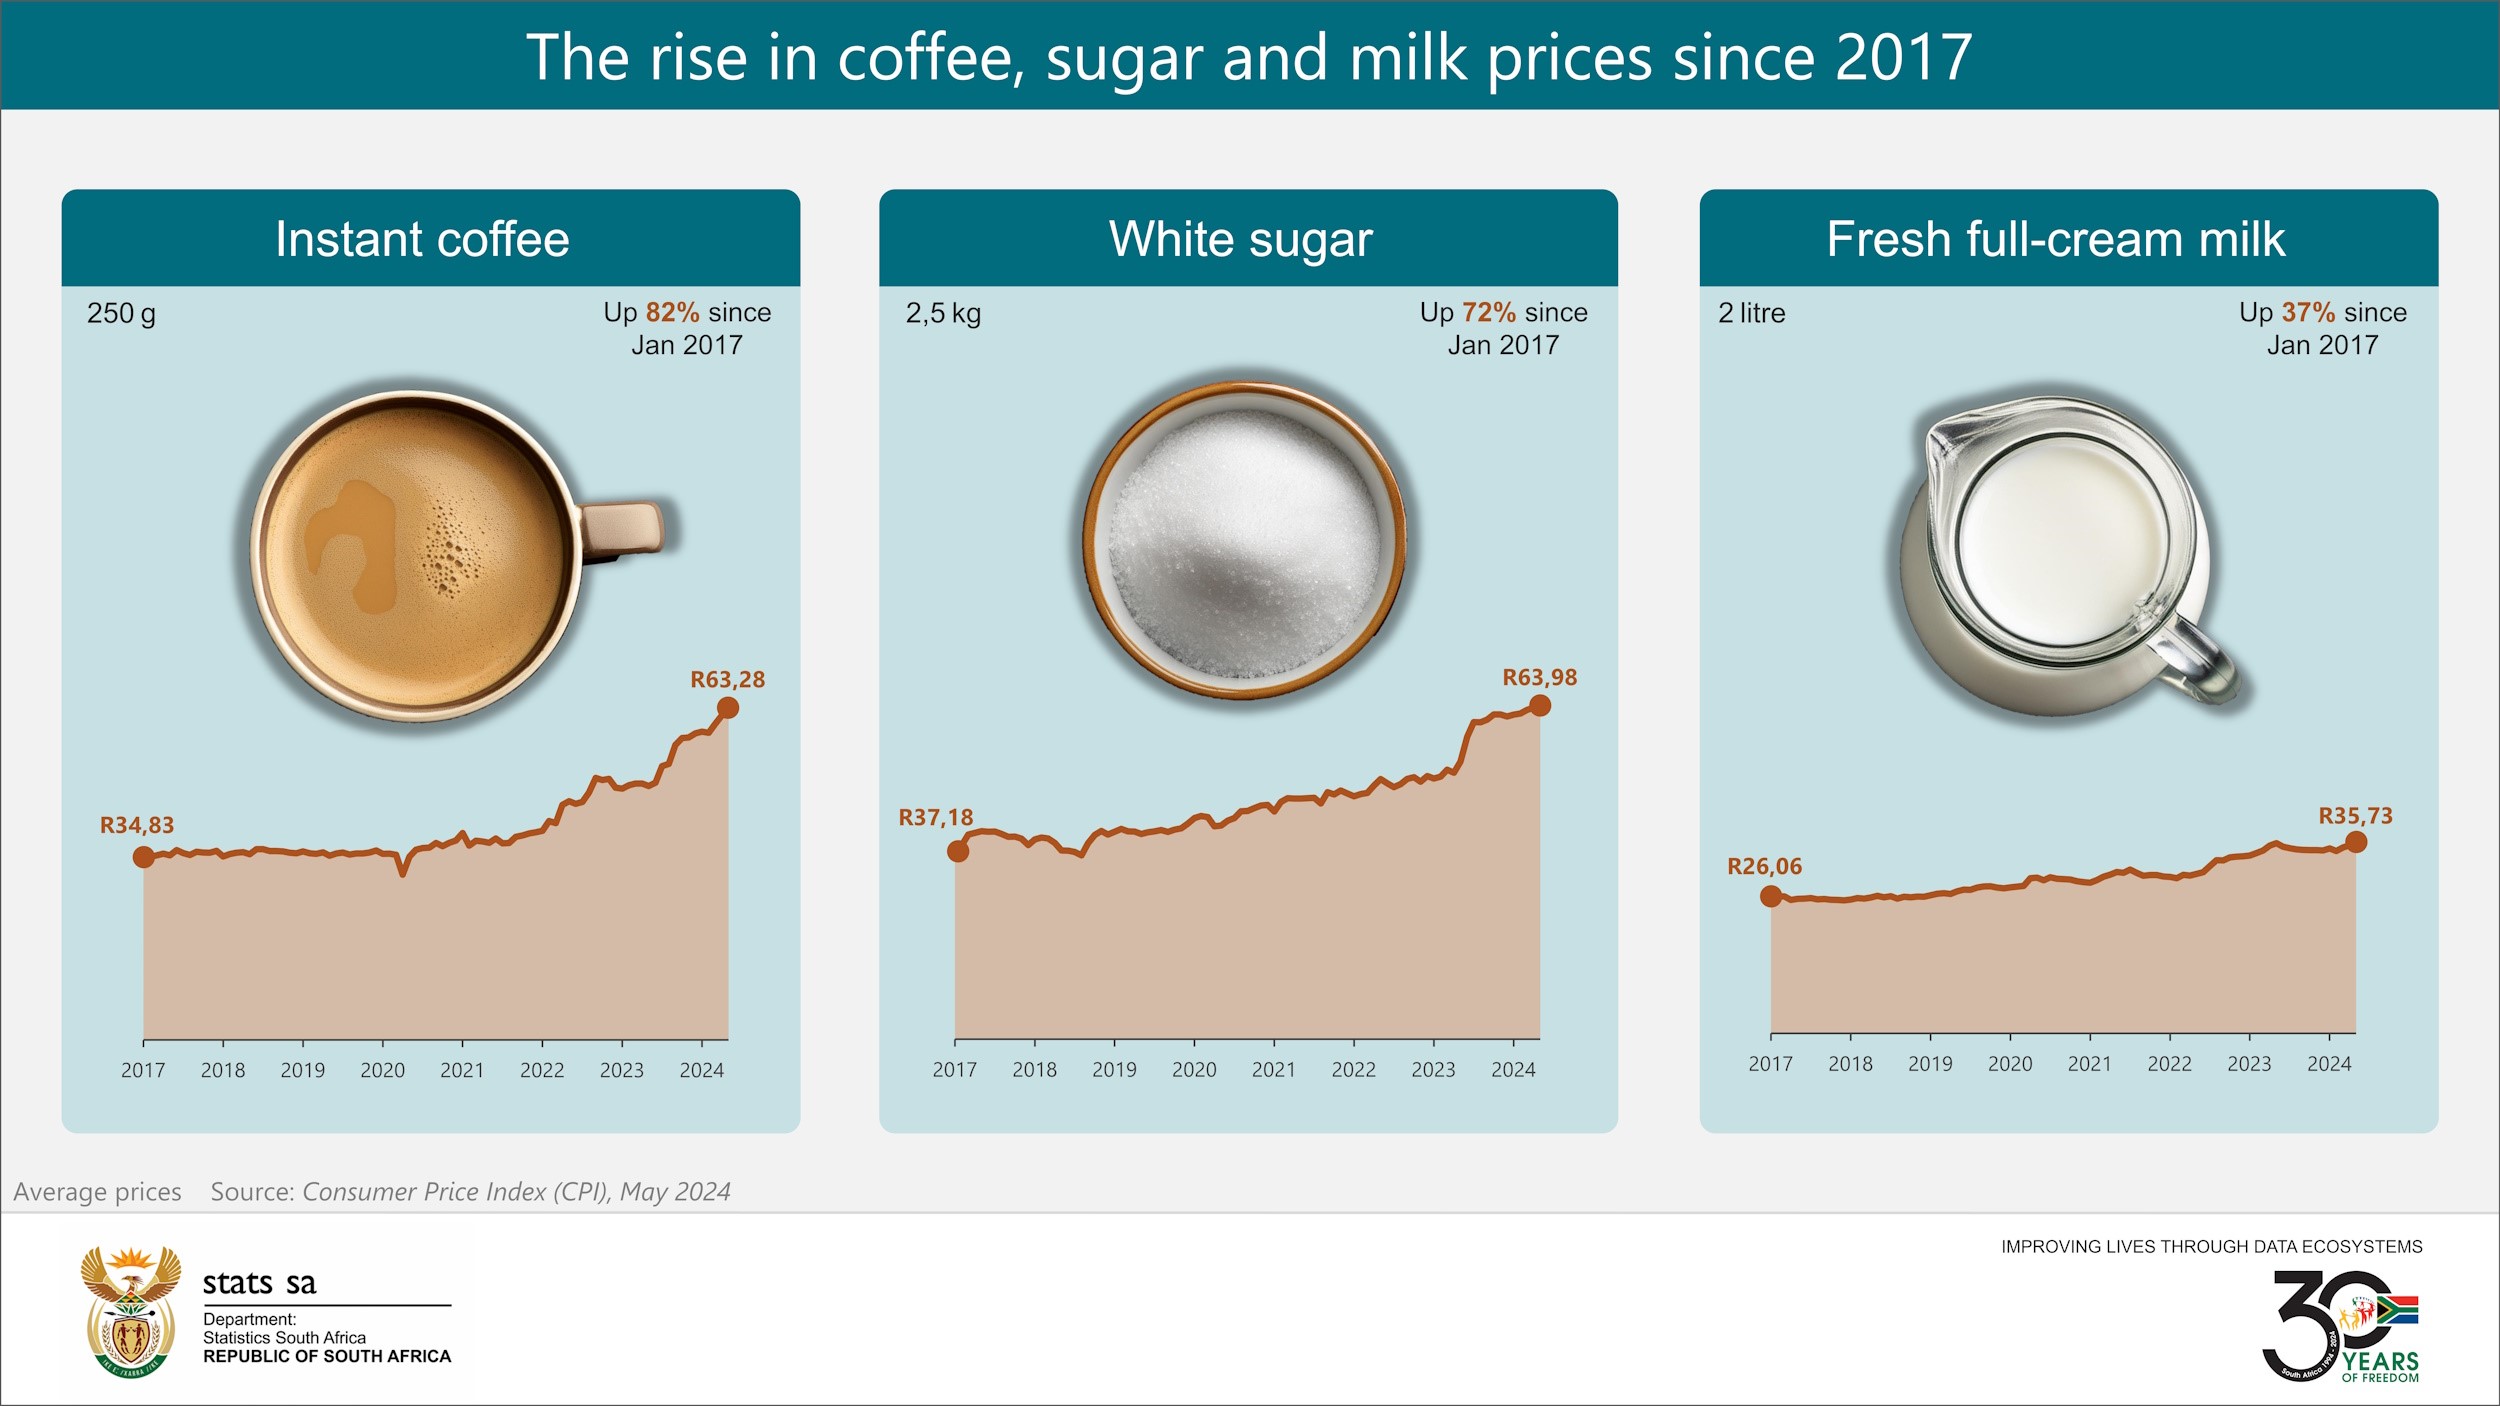
Digging a little deeper into the data, the average price for instant coffee (250 g) was 82% higher in May 2024 than in January 2017 (when Stats SA started publishing average prices). Many coffee drinkers enjoy sugar and milk in their favourite brew, and these have also risen in price over the same period, although not as sharply as coffee
Other notable price changes in May
With winter chills currently setting in, the price for cold & flu medication witnessed an annual rise of 11,1%. Other health-related products that recorded relatively large increases include eyedrops (up 15,9%), laxatives (up 11,3%), cough syrup (up 8,1%) and vitamins (up 7,1%). Despite these increases, overall inflation for health products cooled from 7,7% in April to 5,8% in May.
Transport quickened to 6,3% from 5,7% in April. This is the highest rate for the category since October 2023 (7,4%). Fuel was the major culprit, with petrol and diesel prices increasing on average by 9,3% over the last 12 months (and by 0,6% since April 2024).
The index for restaurants & hotels rose by an annual 6,5%. Hotel prices were up by 8,0% over the same period, with hotels in Gauteng, Free State and Limpopo registering increases higher than 10%.
The miscellaneous goods & services category recorded an annual rate of 7,1%, slightly softer than 7,2% in April. Personal care products recorded a fifth consecutive month of disinflation, slowing to 7,0% in May from a recent high of 10,3% in December 2023. Personal care products with the highest inflation rates in May were baby powder (up 18,4%), shampoo (up 16,6%), toothbrushes (up 16,5%) and toothpaste (up 16,1%).
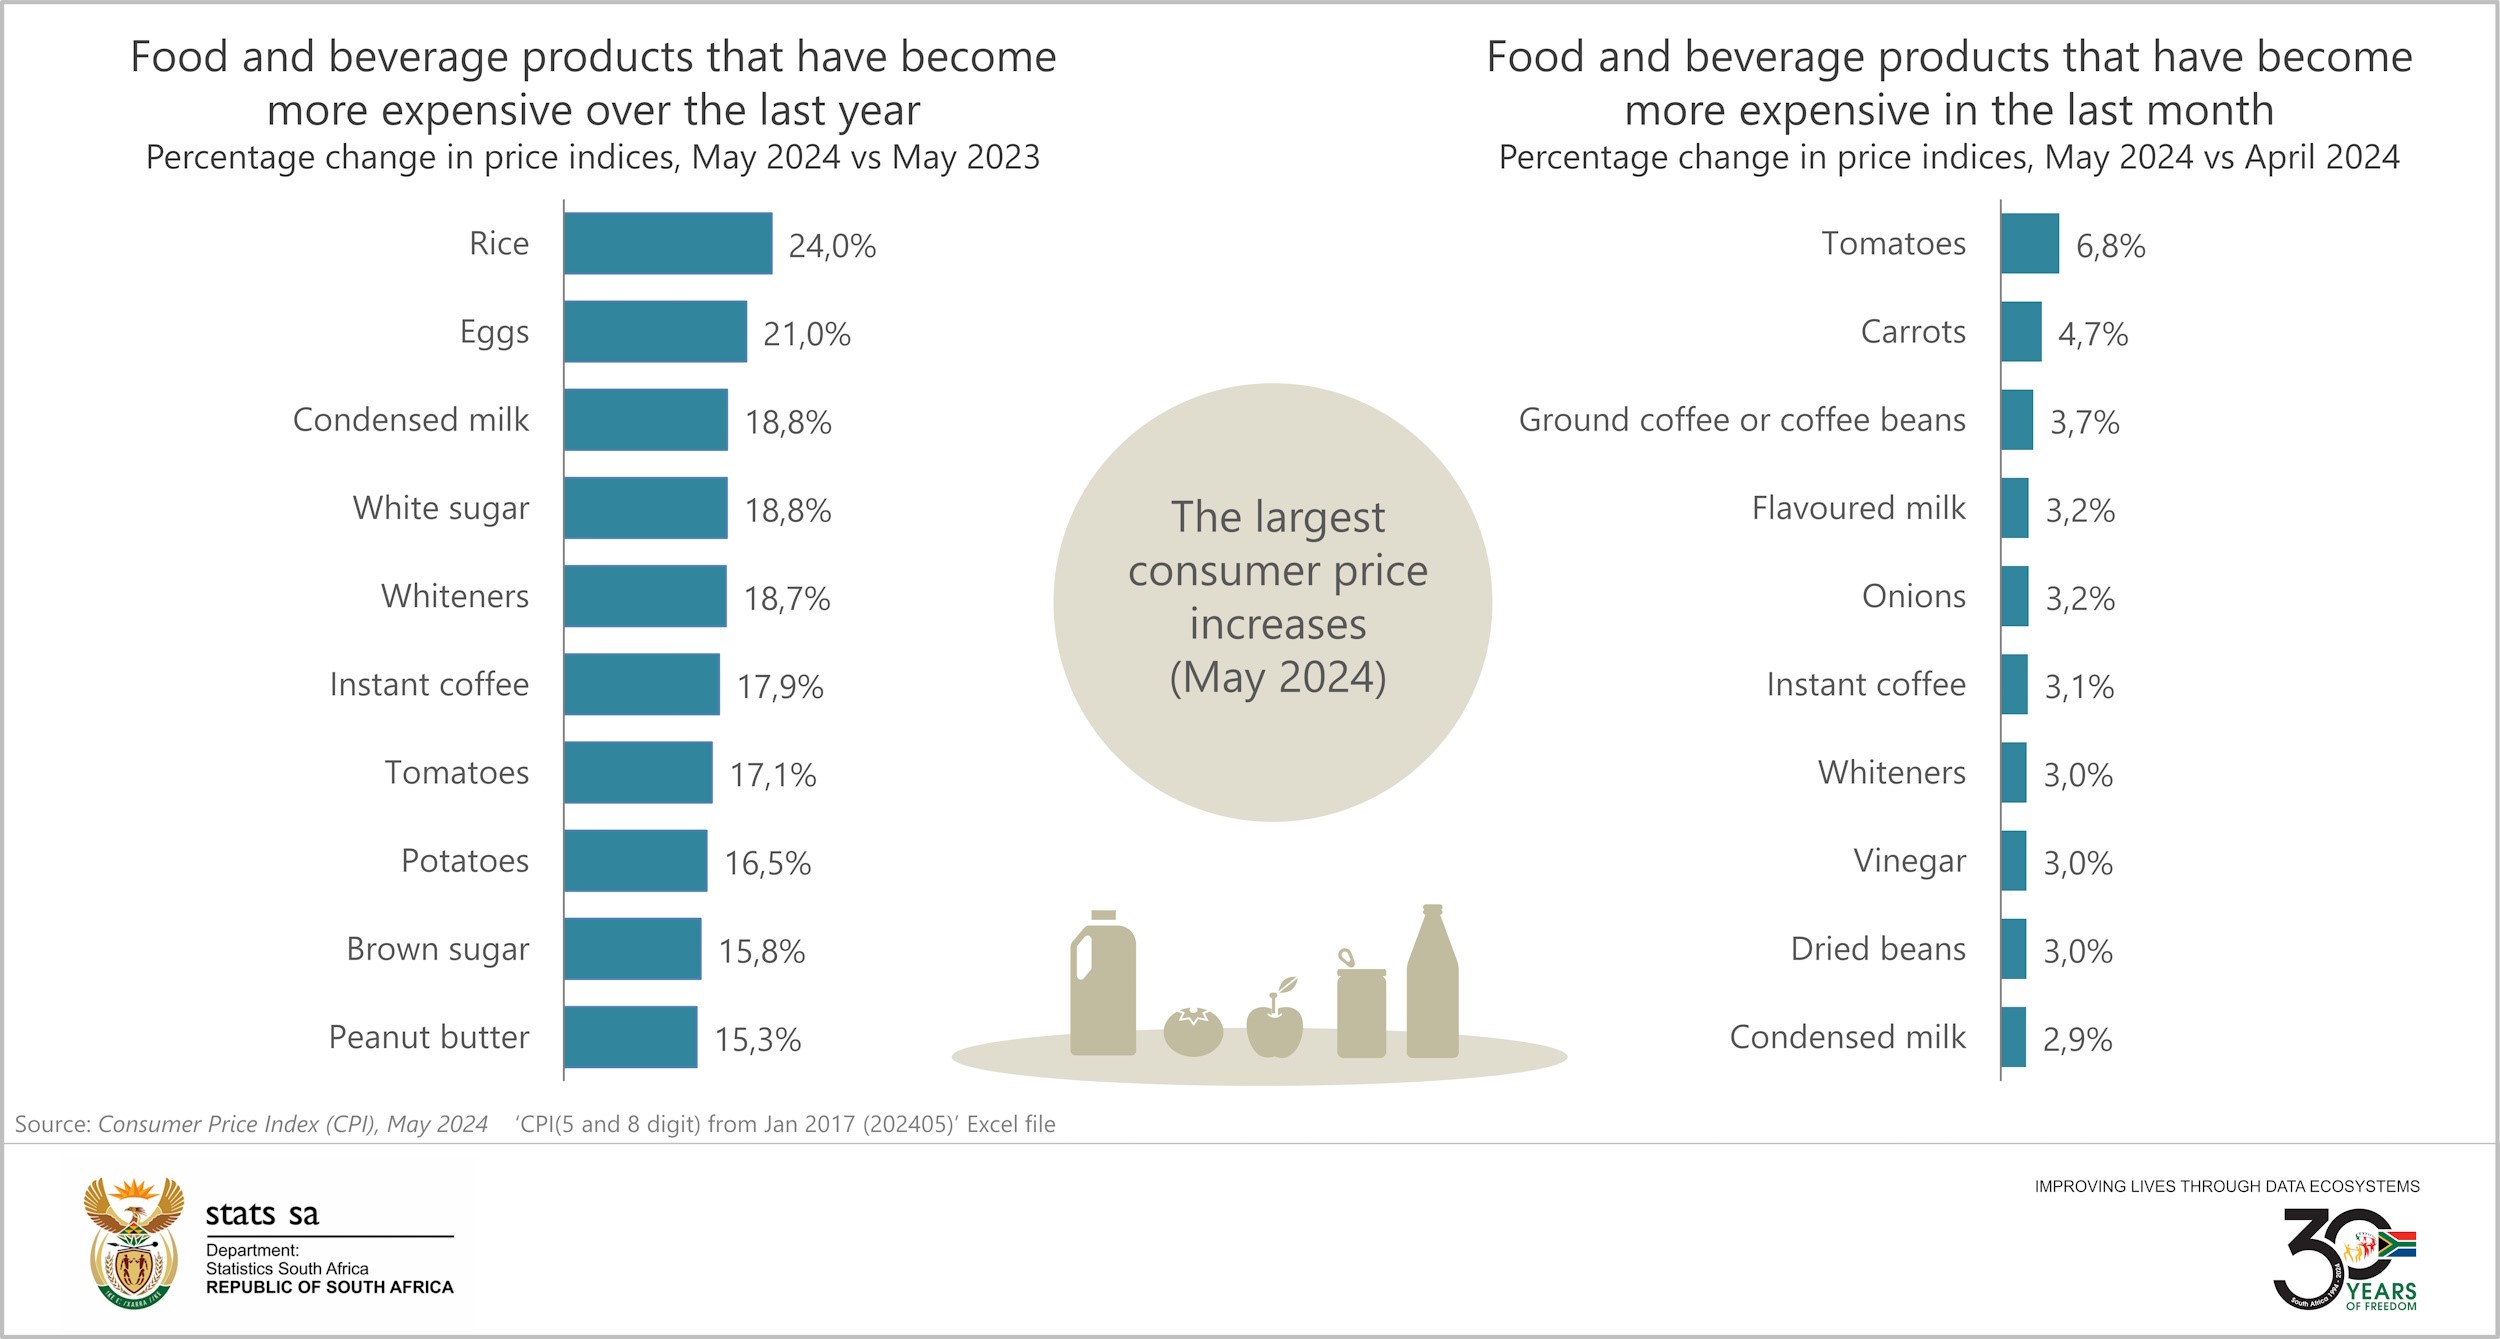
The graphs below show food and beverage products that recorded the most significant annual and monthly price increases in May.
Download the May 2024 consumer price index (CPI) statistical release and Excel files with indices and average prices here. The archive is available here.
Similar articles are available on the Stats SA website and can be accessed here.
For a monthly overview of economic indicators and infographics, catch the latest edition of the Stats Biz newsletter here.