
Economy 0,1% weaker in the first quarter
Real gross domestic product (GDP) contracted by a marginal 0,1% in the first quarter (January–March) of 2024.1 This followed a revised 0,3% increase in the fourth quarter of 2023. Weaker manufacturing, mining and construction drove much of the downward momentum on the production (supply) side of the economy, while the expenditure (demand) side witnessed a decline across all components.
Agriculture rallies, but not enough to keep GDP growth in positive territory
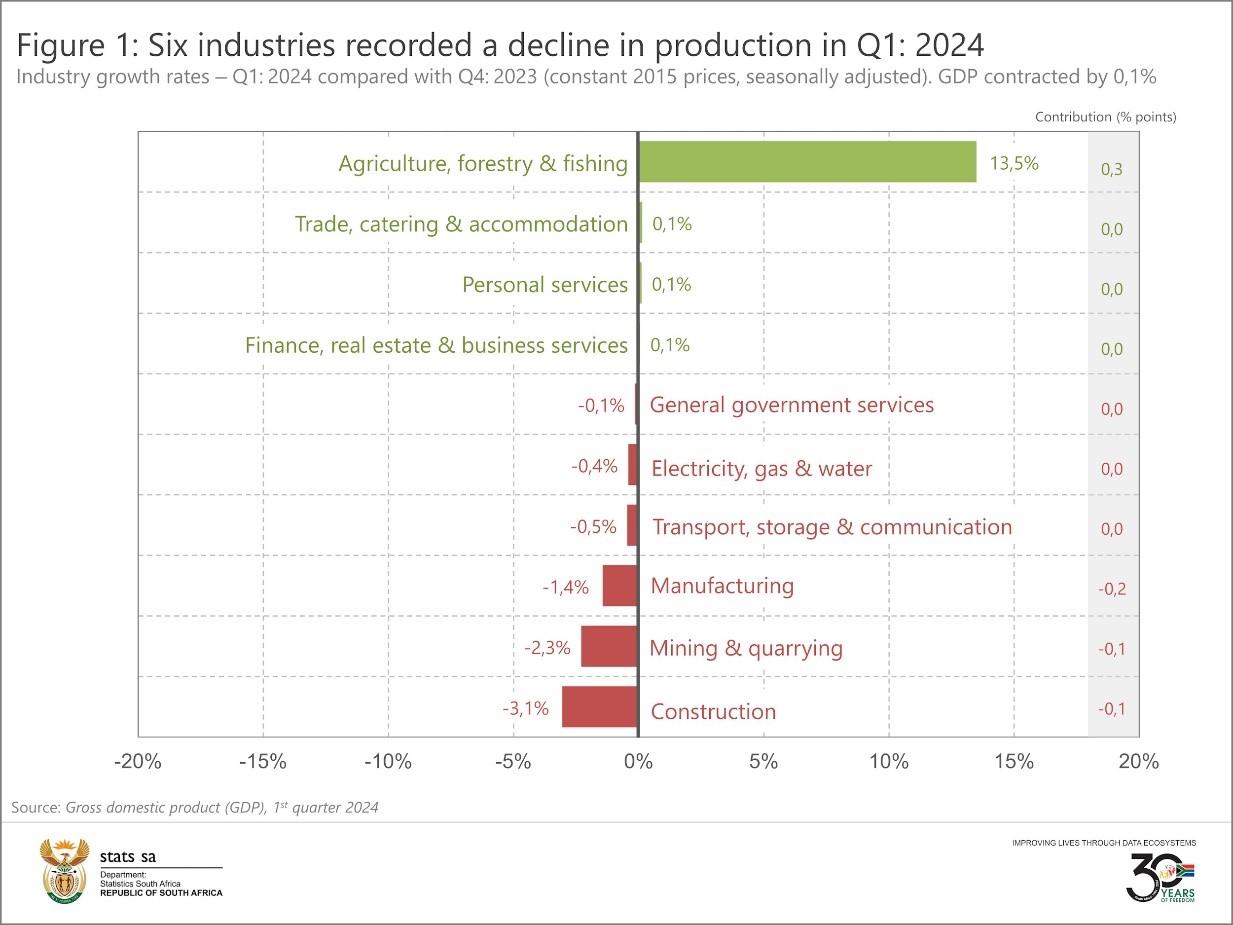
Six of the ten industries on the production side of the economy performed poorly in the first quarter (Figure 1). Manufacturing was the largest negative contributor, declining by 1,4% and pulling GDP growth down by 0,2 of a percentage point.
Five of the ten manufacturing divisions recording a lacklustre quarter. The automotive sector was the largest negative contributor, pulled lower by weaker demand for new vehicles and transport parts & accessories.
Mining output contracted by 2,3%, with platinum group metals, coal, gold and manganese ore the largest drags on growth.
Construction continued a downward trend, recording a fourth consecutive quarter of decline. The industry shrank further by 3,1% in the first quarter, pulled lower by weaker economic activity related to residential buildings and construction works.
Agriculture was the largest positive contributor in the first quarter. The industry expanded by 13,5%, spurred on mainly by a buoyant horticulture sector that recorded a rise in the production of fruit. Other positive contributors include maize and animal products.
The trade, catering & accommodation, personal services and finance, real estate & business services industries also registered positive growth, but only just managed to keep their heads above water. Trade, catering & accommodation was marginally up on stronger wholesale trade sales, tourist accommodation, and economic activity in the restaurant, catering and fast-food sector.
The personal services industry was slightly stronger due to positive growth in health and education.
Expenditure on GDP declines in the first quarter
Stats SA also measures the expenditure side of the GDP, providing an indication of total demand in the economy. Government consumption, household consumption, investment (gross fixed capital formation and changes in inventories), exports and imports were all down in the first quarter (Figure 2).
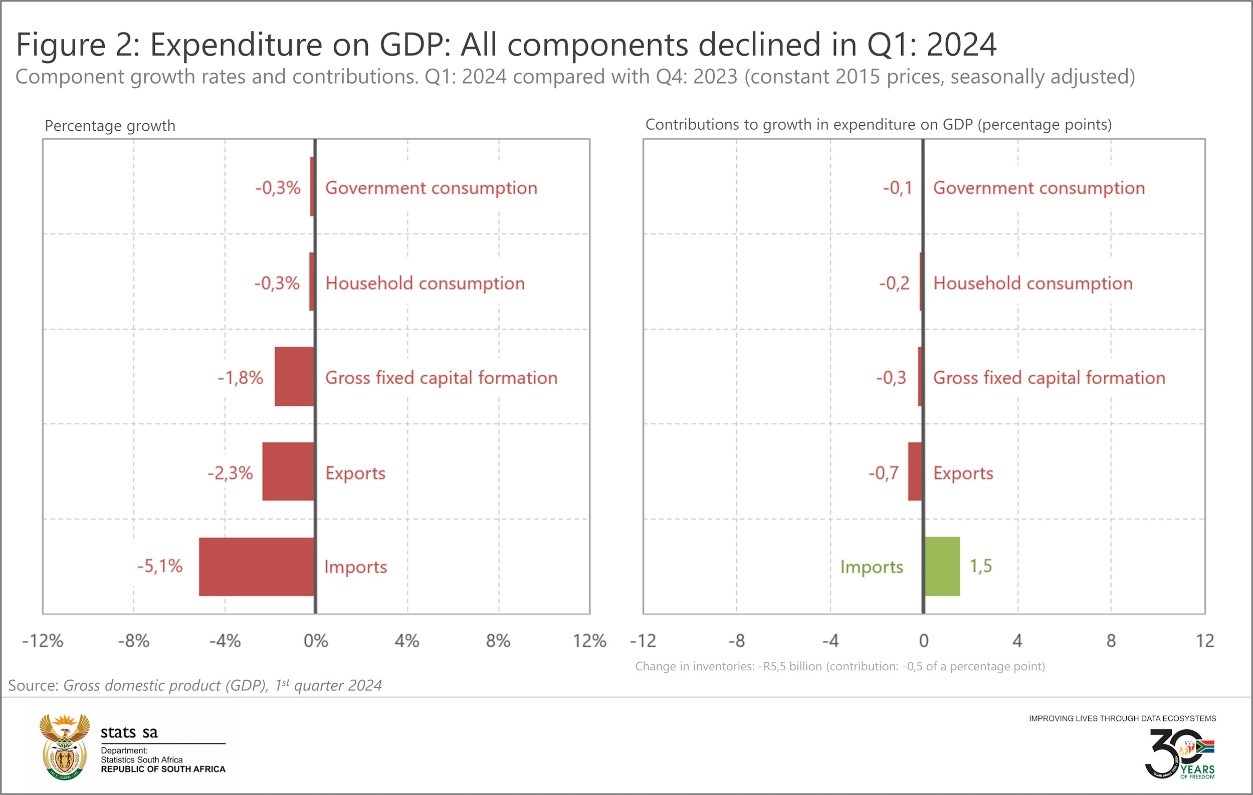
Exports decreased by 2,3%, pulling overall expenditure on GDP growth down by 0,7 of a percentage point. The decline was mainly due to weaker exports of precious stones and precious metals, vehicles & transport equipment (excluding aircraft), chemical products, base metals and mineral products. Despite the overall negative growth, exports of vegetable products increased in the first quarter, reflecting the agriculture industry’s positive showing on the supply side of the economy.
Imports were also down, largely influenced by decreased trade in mineral products, vehicles & transport equipment (excluding aircraft) and vegetable products.
Weaker domestic production and decreased imports in the first quarter stymied the flow of goods in the economy. As a result, the manufacturing, mining and personal services industries drew from their inventories. The R5,5 billion drawdown in the first quarter was the second largest drag (after exports) on overall economic growth, contributing -0,5 of a percentage point.
Gross fixed capital formation, which includes investment in infrastructure and other fixed assets, remained under pressure for a third consecutive quarter. The 1,8% decline was led by weaker investment in machinery & equipment, residential buildings and construction works.
Household final consumption expenditure also decreased in the first quarter. Consumers cut back on spending, particularly on clothing & footwear, transport, miscellaneous goods & services, alcoholic beverages, tobacco & narcotics, and recreation & culture. On the flipside, there was a rise in spending on household furniture & appliances, restaurants & hotels, food & non-alcoholic beverages, and housing, water, electricity, gas & other fuels.
For more information, download the latest GDP release, media presentation and Excel files here.
1 The quarter-on-quarter rates are seasonally adjusted and in real (volume) terms (constant 2015 prices).
Similar articles are available on the Stats SA website and can be accessed here.
For a monthly overview of economic indicators and infographics, catch the latest edition of the Stats Biz newsletter here.