Economic wrap-up for March 2024
Stats SA had a packed publication schedule in March. The statistical agency published 37 releases in the month, including several annual and quarterly reports.
Notable releases: Tourism, water and municipal services
The headwinds from the COVID-19 pandemic hit all industries hard, including the tourism sector. Although tourism is slowly returning to an even keel, it has not yet fully recovered according to the latest Tourism Satellite Account for South Africa report. Various indicators have improved since 2020, but remain below their 2019 levels. These include tourism’s contribution to gross domestic product (GDP), tourism direct employment, and the amount of money that non-resident visitors spend while in the country. One notable star was domestic tourism expenditure that bounced back sharply in 2022, exceeding its 2019 level.
Four years before the pandemic, parts of the country were struggling with another challenge – severe drought. The Breede Catchment in Western Cape, an important water source for the City of Cape Town, experienced a notable decline in rainfall in 2016/2017. Within the catchment, high evaporation ratios were estimated for areas around the town of Worcester. This is according to the Sub-national Water Resource Accounts, 2015 to 2021 discussion document, which outlines modelled estimates of rainfall, evaporation and water flows for three water-catchment areas.
A key challenge for the government is to ensure that water resources are adequately supplied to households, businesses and industries. The latest Non-financial census of municipalities report shows that there was a rise in the number of consumer units receiving water services from municipalities between 2018 and 2022. Despite this increase, fewer consumer units receive this service for free.
Many municipalities also provide alternative forms of energy to poorer households in unelectrified areas. The solar home system is an example, with 149 919 households benefitting in 2022.
Monthly indicators published in March
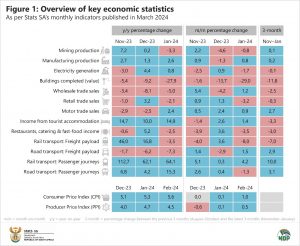
As solar energy becomes more widely used among households and businesses alike, the country’s power grid continues to struggle to meet demand. The volume of electricity generated by South Africa in 2023 was the lowest in two decades. More recent data show a 0,1% decline in electricity generation in the three months to January 2024 (Figure 1).
Other industries that recorded weaker results in the three months to January include construction (buildings completed as reported by large municipalities); wholesale trade; retail trade; tourist accommodation; restaurants, catering & fast food; and rail freight.
Want to find out what Stats SA has to offer in the coming month? Keep up to date with our publication schedule here. For a comprehensive list of products and releases, download our catalogue here. For a regular update of indicators and infographics, visit our data story feed and download the latest edition of the Stats Biz newsletter.


