
Marriage Registrations in South Africa Declining
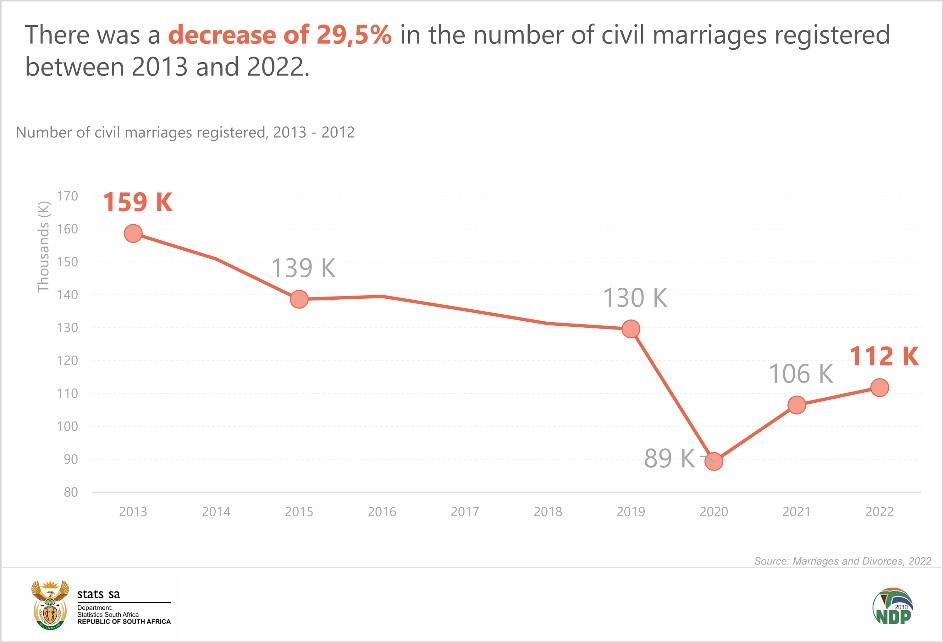
The administrative data on civil marriages indicates a notable downward trend in marriage registrations. As outlined in the Marriages and Divorces report for 2022, published by Statistics South Africa, there has been a significant decline of 29,5% in the number of civil marriages recorded between 2013 and 2022. Even when considering the impact of COVID-19 restrictions on gatherings, which led to reduced marriage registrations in 2020 and 2021, the overall trend still indicates a decline in the number of marriages. From 2013 to 2022, the highest number of marriages was recorded in 2013 (158 642) and the lowest number in 2020 (89 338).
It is a commonly observed phenomenon that husbands are often older than their wives. However, there remains a notable portion of marriages where wives are older than their husbands. Among the 111,784 civil marriages registered at the Department of Home Affairs in 2022, there were 18,290 instances, constituting 16,4% of marriages, where women were older than their partners. In terms of age distribution, 31 years emerged as the most prevalent age for men registering civil marriages in 2022, with 4,477 instances recorded. Conversely, age 30 was the predominant age for women, with 5,467 instances noted.
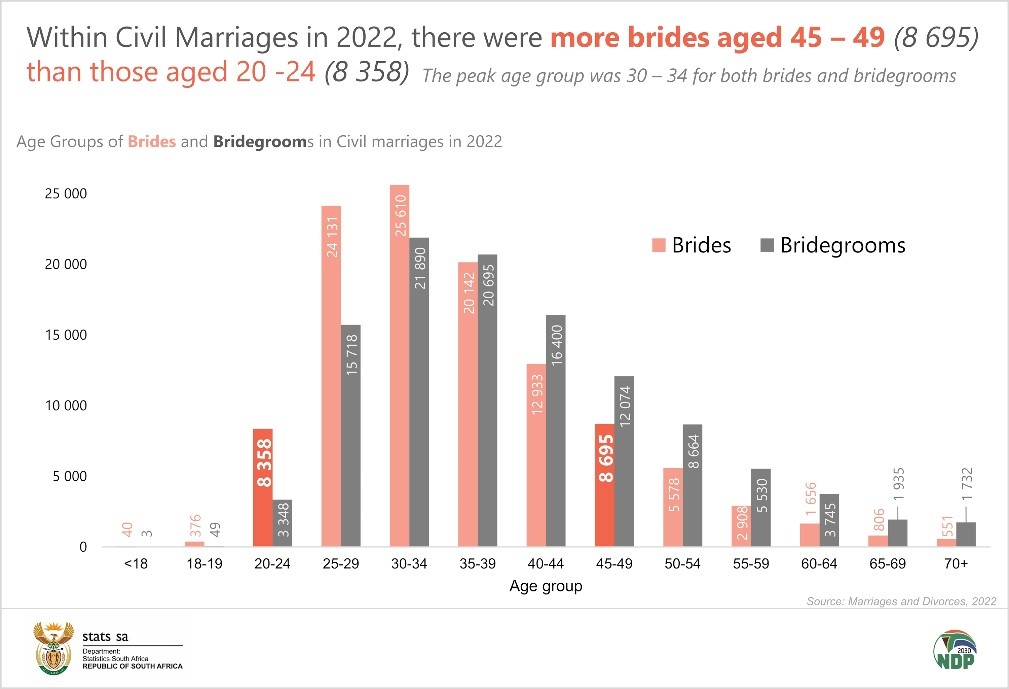
In civil marriages conducted in 2022, the number of brides aged 45 – 49 (8,695) exceeded those aged 20 – 24 (8,358). The peak age group for both brides and bridegrooms was 30 – 34.
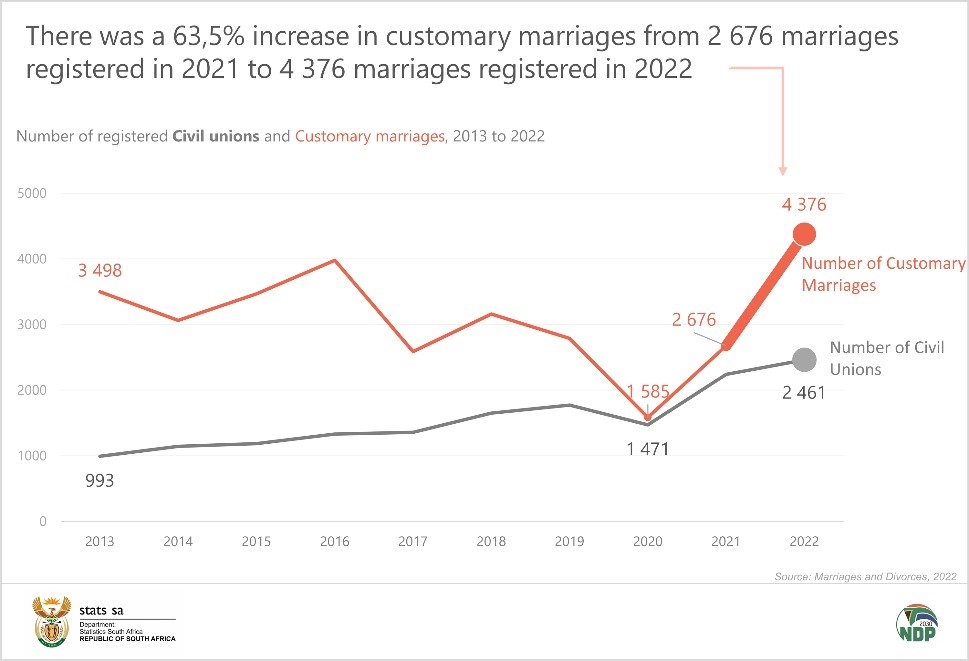
In contrast to civil marriages, there have been slight upticks in the numbers of customary marriages and civil unions registered. Civil unions have seen an increase from 993 unions in 2013 to 2,461 unions registered in 2022. Similarly, registered customary marriages have displayed fluctuations over the years but have experienced a notable rise of 63,5% from 2,676 marriages in 2021 to 4,376 marriages in 2022.
Rural provinces in South Africa have notably higher prevalence rates for customary marriages. Limpopo accounted for the most significant share, with 1,252 registrations (28,6%), followed by KwaZulu-Natal with 881 (20,1%), Eastern Cape with 845 (19,3%), and Mpumalanga with 633 (14,5%). The remaining provinces each contributed less than 10%.
In terms of civil unions, Gauteng recorded the highest number with 1,032 registrations (41,9%), followed by Western Cape with 721 (29,3%). Together, these two provinces accounted for 71,2% of the civil unions registered in 2022.
Divorces
In 2022, a total of 20,196 divorces were granted, marking a 10,9% increase from the 18,208 divorces granted in 2021. The most prevalent age recorded for male divorcees was 42 years, comprising 796 cases, while for females, the most prevalent age at divorce was 39 years, with 902 cases granted in 2022.
Divorces have profound ramifications, particularly for the children involved. Of the 20,196 divorce cases, approximately 11,164 (55,3%) involved children younger than 18 years, while 9,032 (44,7%) divorces occurred without children. The divorces that occurred in 2022 affected a total of 18,850 children under the age of 18. Analysis of divorcees’ profiles revealed that among white individuals, over half of the recorded divorces occurred in couples without children, accounting for 55,8%. Conversely, 59,3% and 57,3%, respectively, of black African and Coloured divorces involved couples with children.
For more information, download the Marriages and Divorces, 2022 report here