
Liquid ledger: SA develops experimental water resource accounts
A water resource account is a balance sheet for a particular geographical area, providing data on water inflows, water outflows and changes in water storage. Water resource accounts in South Africa are physical accounts at the catchment scale, quantifying changes in stocks, flows and water consumption within a defined spatial and temporal domain.
Statistics South Africa (Stats SA), the South African National Biodiversity Institute (SANBI) and the University of KwaZulu-Natal’s (UKZN) Centre for Water Resources Research (CWRR) recently released a detailed set of experimental water resource accounts for three catchment areas. These are the Mooi and uMngeni Catchments (important water sources for Pietermaritzburg and eThekwini), and the Breede Catchment (an important water source for Cape Town).
These accounts, published in the Sub-national Water Resource Accounts, 2015 to 2021 discussion document, provide modelled estimates of water flows at different catchment scales. The document also includes water resource accounts disaggregated by land cover type, water resource flow accounts with reference state, and eight water resource indicators. The accounts facilitate the exploration of linkages between land cover, land use, ecological infrastructure and catchment water resources.
Below is a taste of what the document offers, focussing on the Breede Catchment. The data can be used to inform water resource planning and management by answering several important questions.
How do water flows change over time?
The Breede Catchment, located in the Western Cape province, covers an area of 12 562 km2. Figure 1 provides a bird’s-eye view of all inflows (total in) and outflows (total out) of water for the catchment, for the hydrological years 2015–2016 to 2020–2021. A hydrological year covers the months of October to September of the following year.
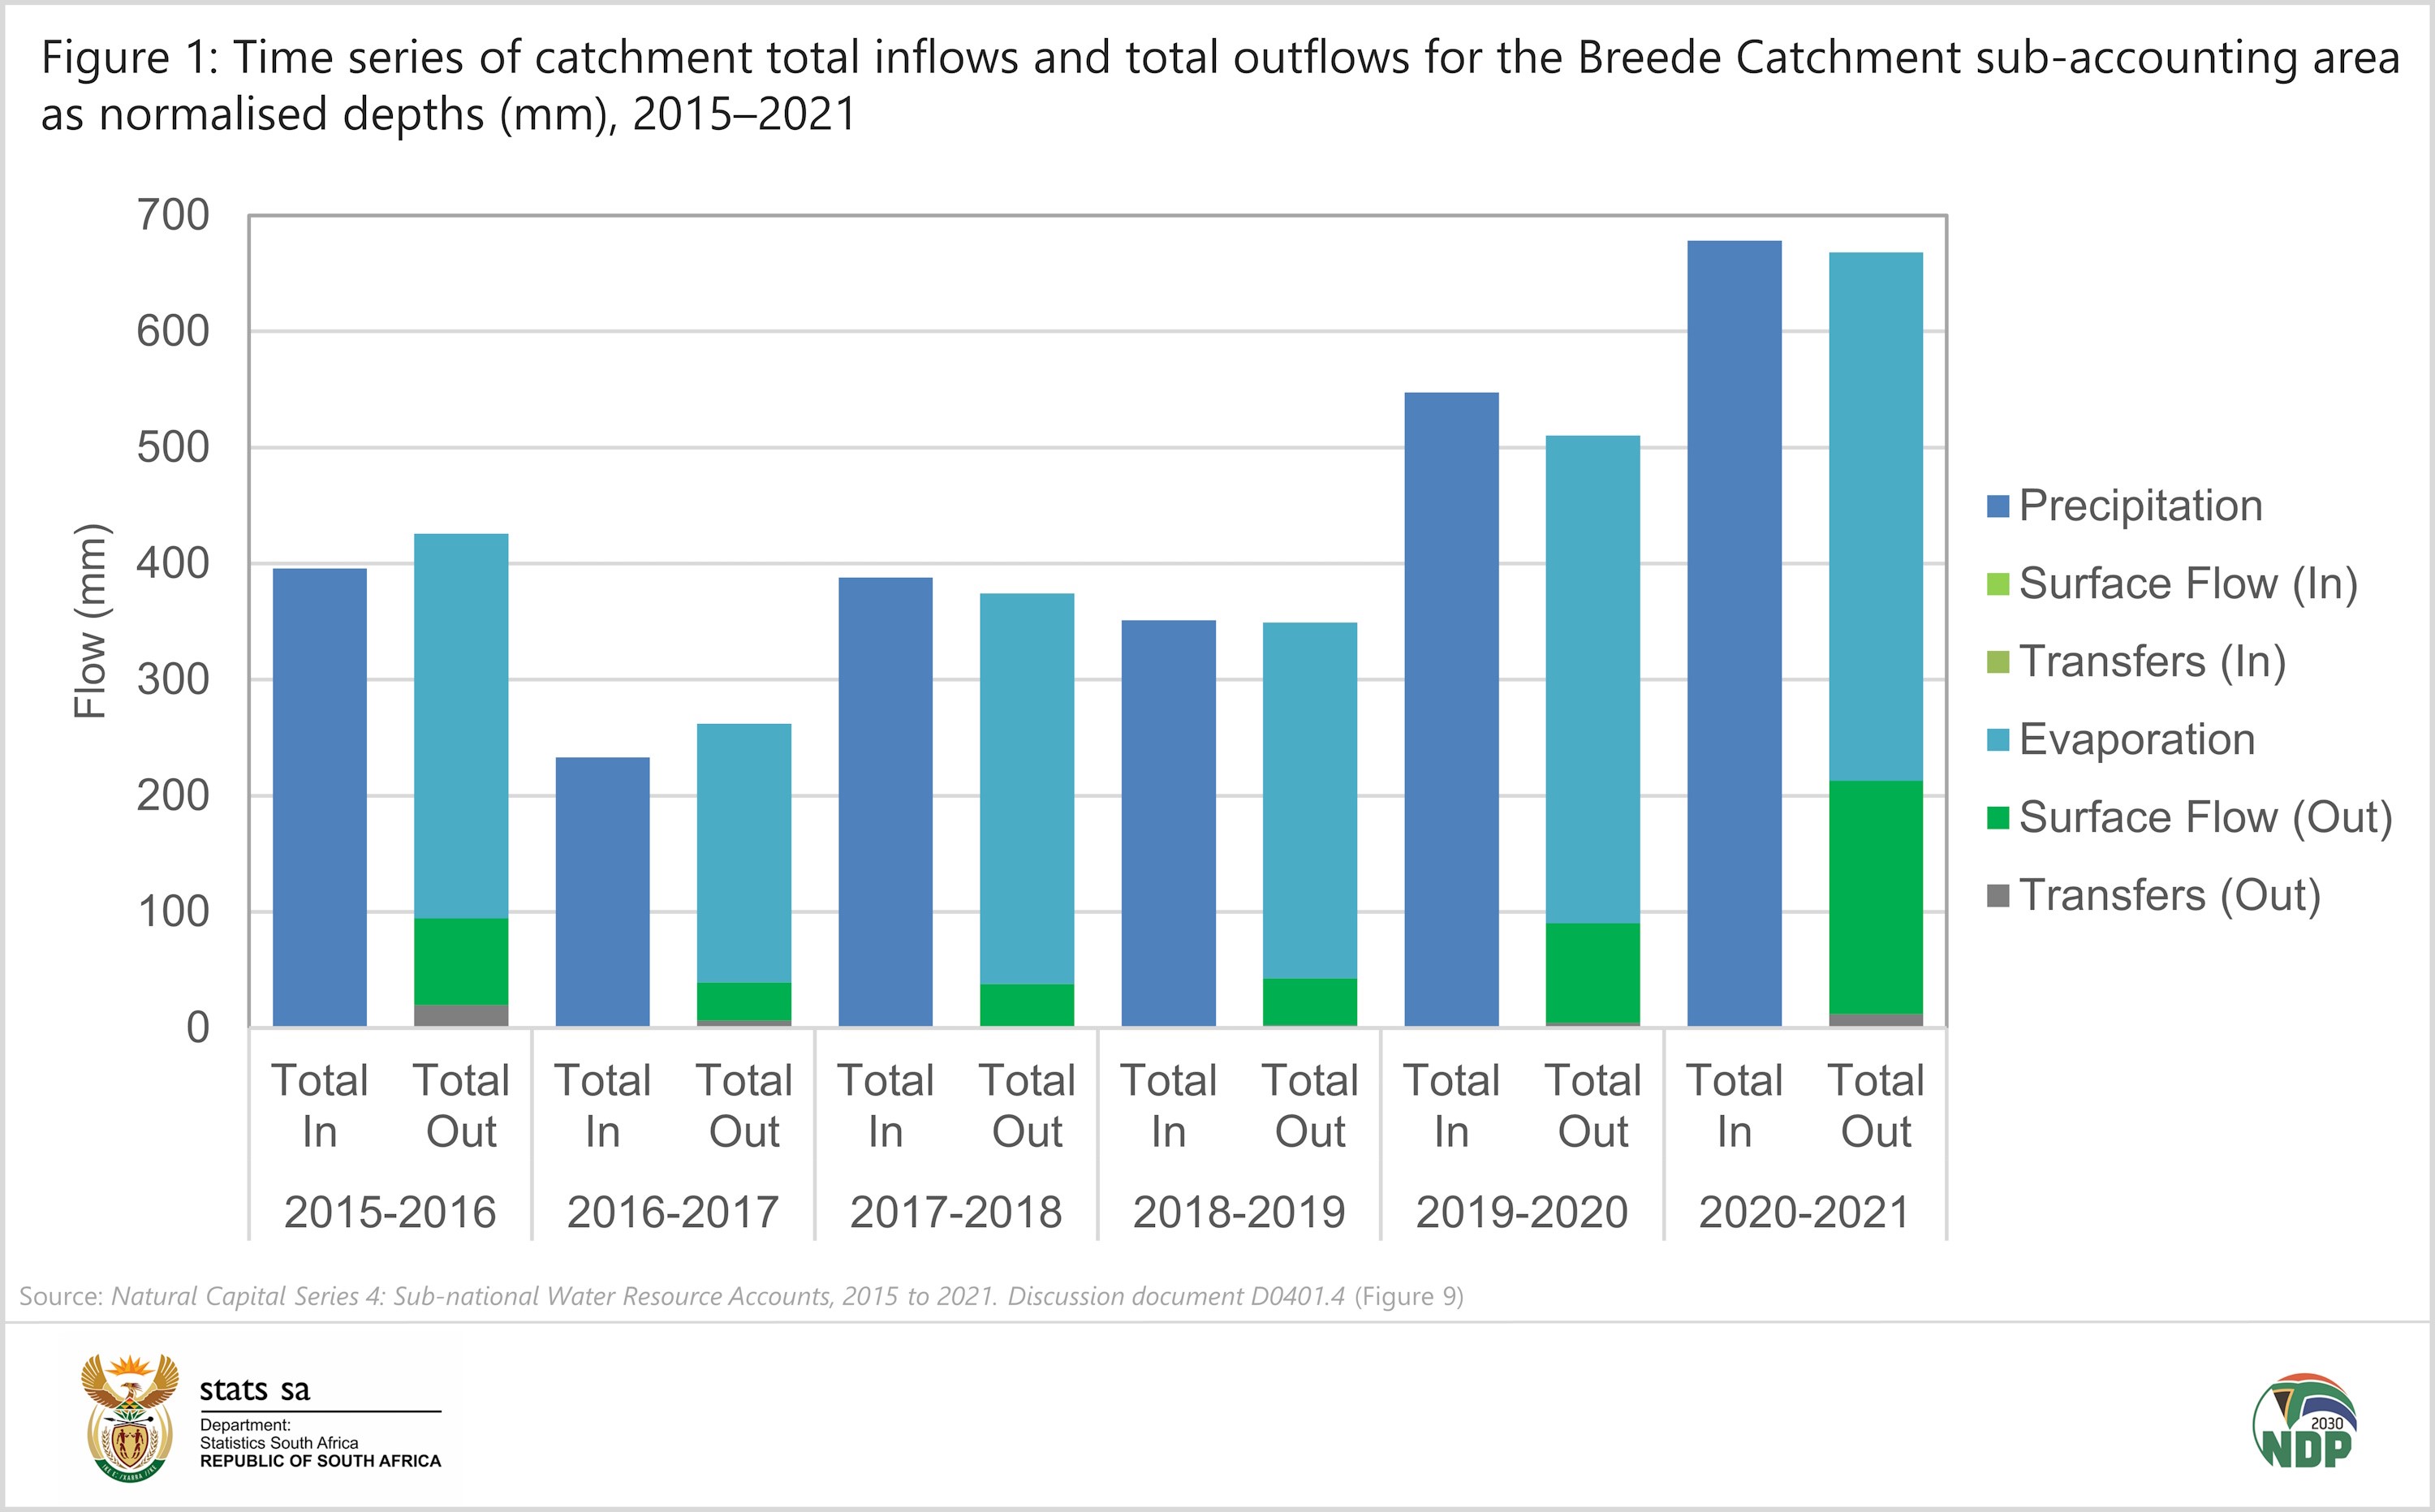
The overall water balance in the Breede Catchment was low in 2016–2017 and relatively high in 2020–2021. Rain (or precipitation) was the dominant water source, with the lowest quantity of precipitation occurring in 2016–2017 — a time of severe drought. Precipitation was the highest in 2020–2021. Evaporation was the biggest outflow and was the greatest in 2020–2021.
Surface flows and transfers are movements of water from and to surrounding catchments. Surface flows occur naturally in river networks, while transfers are engineered flows of water occurring in canals, tunnels, and pipelines to and from neighbouring catchments.
In the Breede Catchment, surface outflows were the lowest in 2016–2017, 2017–2018 and 2018–2019. Transfers out were the highest in 2015–2016, possibly a result of increased water demands from Cape Town during the drought.
Notice how total inflows (total in) and total outflows (total out) are unequal in any given year. The difference between the two indicates a change in the quantity of water stored within the catchment. Water is often retained in soil as groundwater, or in waterbodies. If outflows exceed inflows, the store of water decreases. If inflows are greater than outflows, the store is increased. In the Breede Catchment, there was a decline in stored water in 2015–2016 and 2016–2017. This was replenished from 2017–2018 as precipitation increased.
What do the data tell us about natural variability?
Not only do water resource accounts provide an indication of water flows over time, but they can also be used to compile a range of indicators. The evaporation ratio, for example, represents the portion of precipitation that is lost to evaporation. A higher ratio indicates a situation where evaporation has removed a greater share of water from precipitation. Essentially, evaporated water is no longer available for use.
Water resource accounts and indicators are available for the 56 quaternary catchments that make up the Breede Catchment.1 The quaternary catchments with lower-than-average evaporation ratios are in the northern parts of the catchment, and those with higher evaporation ratios are located centrally (Figure 2).
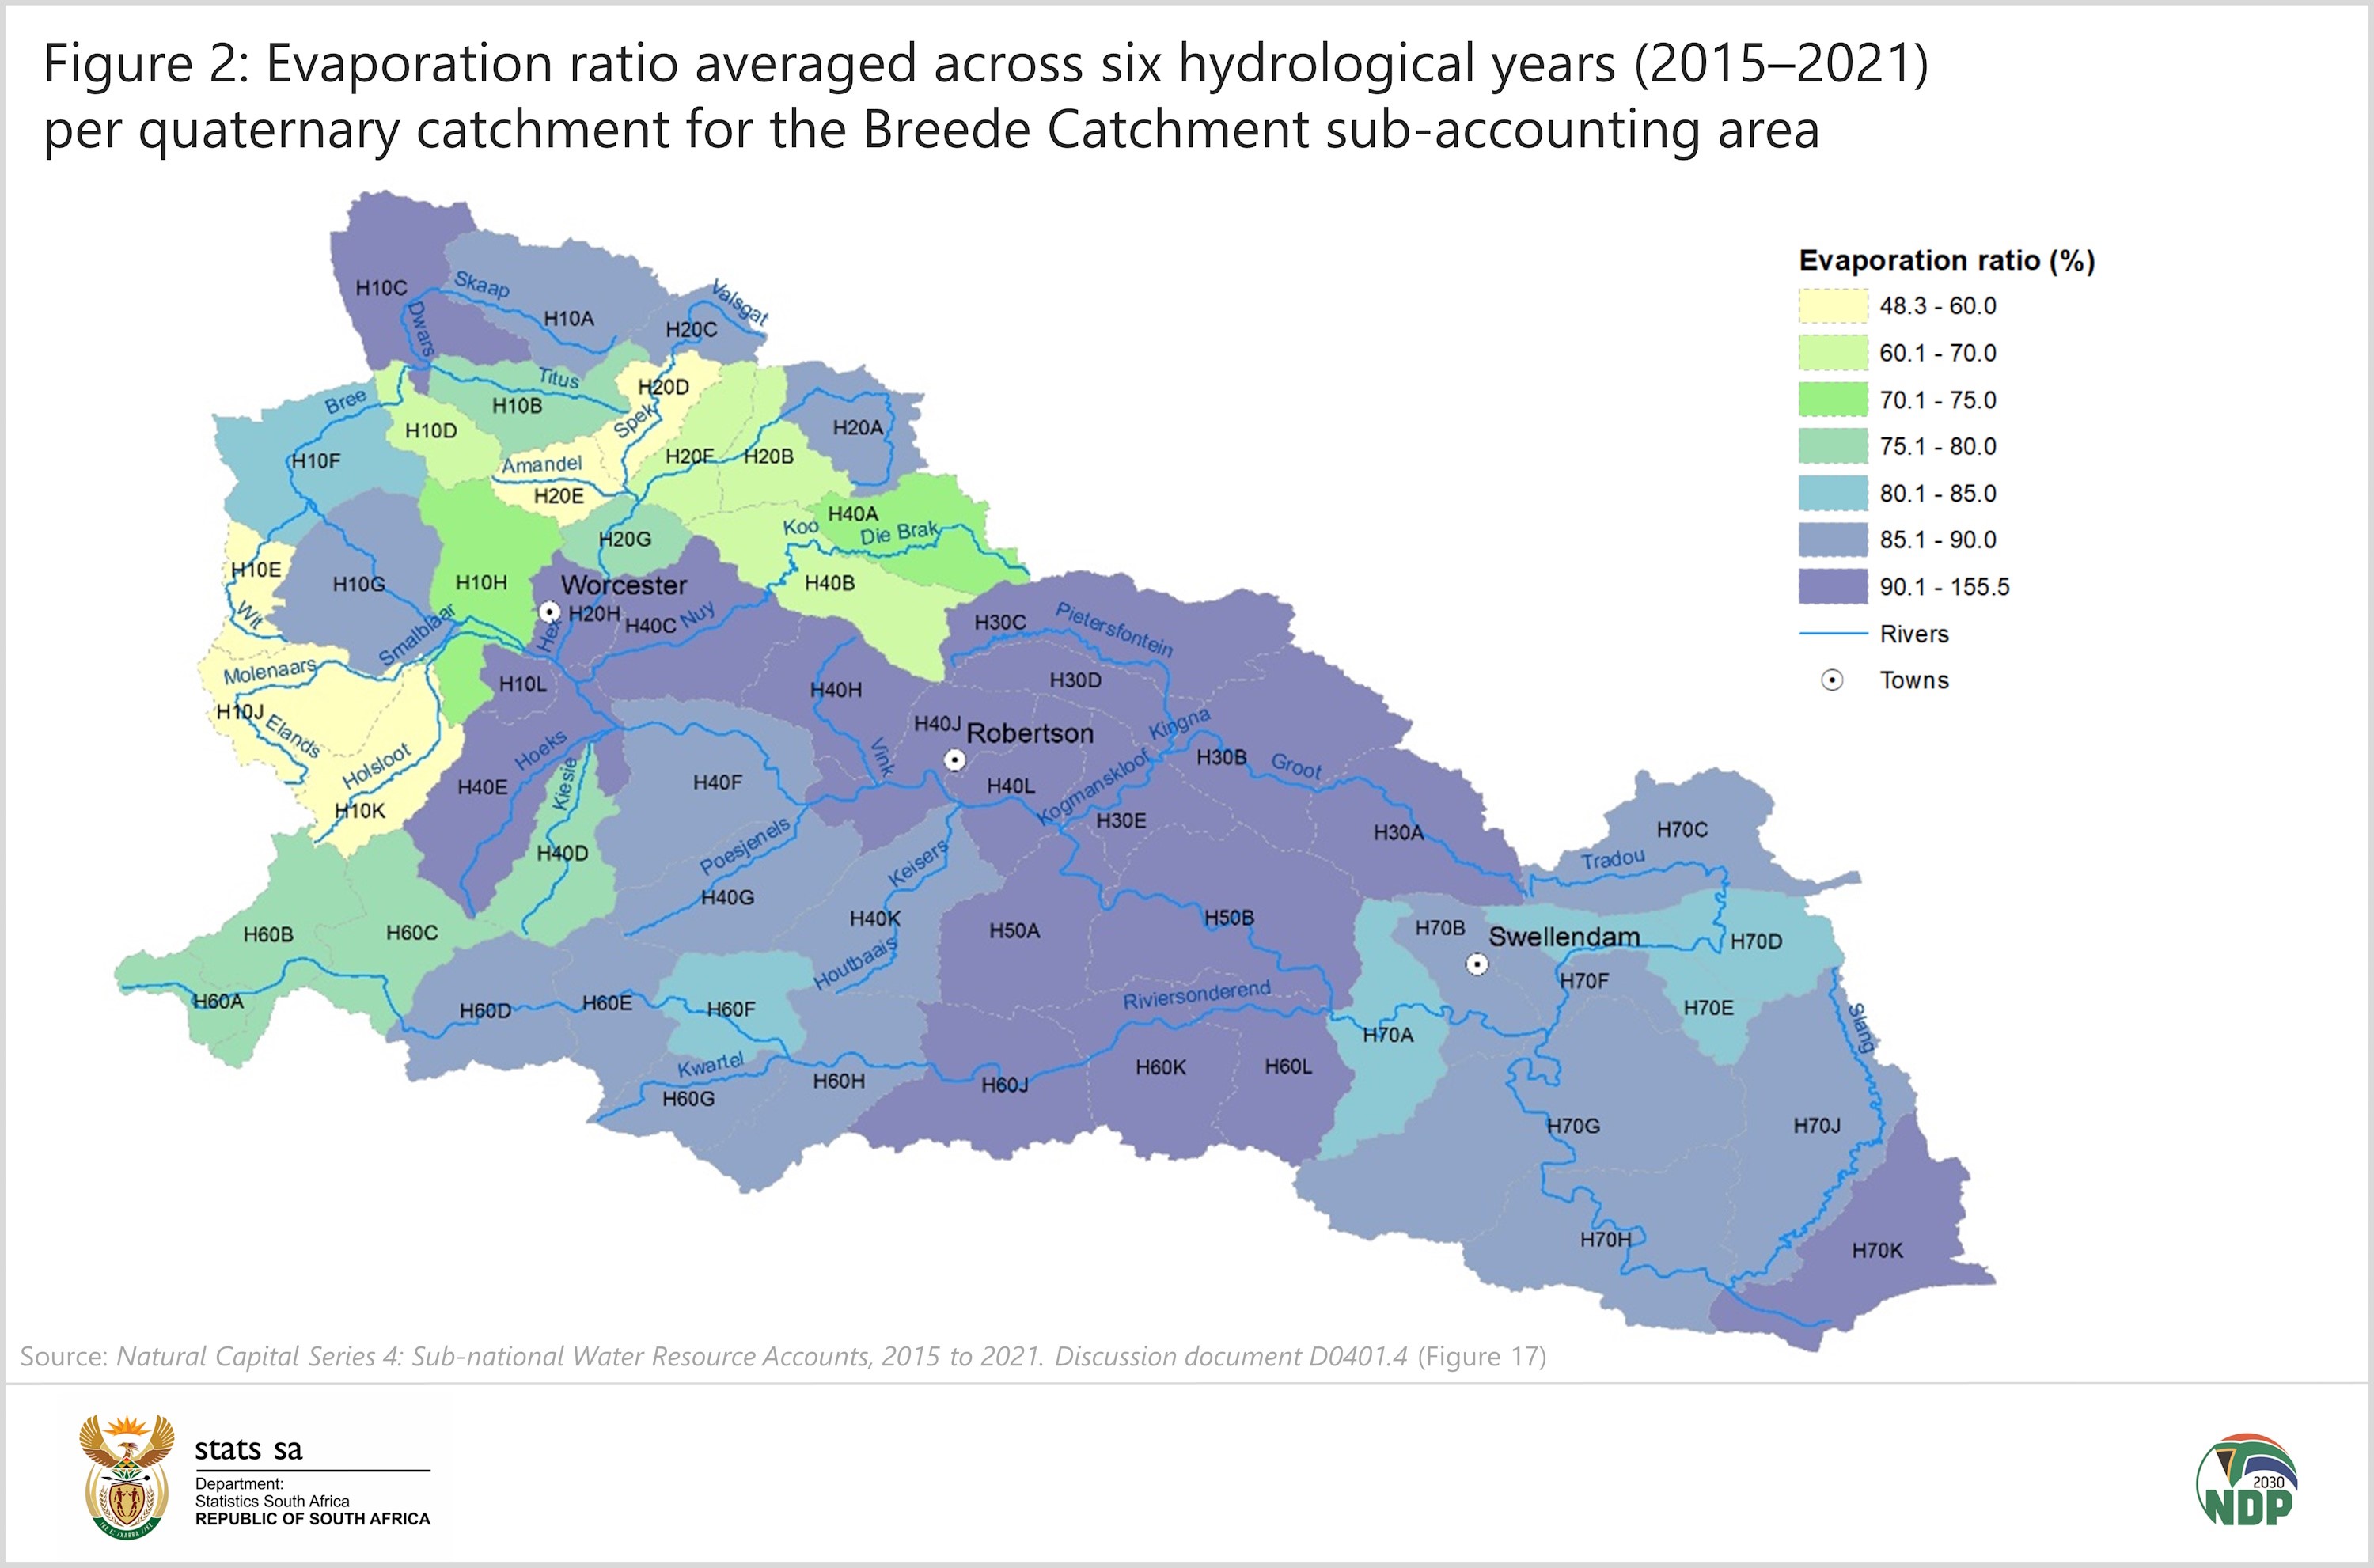
The quaternary catchments H10L and H20H (in the Worcester area) and H40L (outside Robertson) recorded the highest evaporation ratios. Various interventions can be implemented to help reduce losses in areas with high ratios, such as various cultivation practices.
What are the water resources available for use?
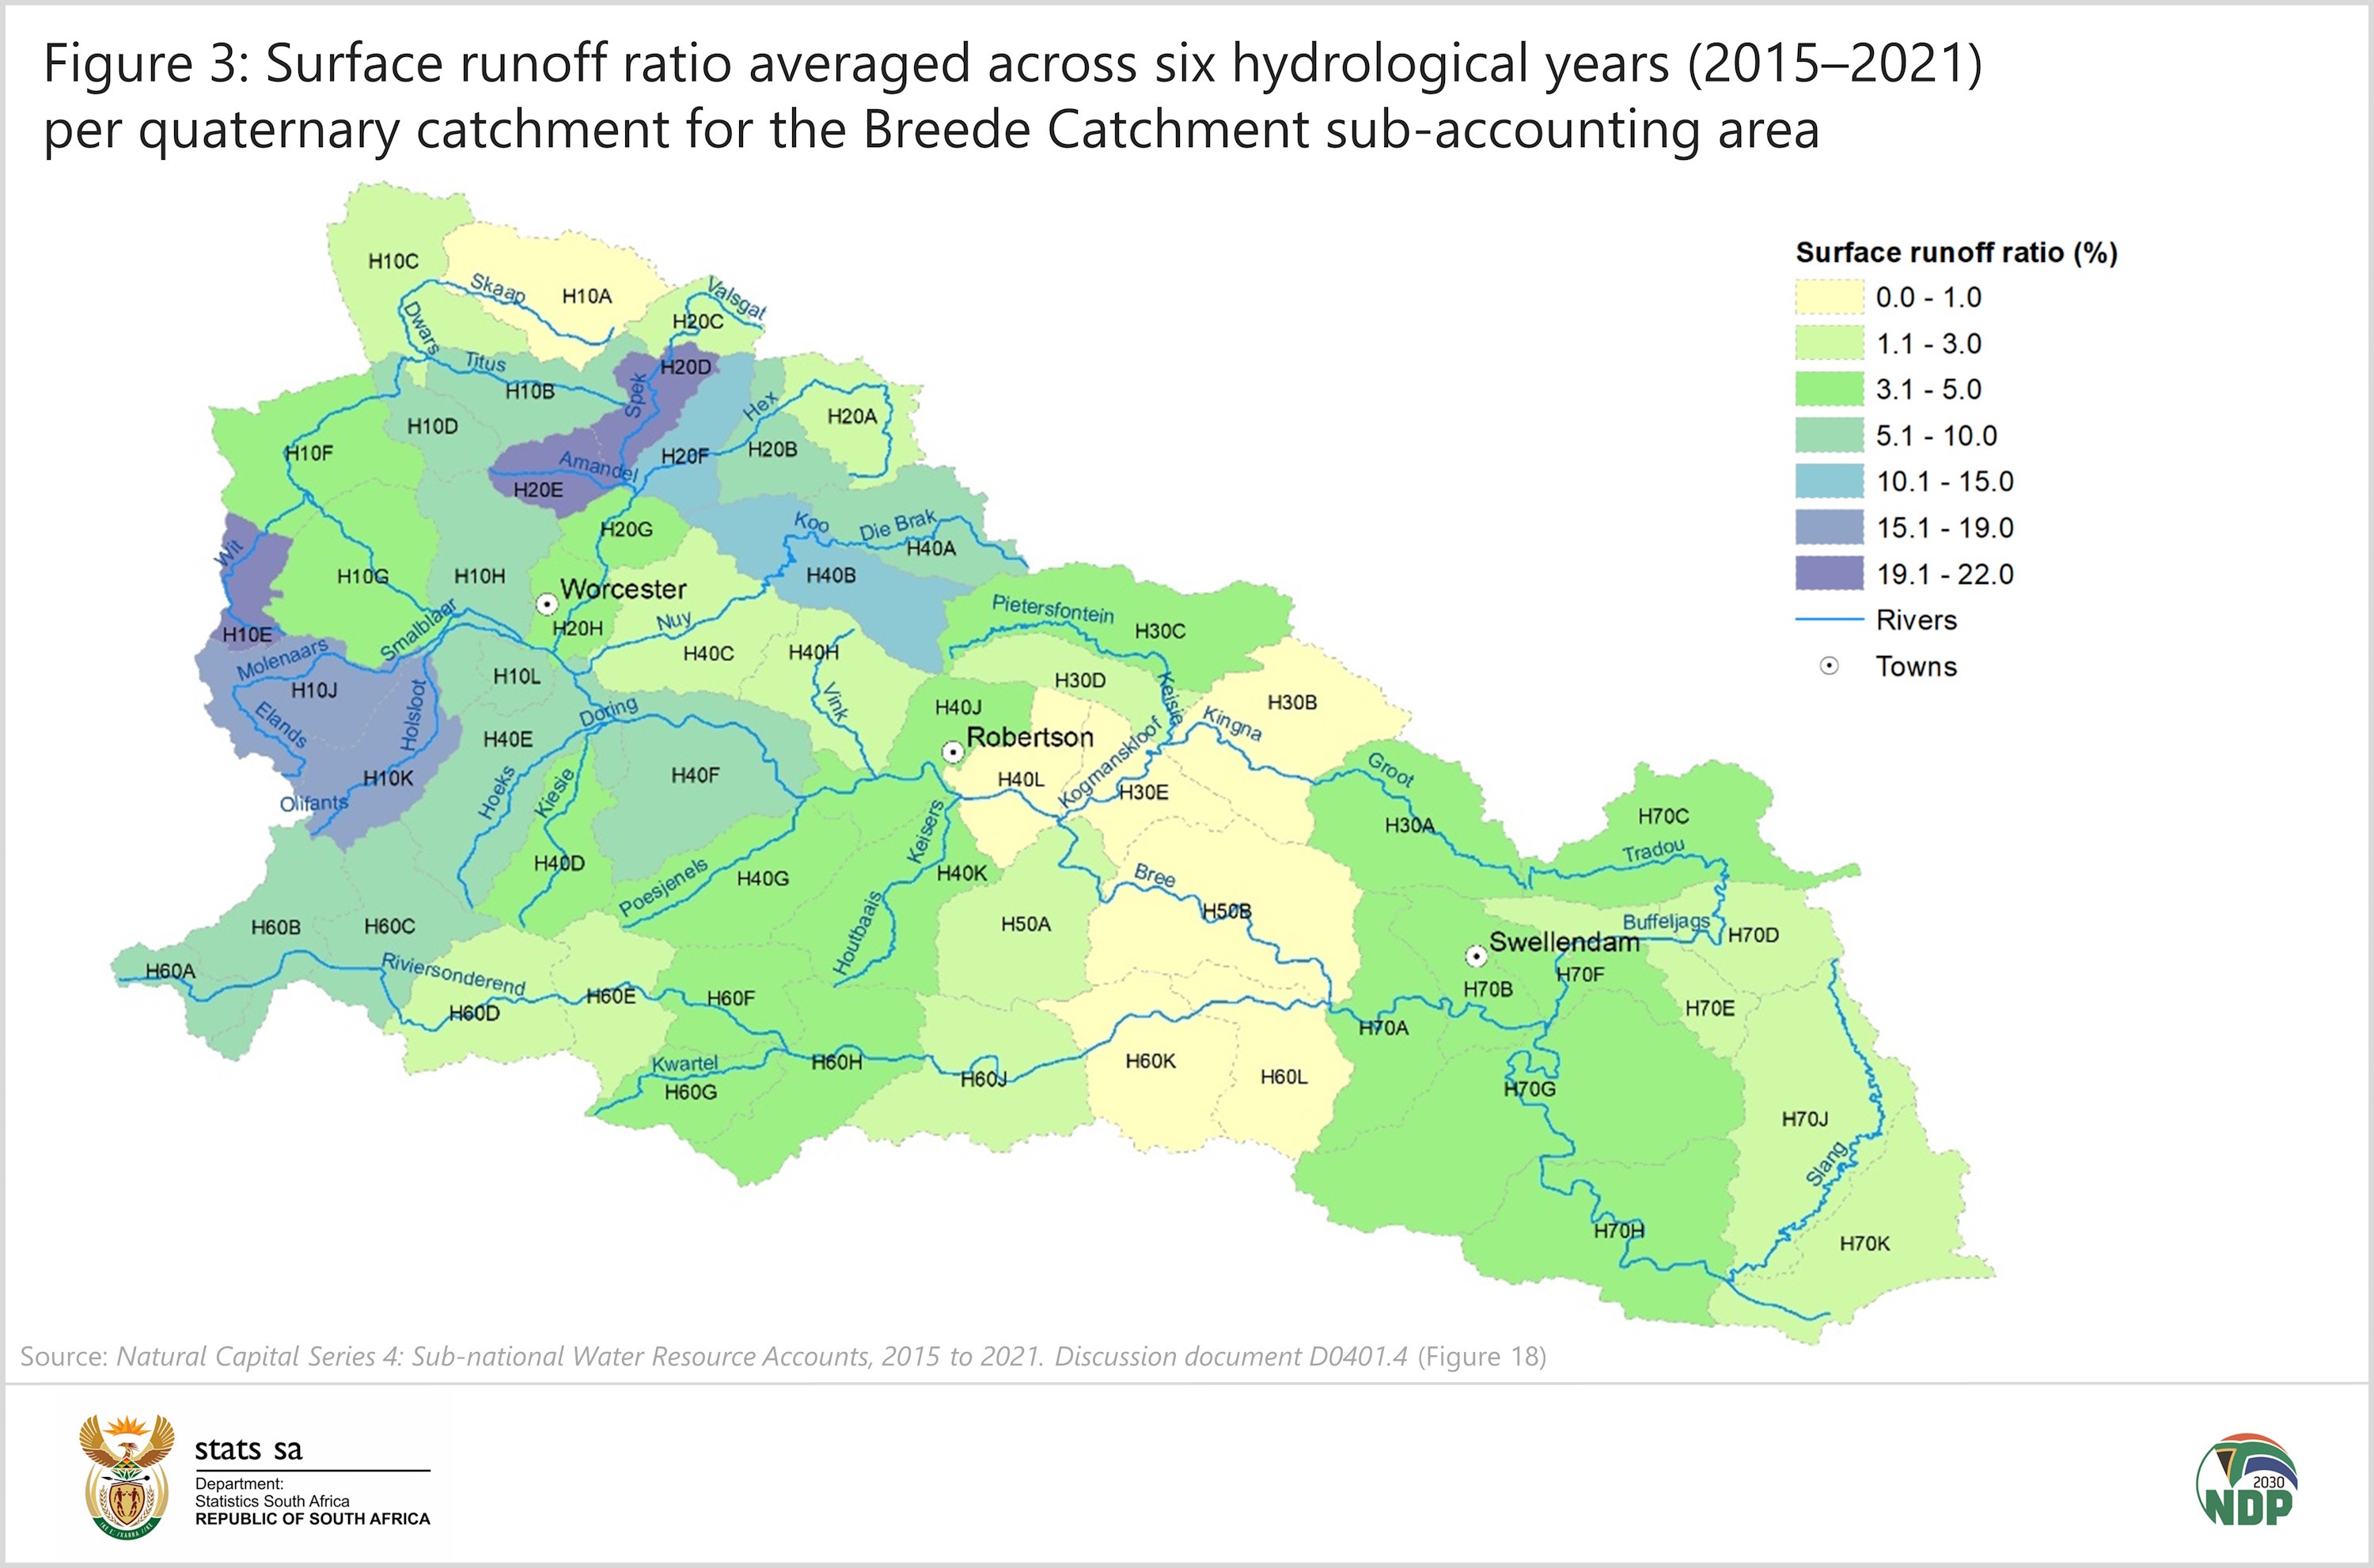
The surface runoff ratio indicates the share of precipitation in the catchment that is not lost but instead flows into rivers and dams as surface water. Those catchments with high ratios contribute to water availability. However, a high ratio may indicate risk of flooding (Figure 3).
Surface water is one of several water resources that are available for use. Total water resources include internal resources (surface water, baseflow and groundwater recharge) and external resources from other catchments. Figure 4 shows total water resources per person based on population data from Census 2011.
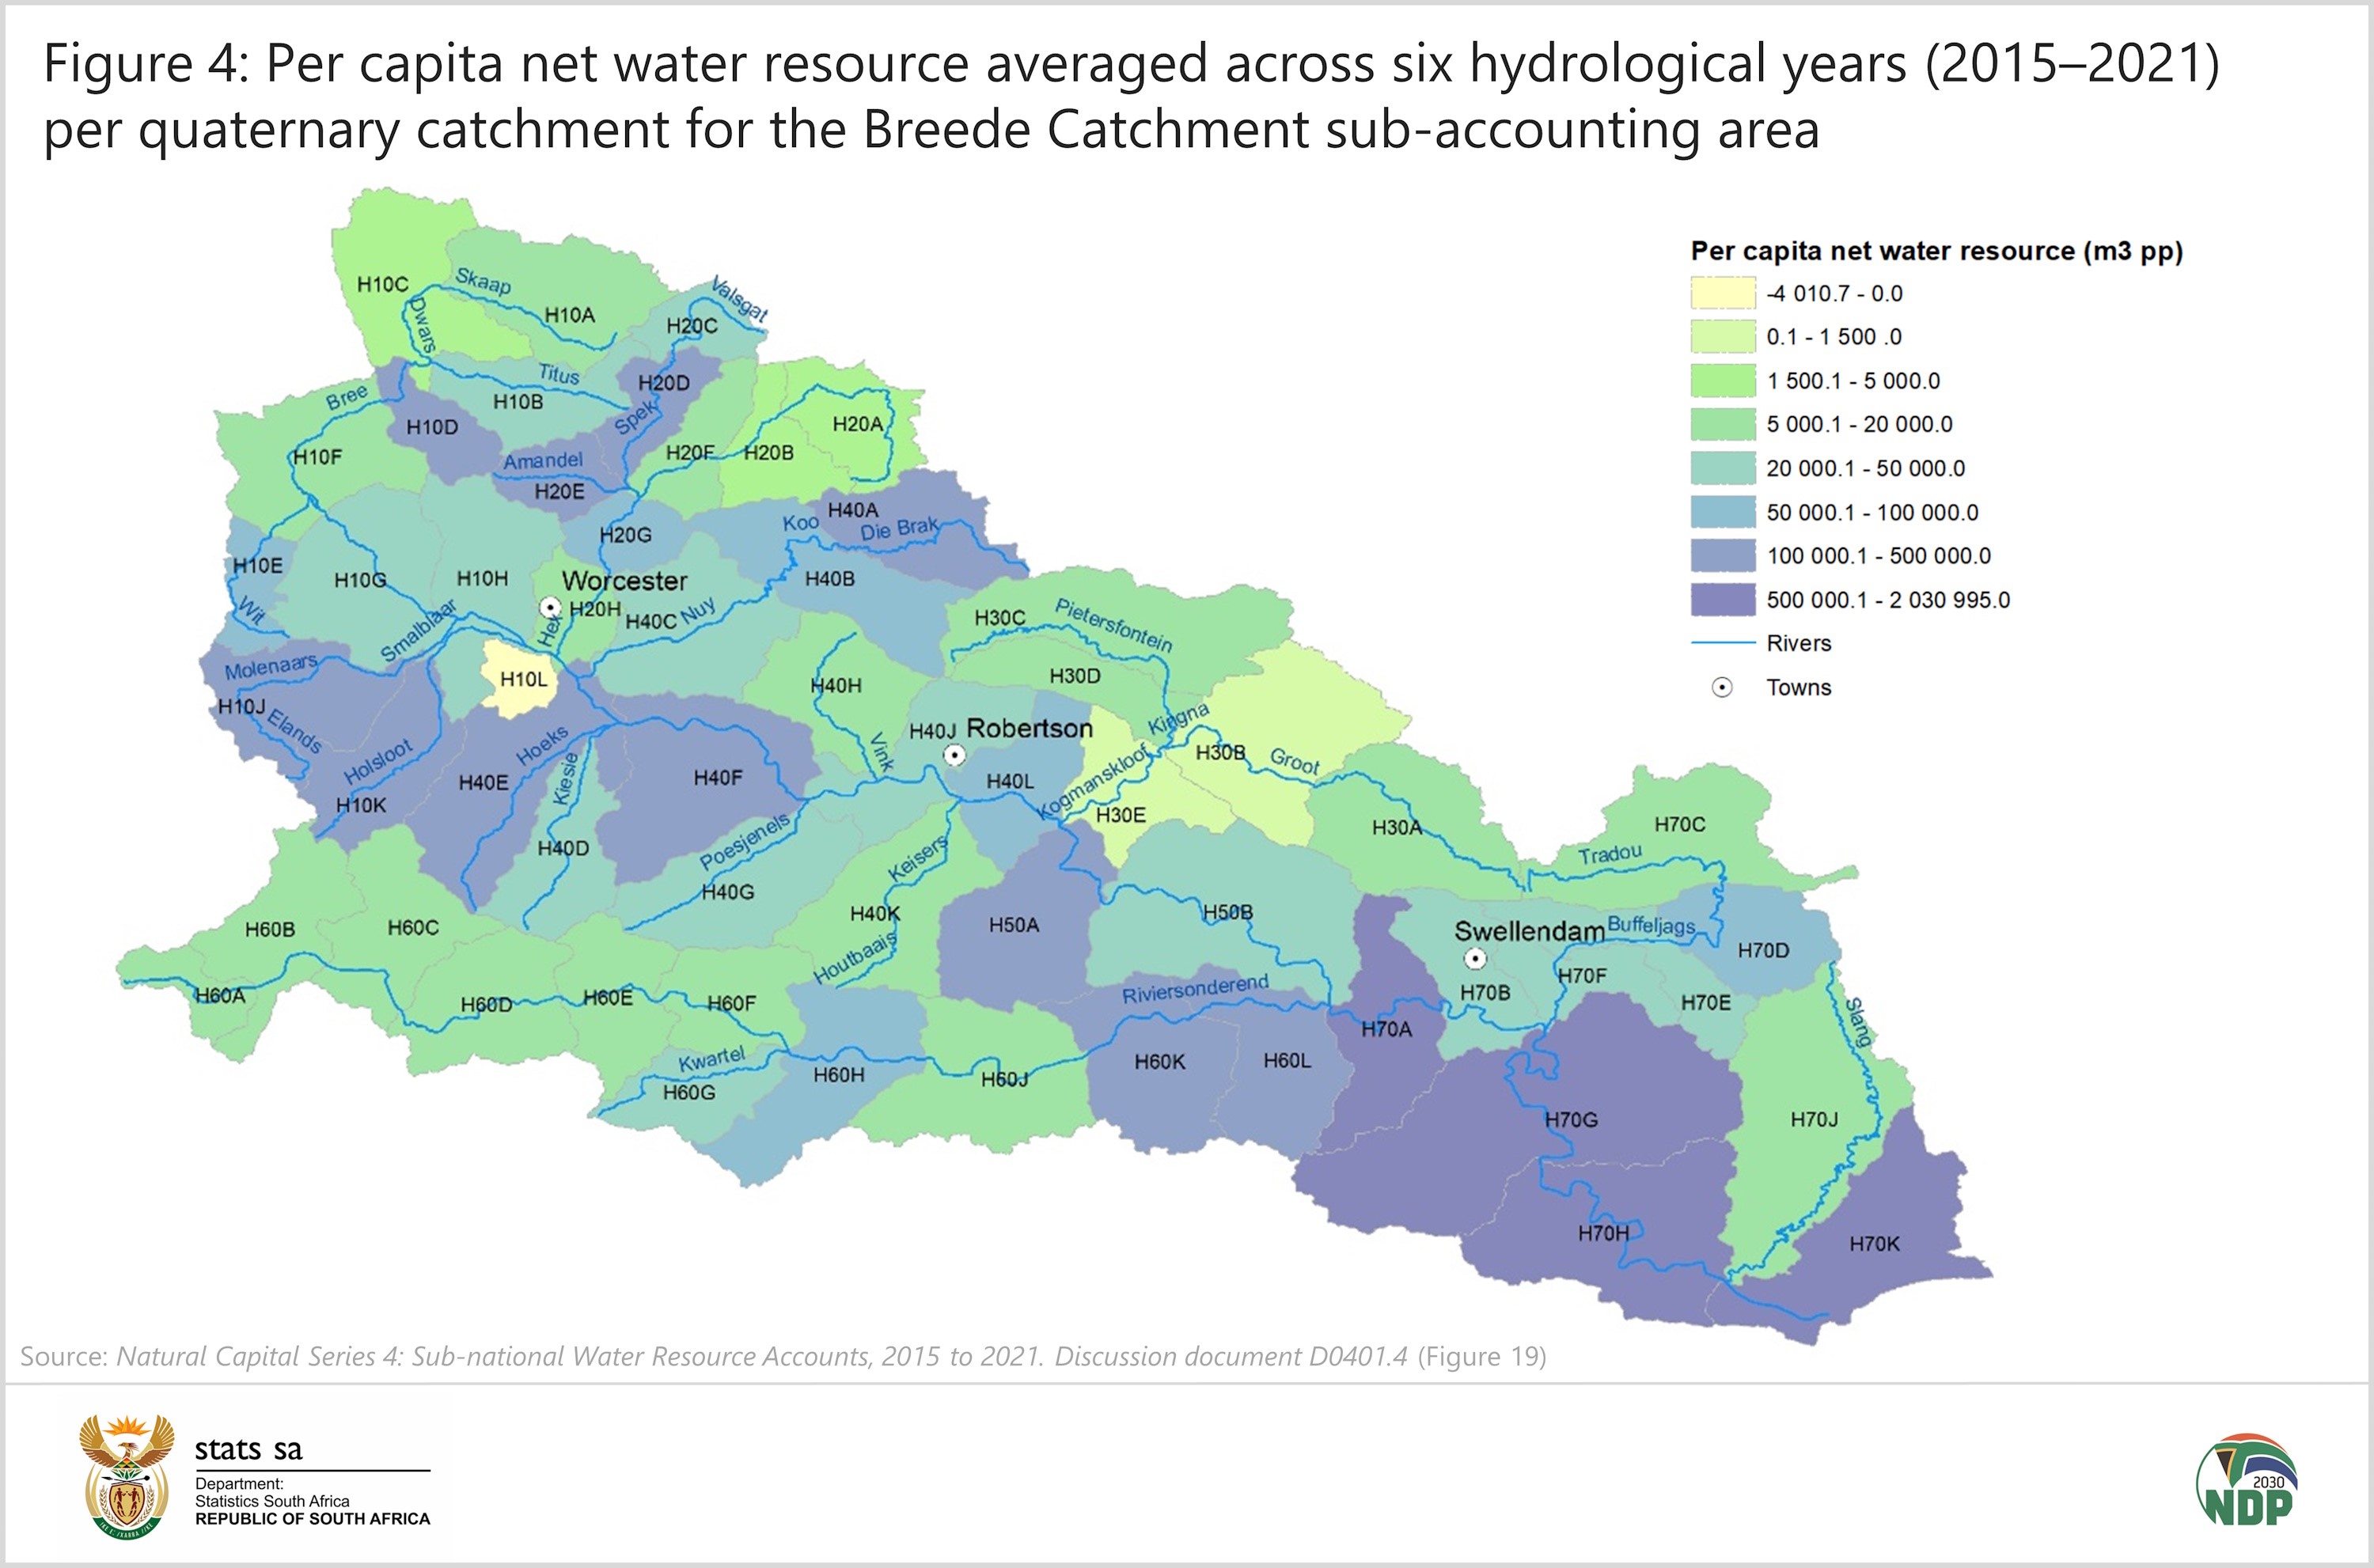
Quaternary catchments with the highest values are located in the south-eastern parts of the Breede Catchment. These areas have relatively low populations and experience accumulated flows from quaternary catchments upstream.
What do the data tell us about managed water use?
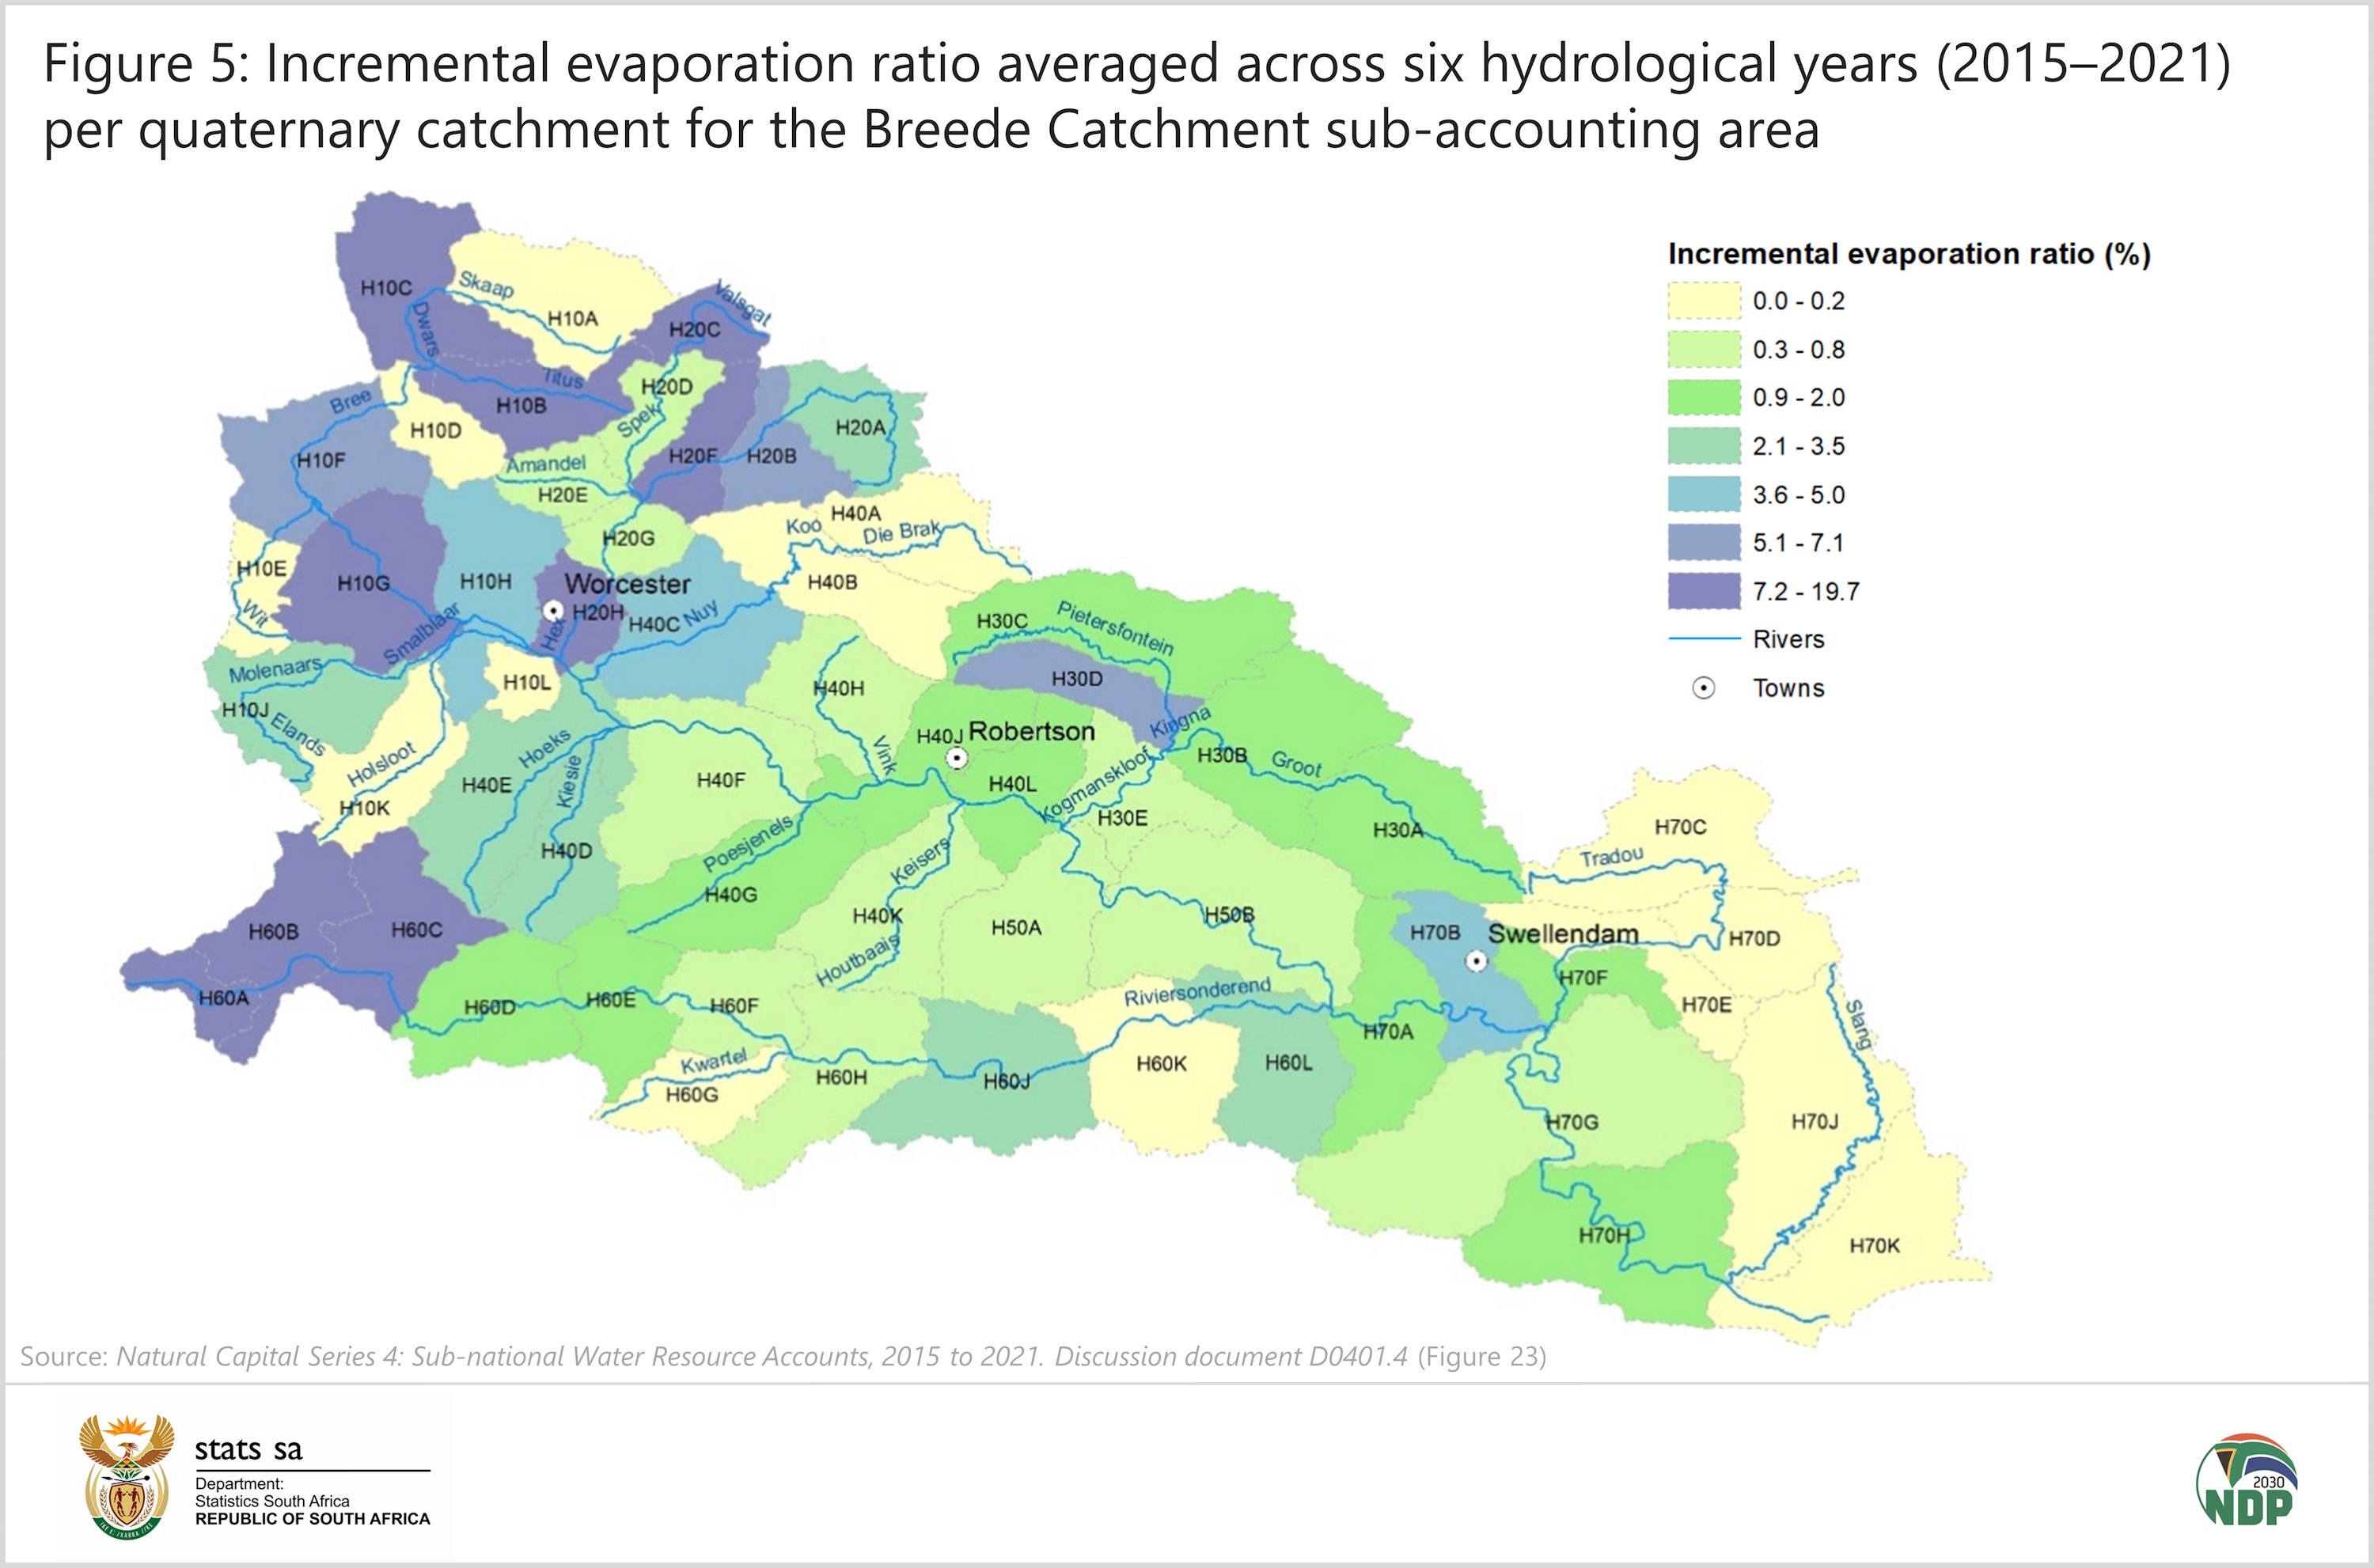
Incremental evaporation, as a proportion of total evaporation, indicates the extent of water evaporation that is transferred from rivers, groundwater and dams for use in cultivation, mining and urban activities. This abstracted water, some of which evaporates, is lost from further use. The quaternary catchment with the highest ratio was H20H (Worcester), with the highest proportion of built-up land cover in the Breede Catchment (Figure 5)
.
Want to find out more?
Download the Sub-national Water Resource Accounts, 2015 to 2021 discussion document, and associated Excel files, here.
This is the fourth discussion document published as part of the project “Unlocking Biodiversity Benefits through Development Finance in Critical Catchments” (also known as the Ecological Infrastructure for Water Security [EI4WS] project), which is funded by the Global Environment Facility (GEF), implemented by the Development Bank of Southern Africa (DBSA), supported by the Department of Forestry, Fisheries and the Environment (DFFE), and executed by SANBI in partnership with the Department of Water and Sanitation (DWS) and the Water Research Commission (WRC) along with other organisations. The Centre for Water Resources Research (CWRR) at the University of KwaZulu-Natal (UKZN) was the technical lead, undertaking the modelling and compiling of these accounts. More information on Natural Capital Accounting in South Africa is available here.
The other three discussion documents available in the Stats SA Natural Capital Accounting (NCA) series include:
- Land and Terrestrial Ecosystem Accounts, 1990 to 2014 (download here).
- Accounts for Protected Areas, 1900 to 2020 (download here).
- Accounts for Strategic Water Source Areas, 1990 to 2020 (download here).
1 South Africa consists of 22 primary catchments, defined by the Department of Water and Sanitation, forming the first level of a 4-level nested system of hydrological catchments: primary (22); secondary (148); tertiary (278); and quaternary (1 946).
Similar articles are available on the Stats SA website and can be accessed here.
For a monthly overview of economic indicators and infographics, catch the latest edition of the Stats Biz newsletter here.