
Consumer inflation inches higher in January
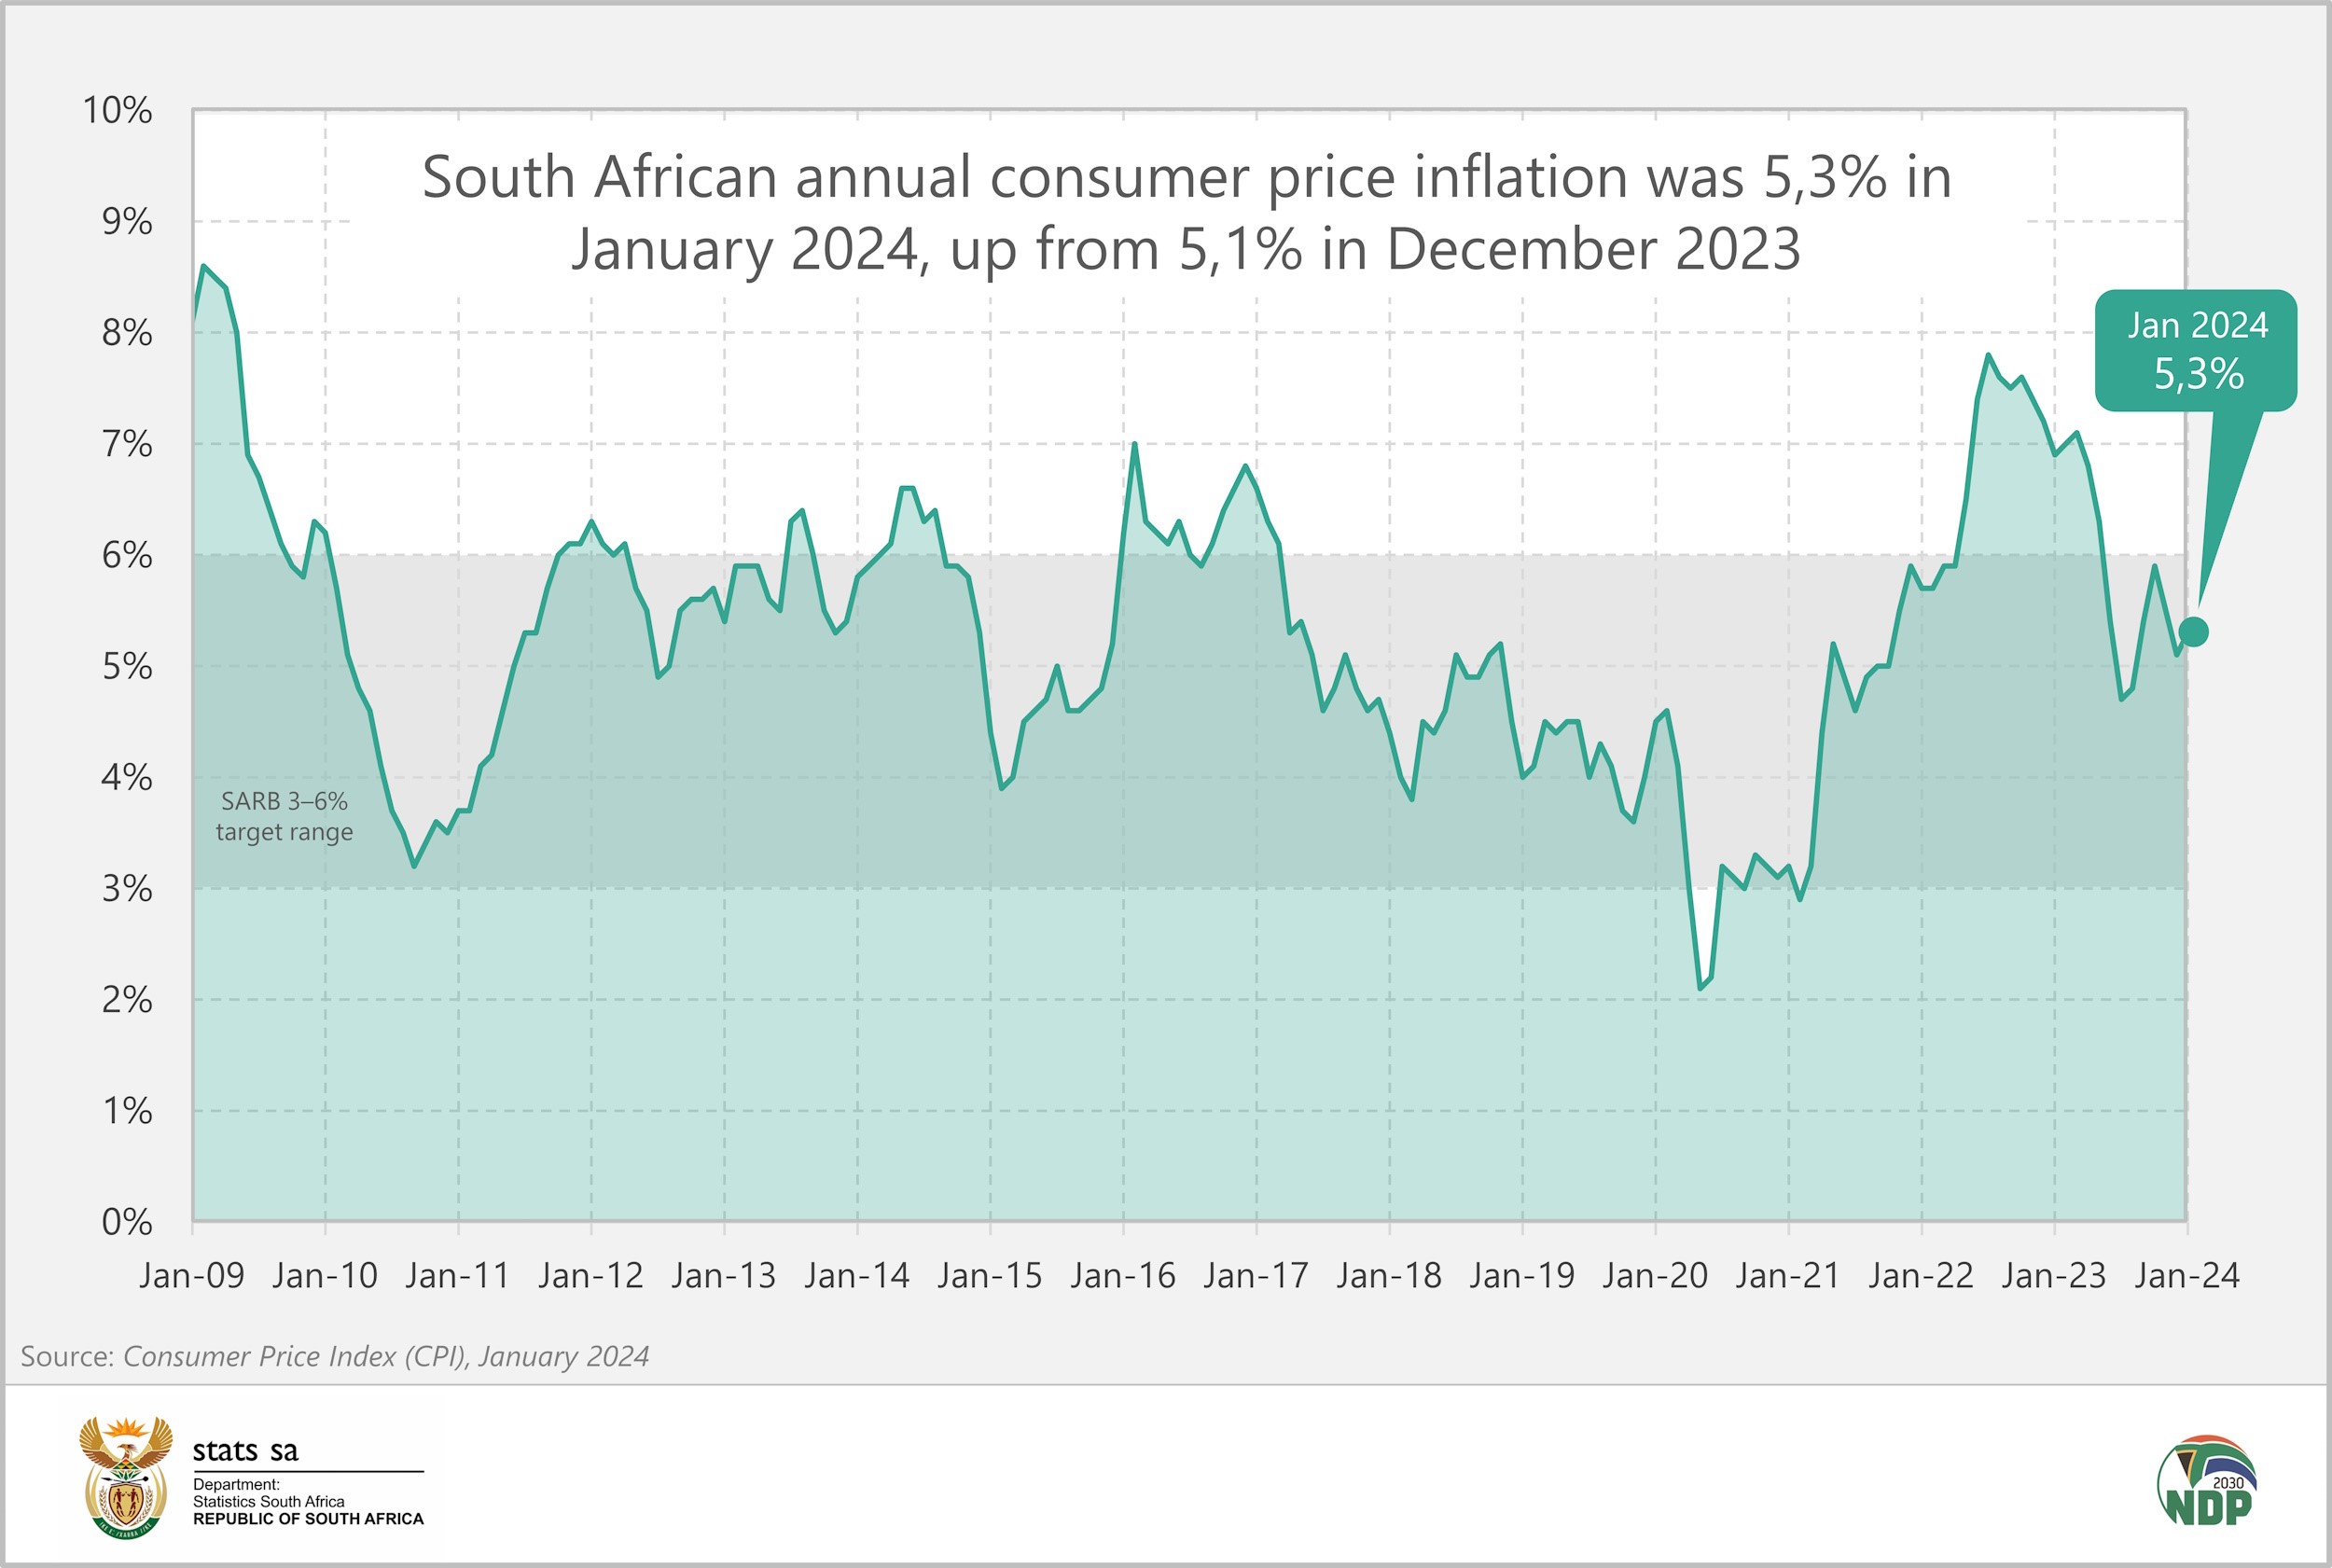
After two consecutive months of decline, annual consumer inflation crept up in January, rising to 5,3% from 5,1% in December. The monthly change in the consumer price index (CPI) was 0,1% in January.
The categories in the CPI basket with the largest annual price increases were restaurants & hotels at 8,0%, food & non-alcoholic beverages (NAB) at 7,2%, and health at 6,5%.
Fuel prices lower in the month, but still higher than a year ago
A monthly decline of 5,2% in fuel prices between December and January was not enough to subdue the annual rate for fuel, which jumped from -2,5% in December to 3,3% in January. This contributed to a sharp rise in annual transport inflation to 4,6% from 2,6% in December.
Inflation for several transport categories cooled in January. With the festive season over, public transport tariffs decreased by 2,0% in January compared with December, dragged lower by monthly price decreases for long-distance busses (down 21,2%), car rental (down 12,1%) and air fares (down 4,1%).
Wining and dining more expensive
Prices for the restaurants and hotels group increased by 8,0% in the 12 months to January, up from December’s print of 7,0%. Restaurant-related product groups that recorded relatively high annual increases in January included fish & seafood products (up 9,9%), red meat-based products (up 9,7%) and hamburgers (up 8,6%).
After rising during the festive season, hotel room rates decreased by 2,1% between December and January. Despite this decline, hotel rooms remain more expensive than a year ago, with prices increasing by 10,7% in the last 12 months.
Food inflation cools for a second consecutive month
Annual inflation for food and NAB slowed to 7,2% in January from 8,5% in December and 9,0% in November. All sub-categories recorded lower annual rates, apart from sugar, sweets & desserts, oils & fats, and cold beverages.
The annual rate for sugar, sweets & desserts increased from 17,9% in December to 18,5% in January. Sugar prices drove much of the upward momentum, with the annual rate for white sugar accelerating from 20,1% in December to 21,2% in January. Prices at the factory gate were also elevated. The December producer price index (PPI) reported sugar inflation at 23,5%, with raw cane sugar increasing by 36,7% and refined sugar by 18,8% in the last 12 months.1
Annual inflation for bread & cereal products declined from 7,5% in December to 6,5% in January. Meat inflation was also softer, cooling from 3,9% to 2,2%.
Other notable price changes in January
Annual inflation for miscellaneous goods and services ticked up to 5,4% in January from 5,1% in December. Prices for personal care items increased by an annual rate of 9,5%, lower than the 10,3% rise recorded in December. An increase in bank fees contributed to a 5,5% annual rise in financial services.
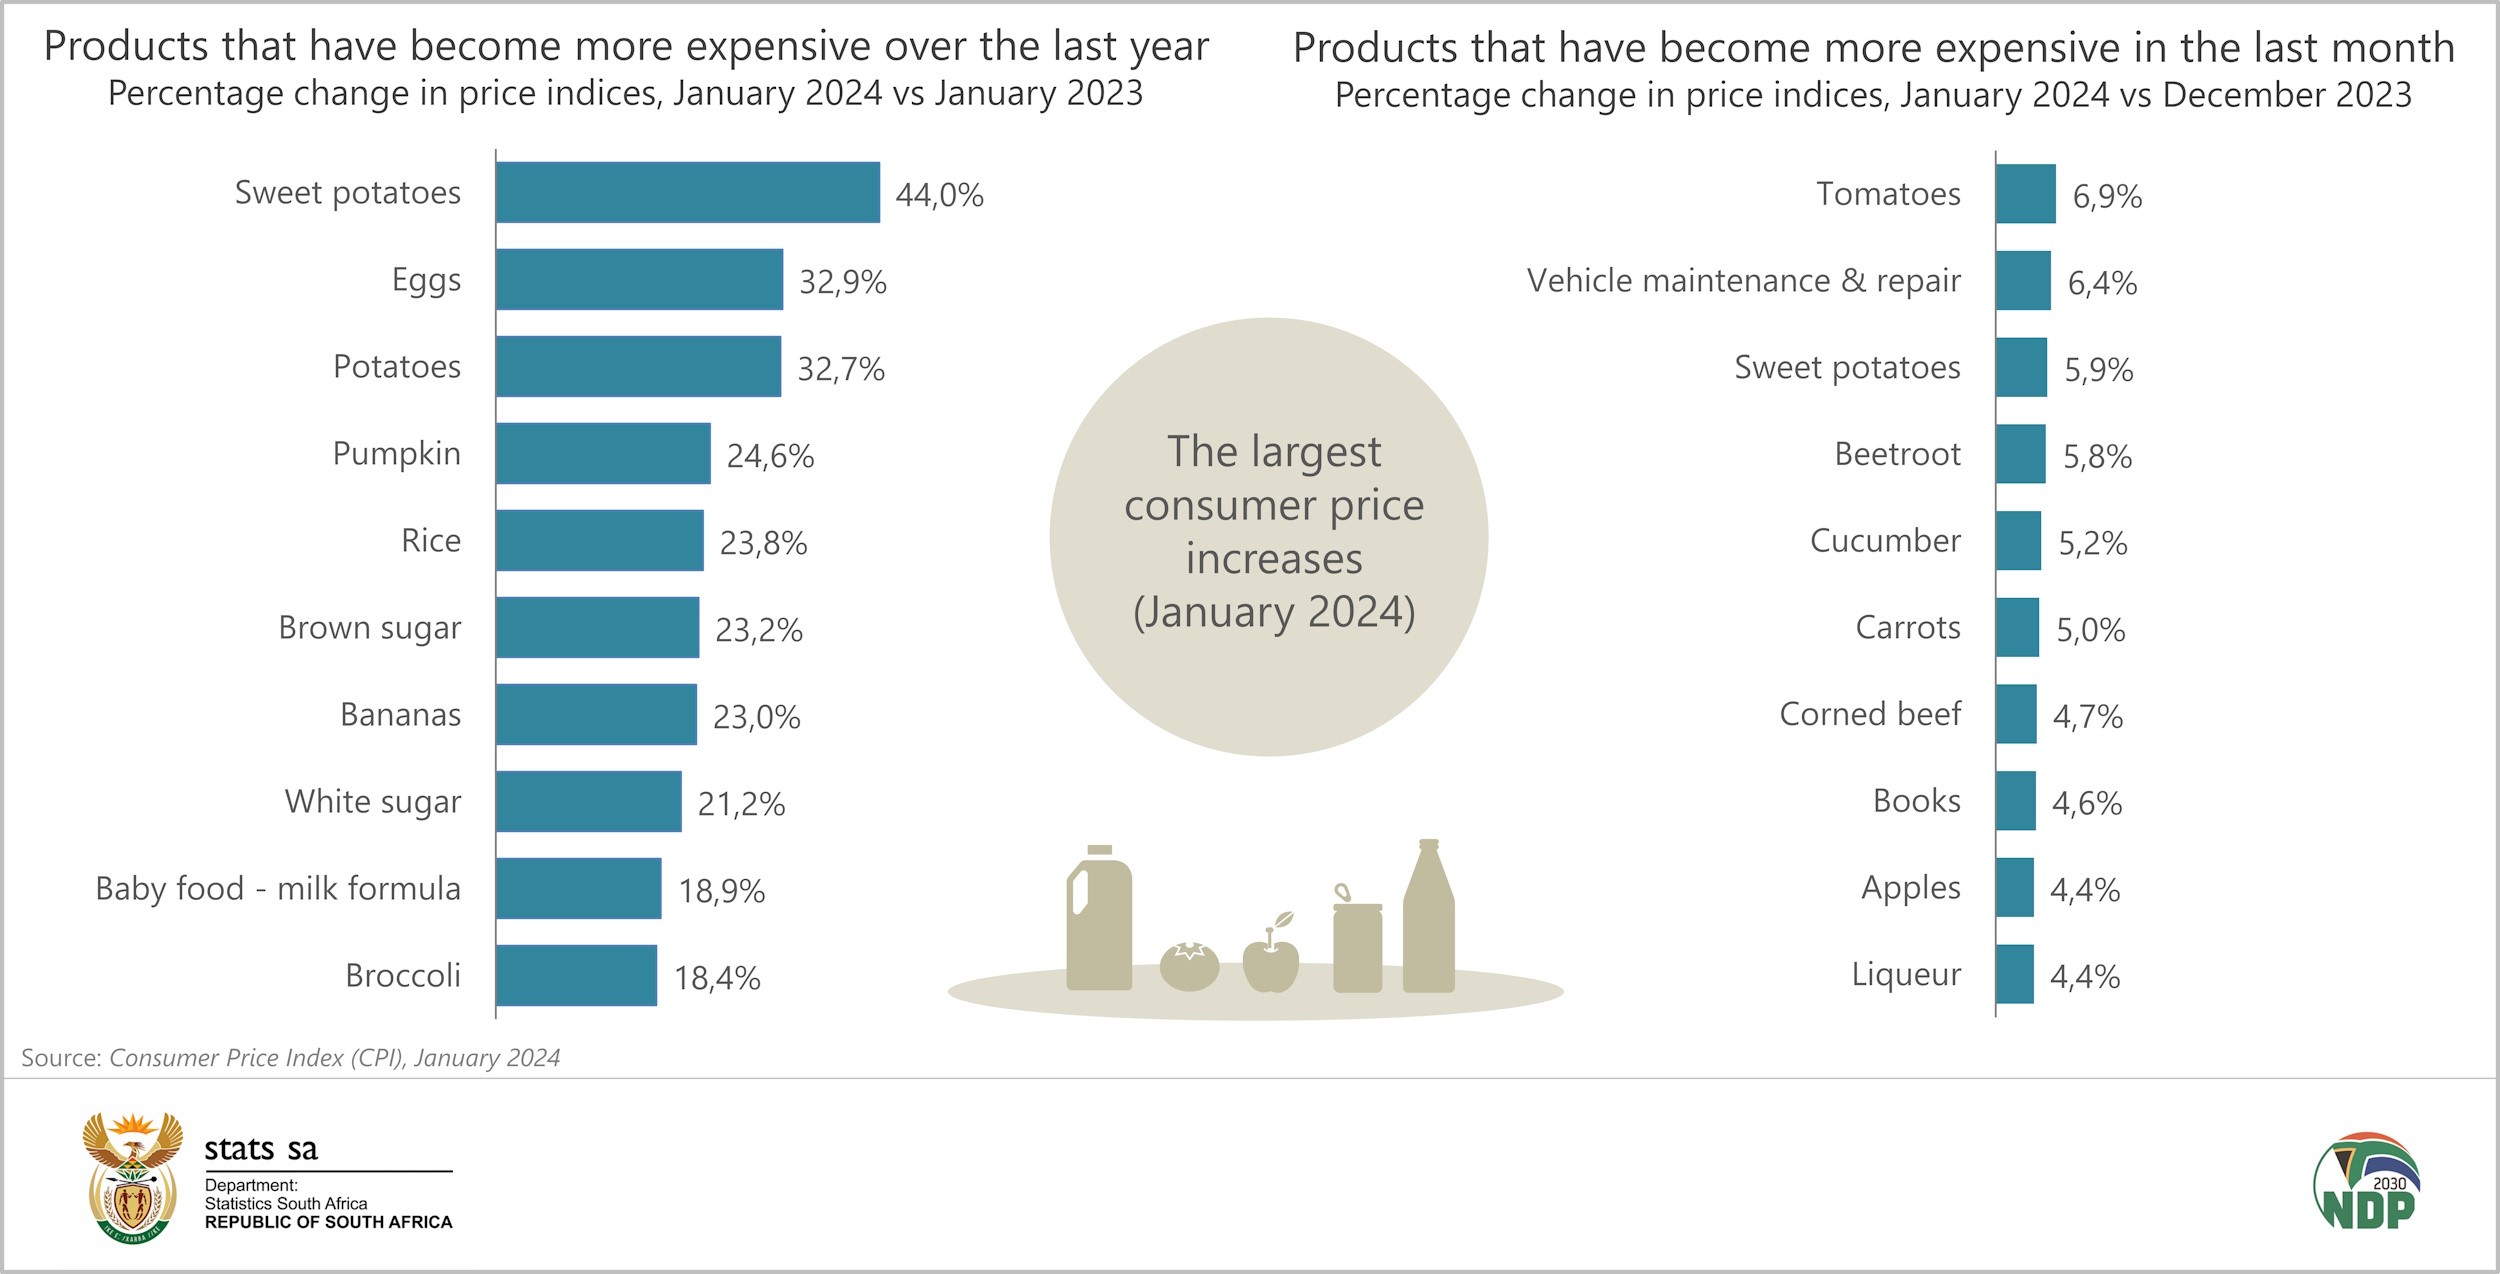
The graphs below show the products that recorded the most significant annual and monthly price increases in January.
Download the January 2024 CPI statistical release and Excel files with indices and average prices here. The archive is available here.
1 Stats SA, Producer Price Index (PPI), December 2023 (download here).
Similar articles are available on the Stats SA website and can be accessed here.
For a monthly overview of economic indicators and infographics, catch the latest edition of the Stats Biz newsletter here.