
Metal ores push up mining turnover
The mining industry’s contribution to total turnover in the South African formal business sector has increased over the years. A comprehensive time series, available from the Annual Financial Statistics (AFS) statistical release, provides a breakdown of how the turnover pie has shifted over the years.
The survey reference period for the latest AFS (i.e. AFS 2022) covers the financial years of enterprises1 ending on any date between 1 July 2021 and 30 June 2022.
In AFS 2005, the trade industry accounted for 37,2% of total formal business turnover (Figure 1). This remained largely unchanged with a 38,6% contribution in AFS 2022.
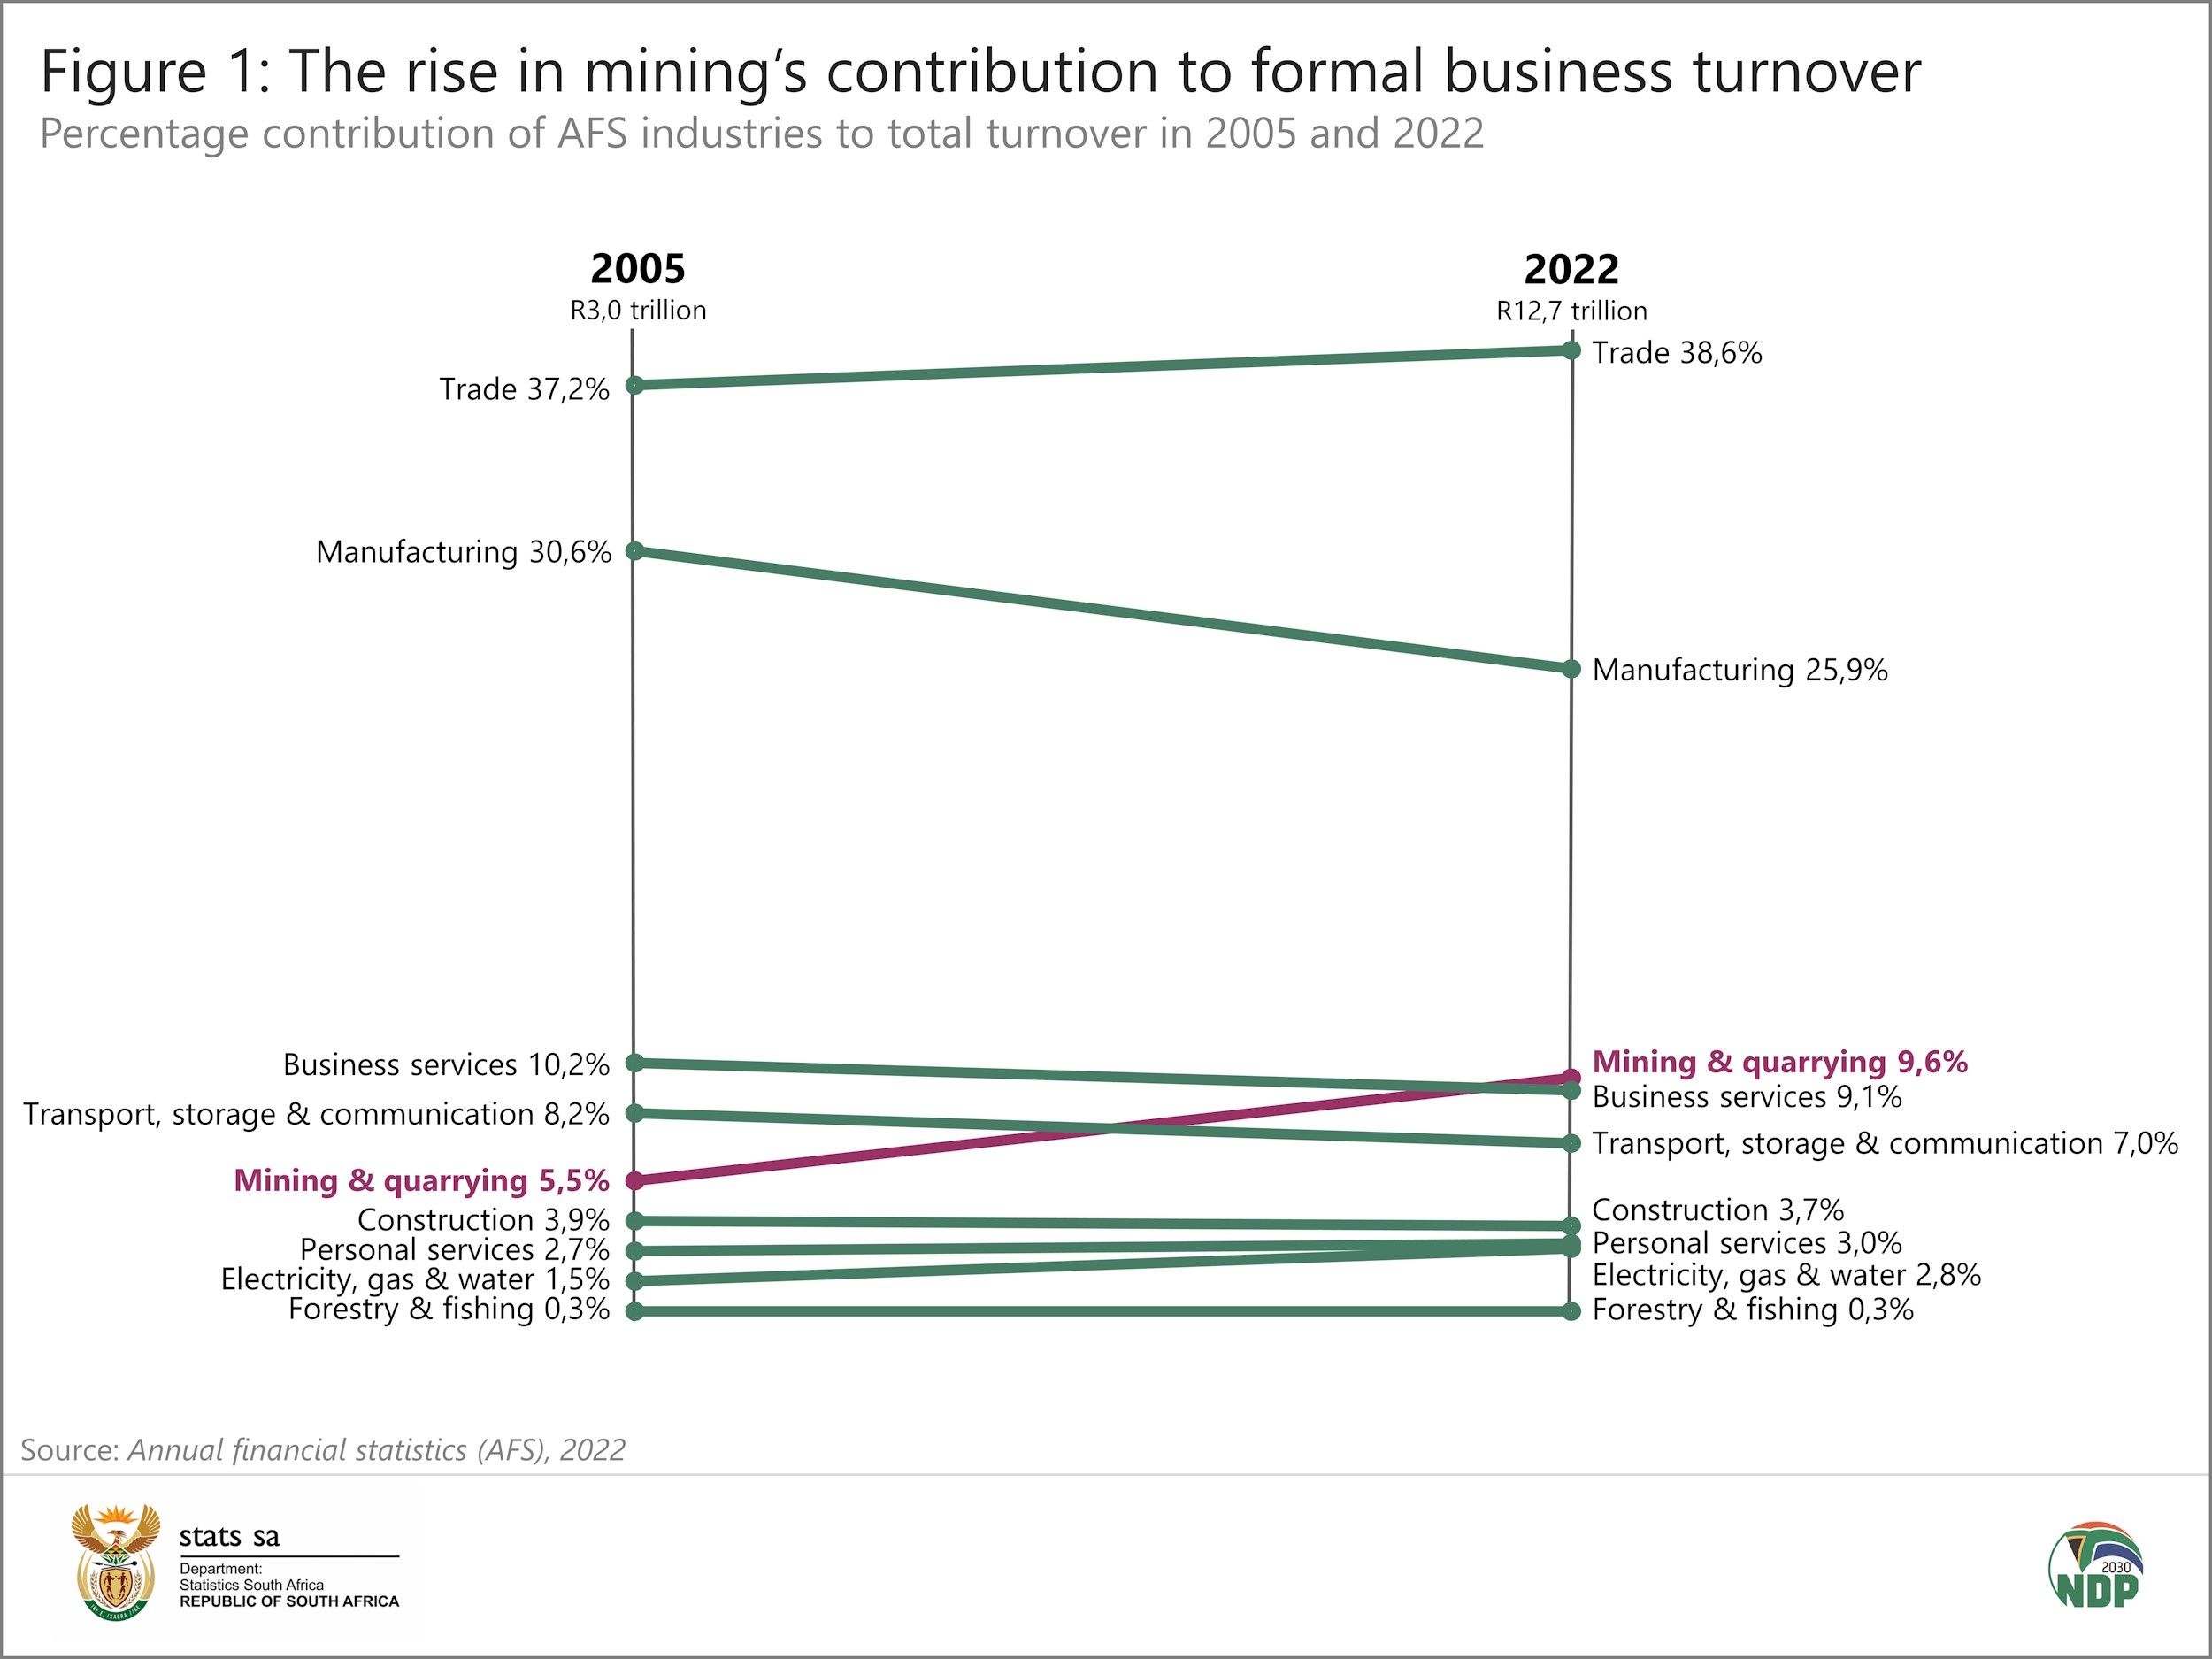
Two key aspects stand out in Figure 1. First, the importance of the manufacturing industry to formal business turnover has weakened over the years. Despite this decline, manufacturing remains the second largest player.
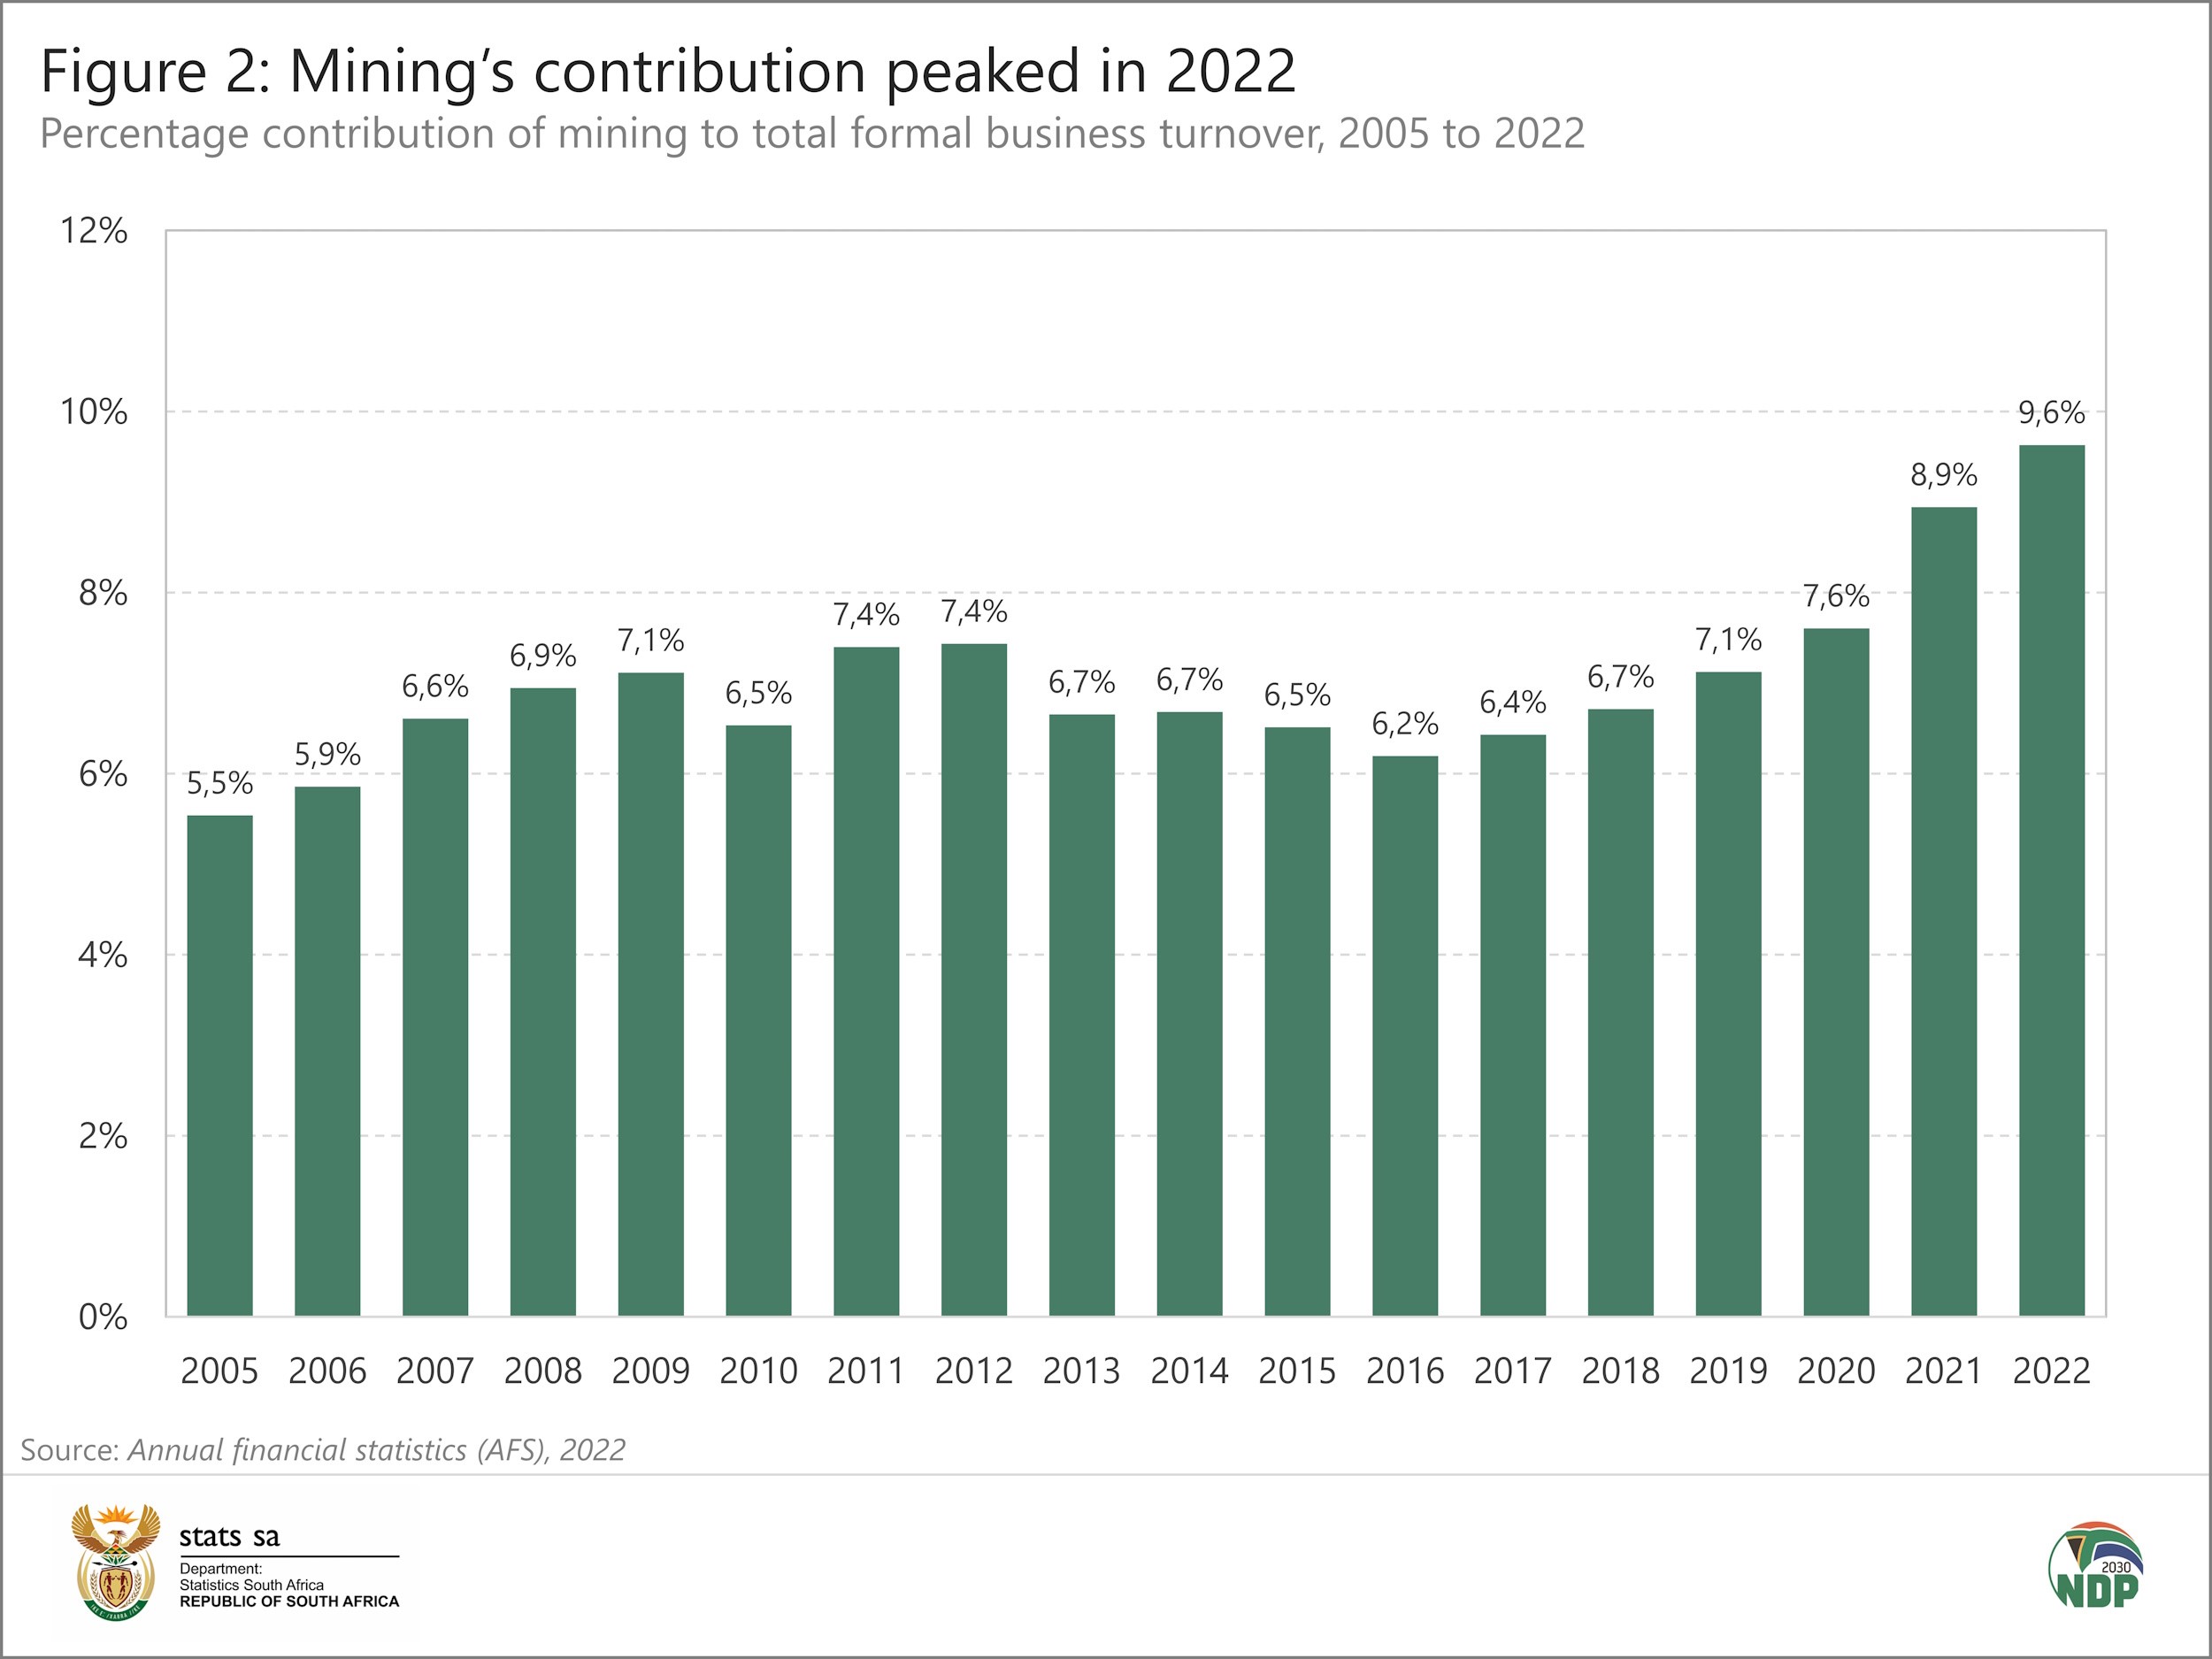
Second, the mining industry has muscled its way in, increasing its contribution from 5,5% in 2005 to 9,6% in 2022. A closer look at the data reveals that the mining industry’s contribution ebbed and flowed over this period, with a recent rise beginning in 2017 and sharp increases in 2021 and 2022 (Figure 2).
A closer examination of mining
In 2022, mining turnover rose by 28,2%, the largest percentage increase among the nine industries surveyed by the AFS (Figure 3). This represents a rise of R268,8 billion from R953,3 billion in 2021 to R1 222,1 billion in 2022.
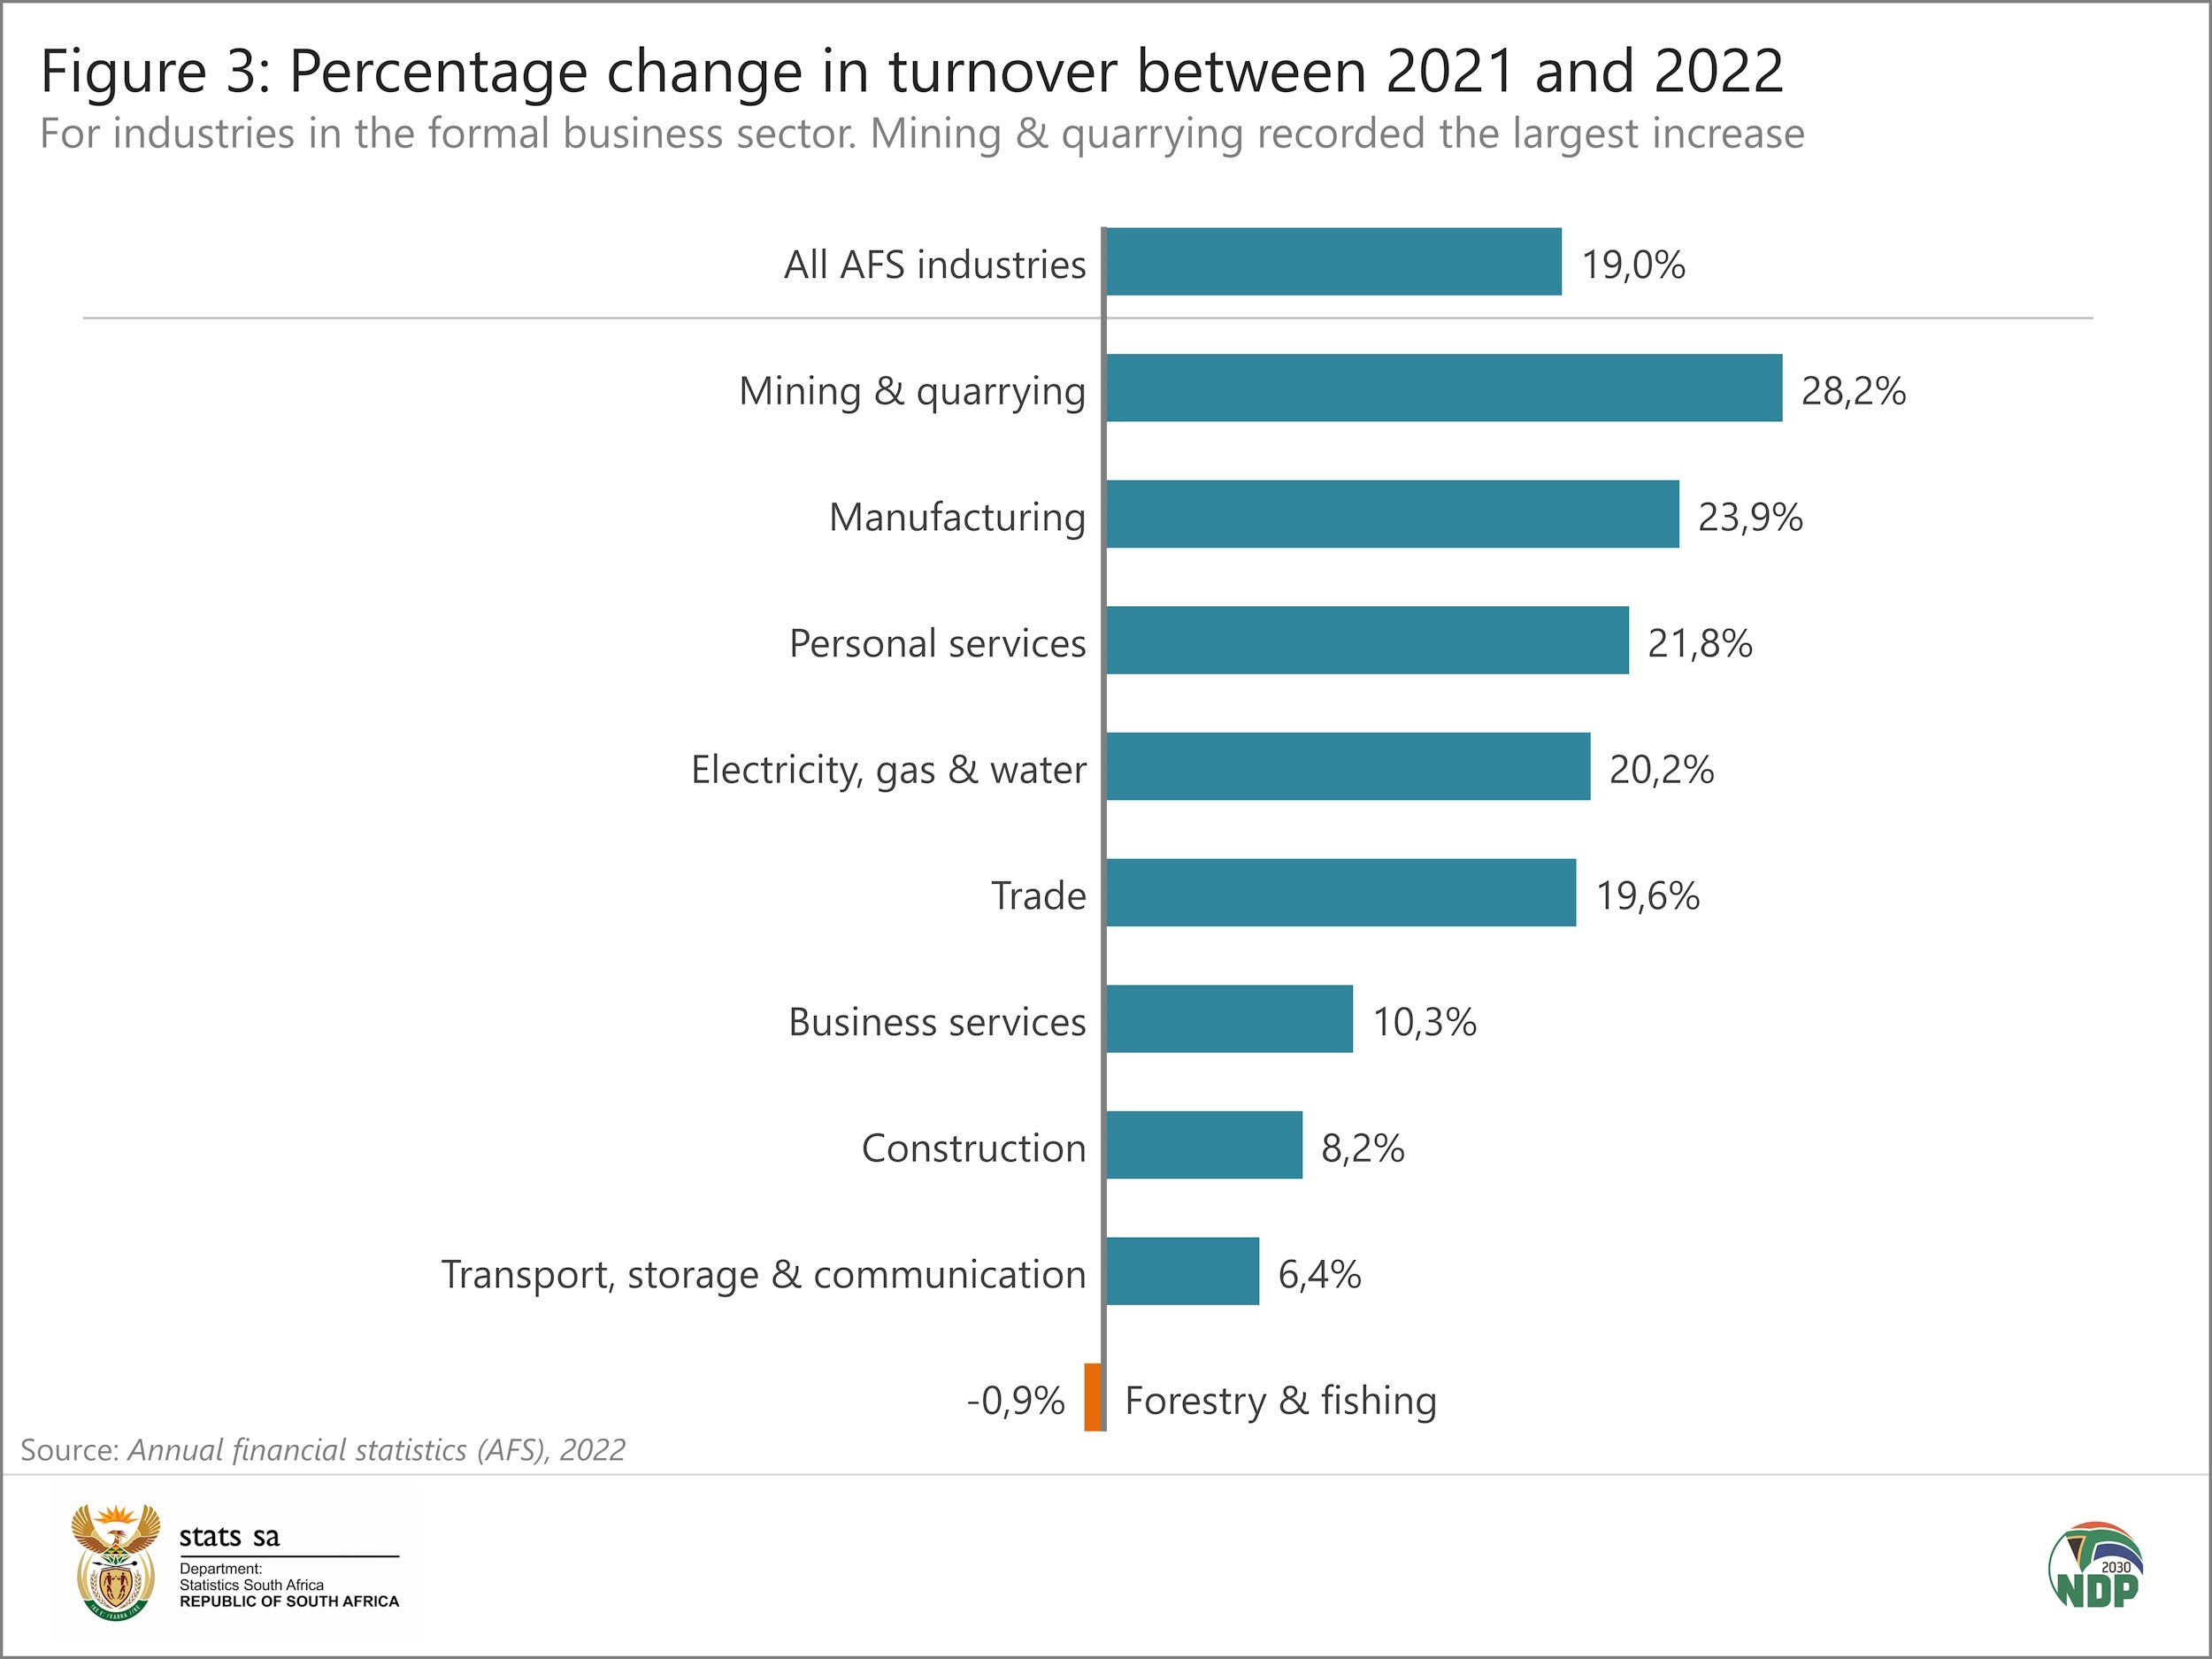
In fact, the 28,2% increase represents the sharpest annual rise for mining since 2007 when turnover grew by 35,7%.
Within mining, the increase in 2022 was recorded across all business sizes. Large enterprises led with an increase of 28,4%, followed by small and medium enterprises (up 28,3% and 21,8% respectively).
The rise in metal ores
Five of the six sub-groups within the mining industry contributed positively to the rise in mining turnover. Mining of metal ores (except gold & uranium) drove much of the upward momentum, increasing by R194,7 billion (or 31,4%) to R815,2 billion in 2022 from R620,4 billion in 2021 (Figure 4). In fact, the value of turnover generated by this sub-group has almost doubled since 2019, rising by an impressive 97,4% over this period.
This sub-group includes businesses involved in underground and open-cast extraction of metal ores and native metals, as well as the preparation of these ores such as crushing, grinding and washing. Key minerals include platinum group metals, iron ore, copper, manganese ore and chrome.
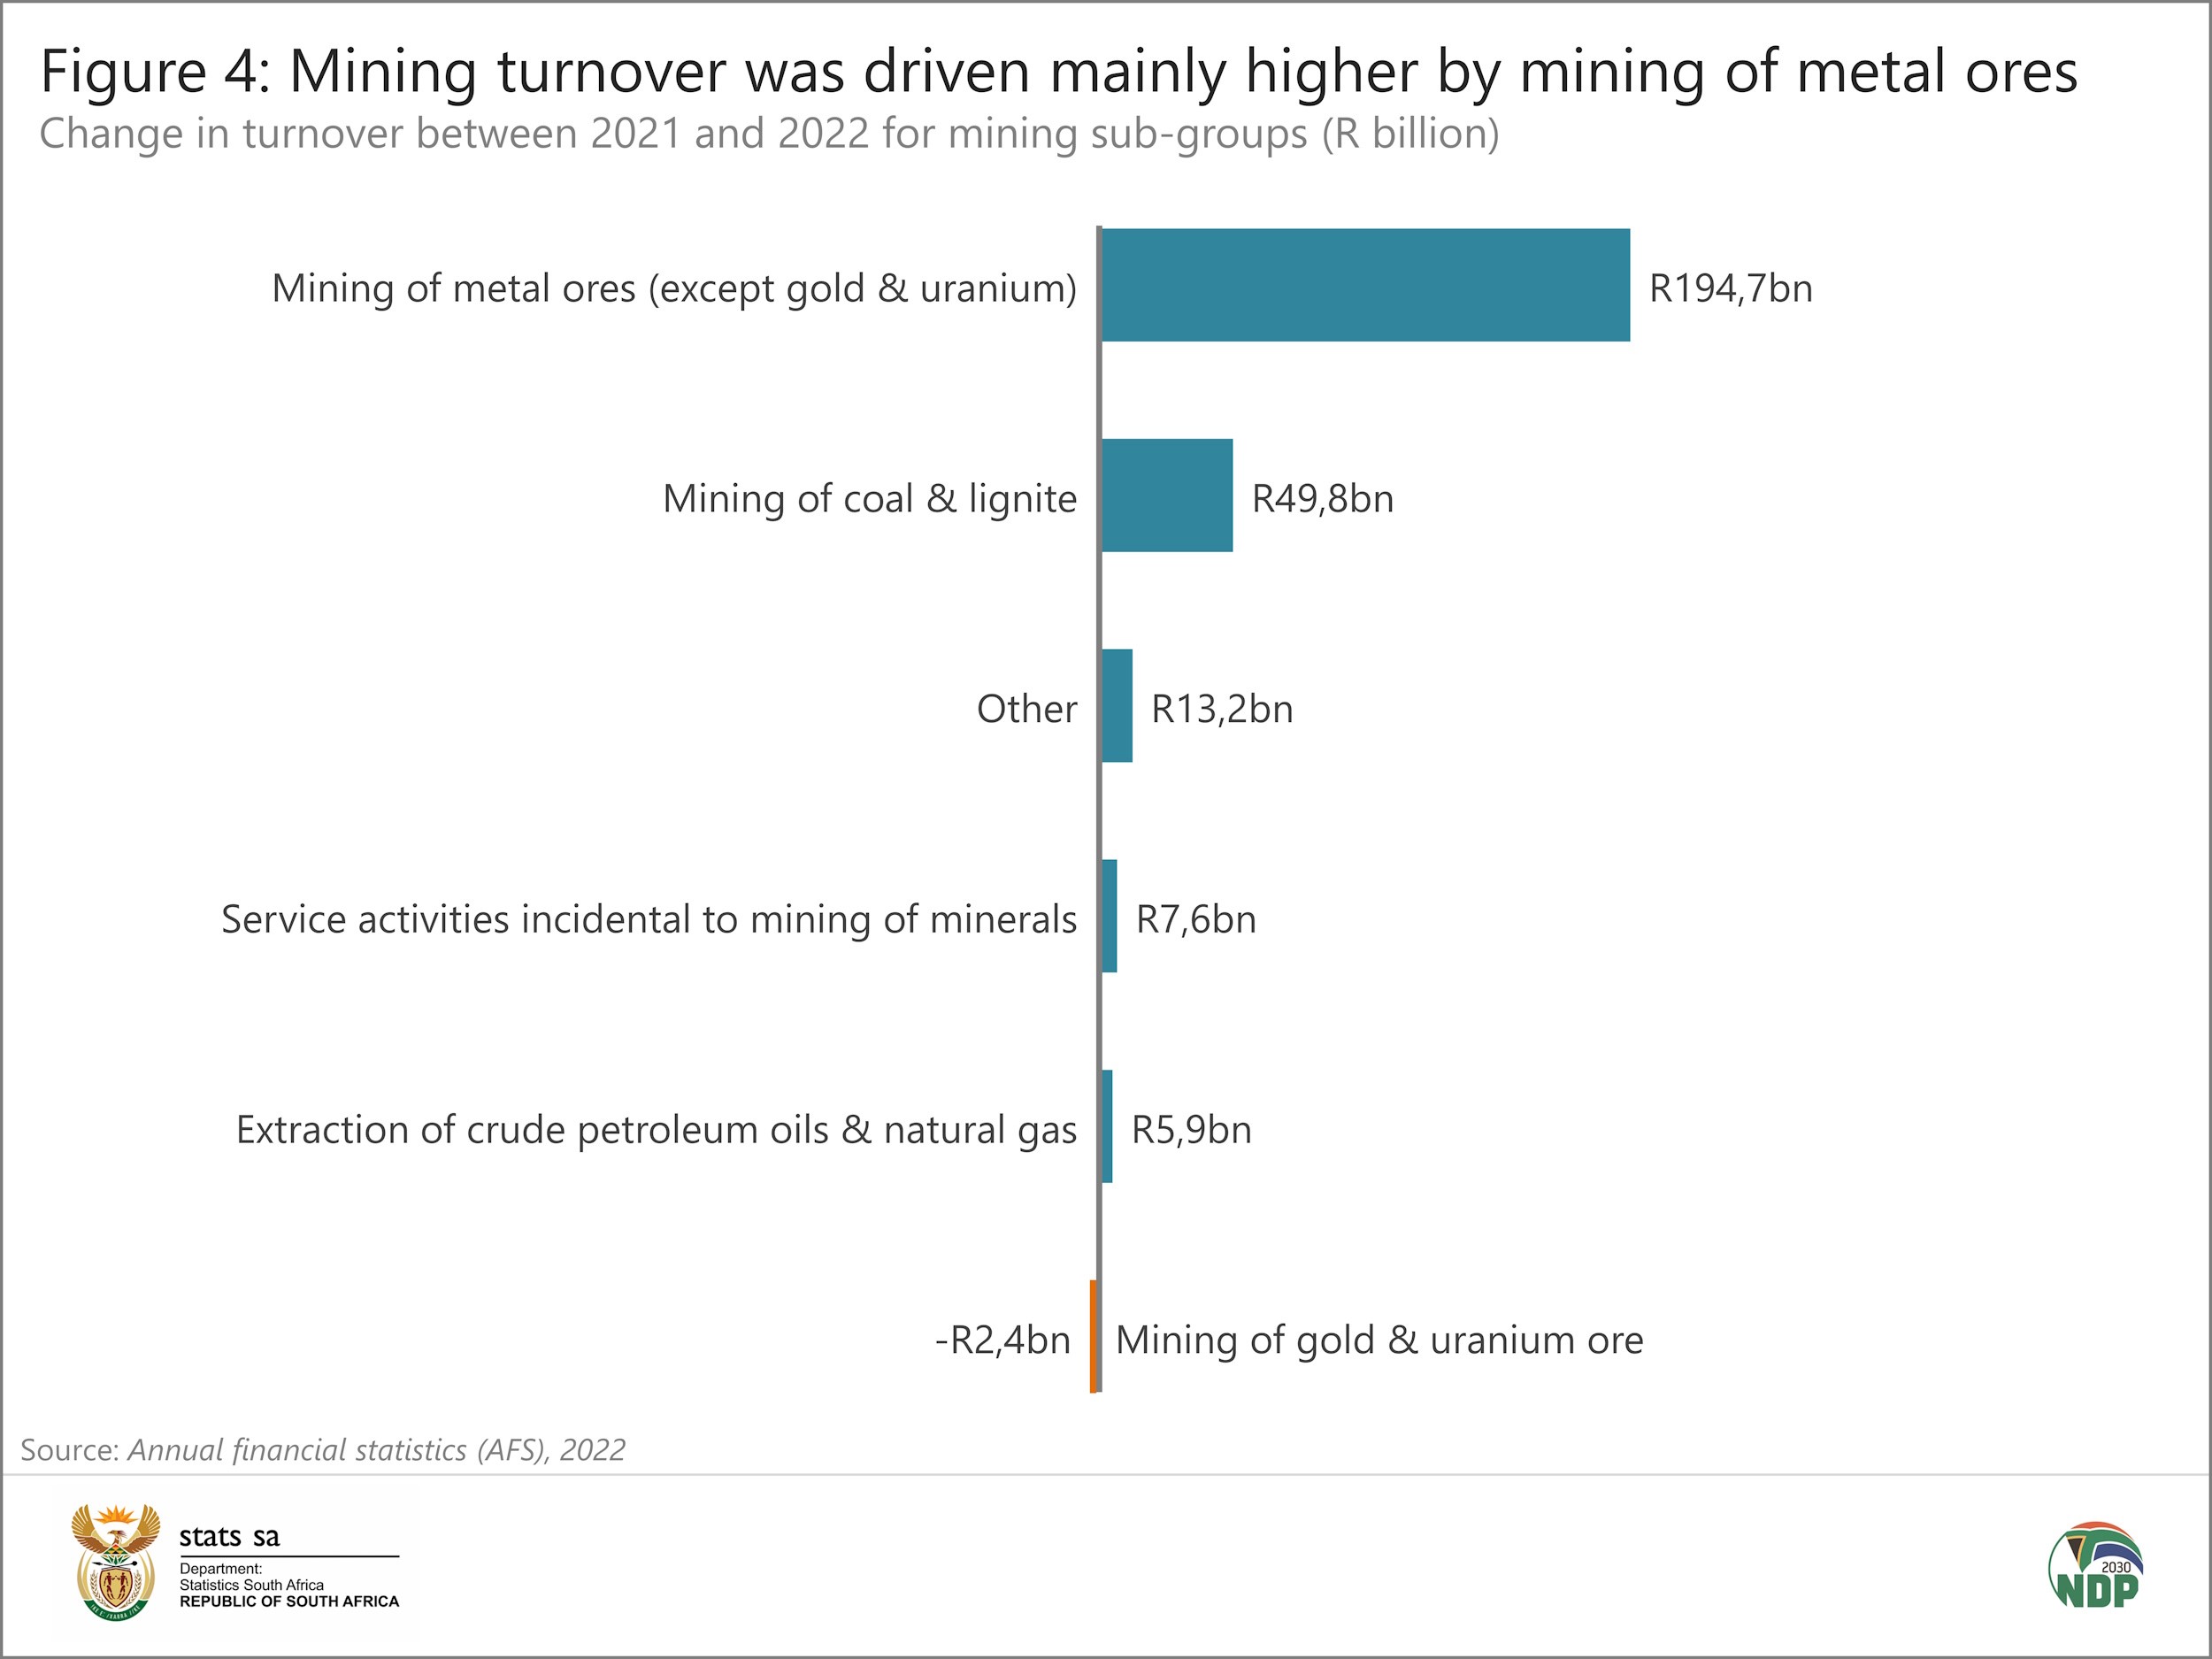
The largest percentage increase in 2022 was recorded by enterprises involved in the extraction of crude petroleum oils & natural gas, registering a rise of 61,2% (or R5,9 billion). This increase represents a recovery in turnover, attributed to higher prices and stronger sales after a notable slump of 31,6% in 2021 during the COVID-19 pandemic.
Mining of gold & uranium ore was the only sub-group to report a decline in 2022, weakening by 2,8% (or R2,4 billion). This follows a 23,2% decline in 2021.
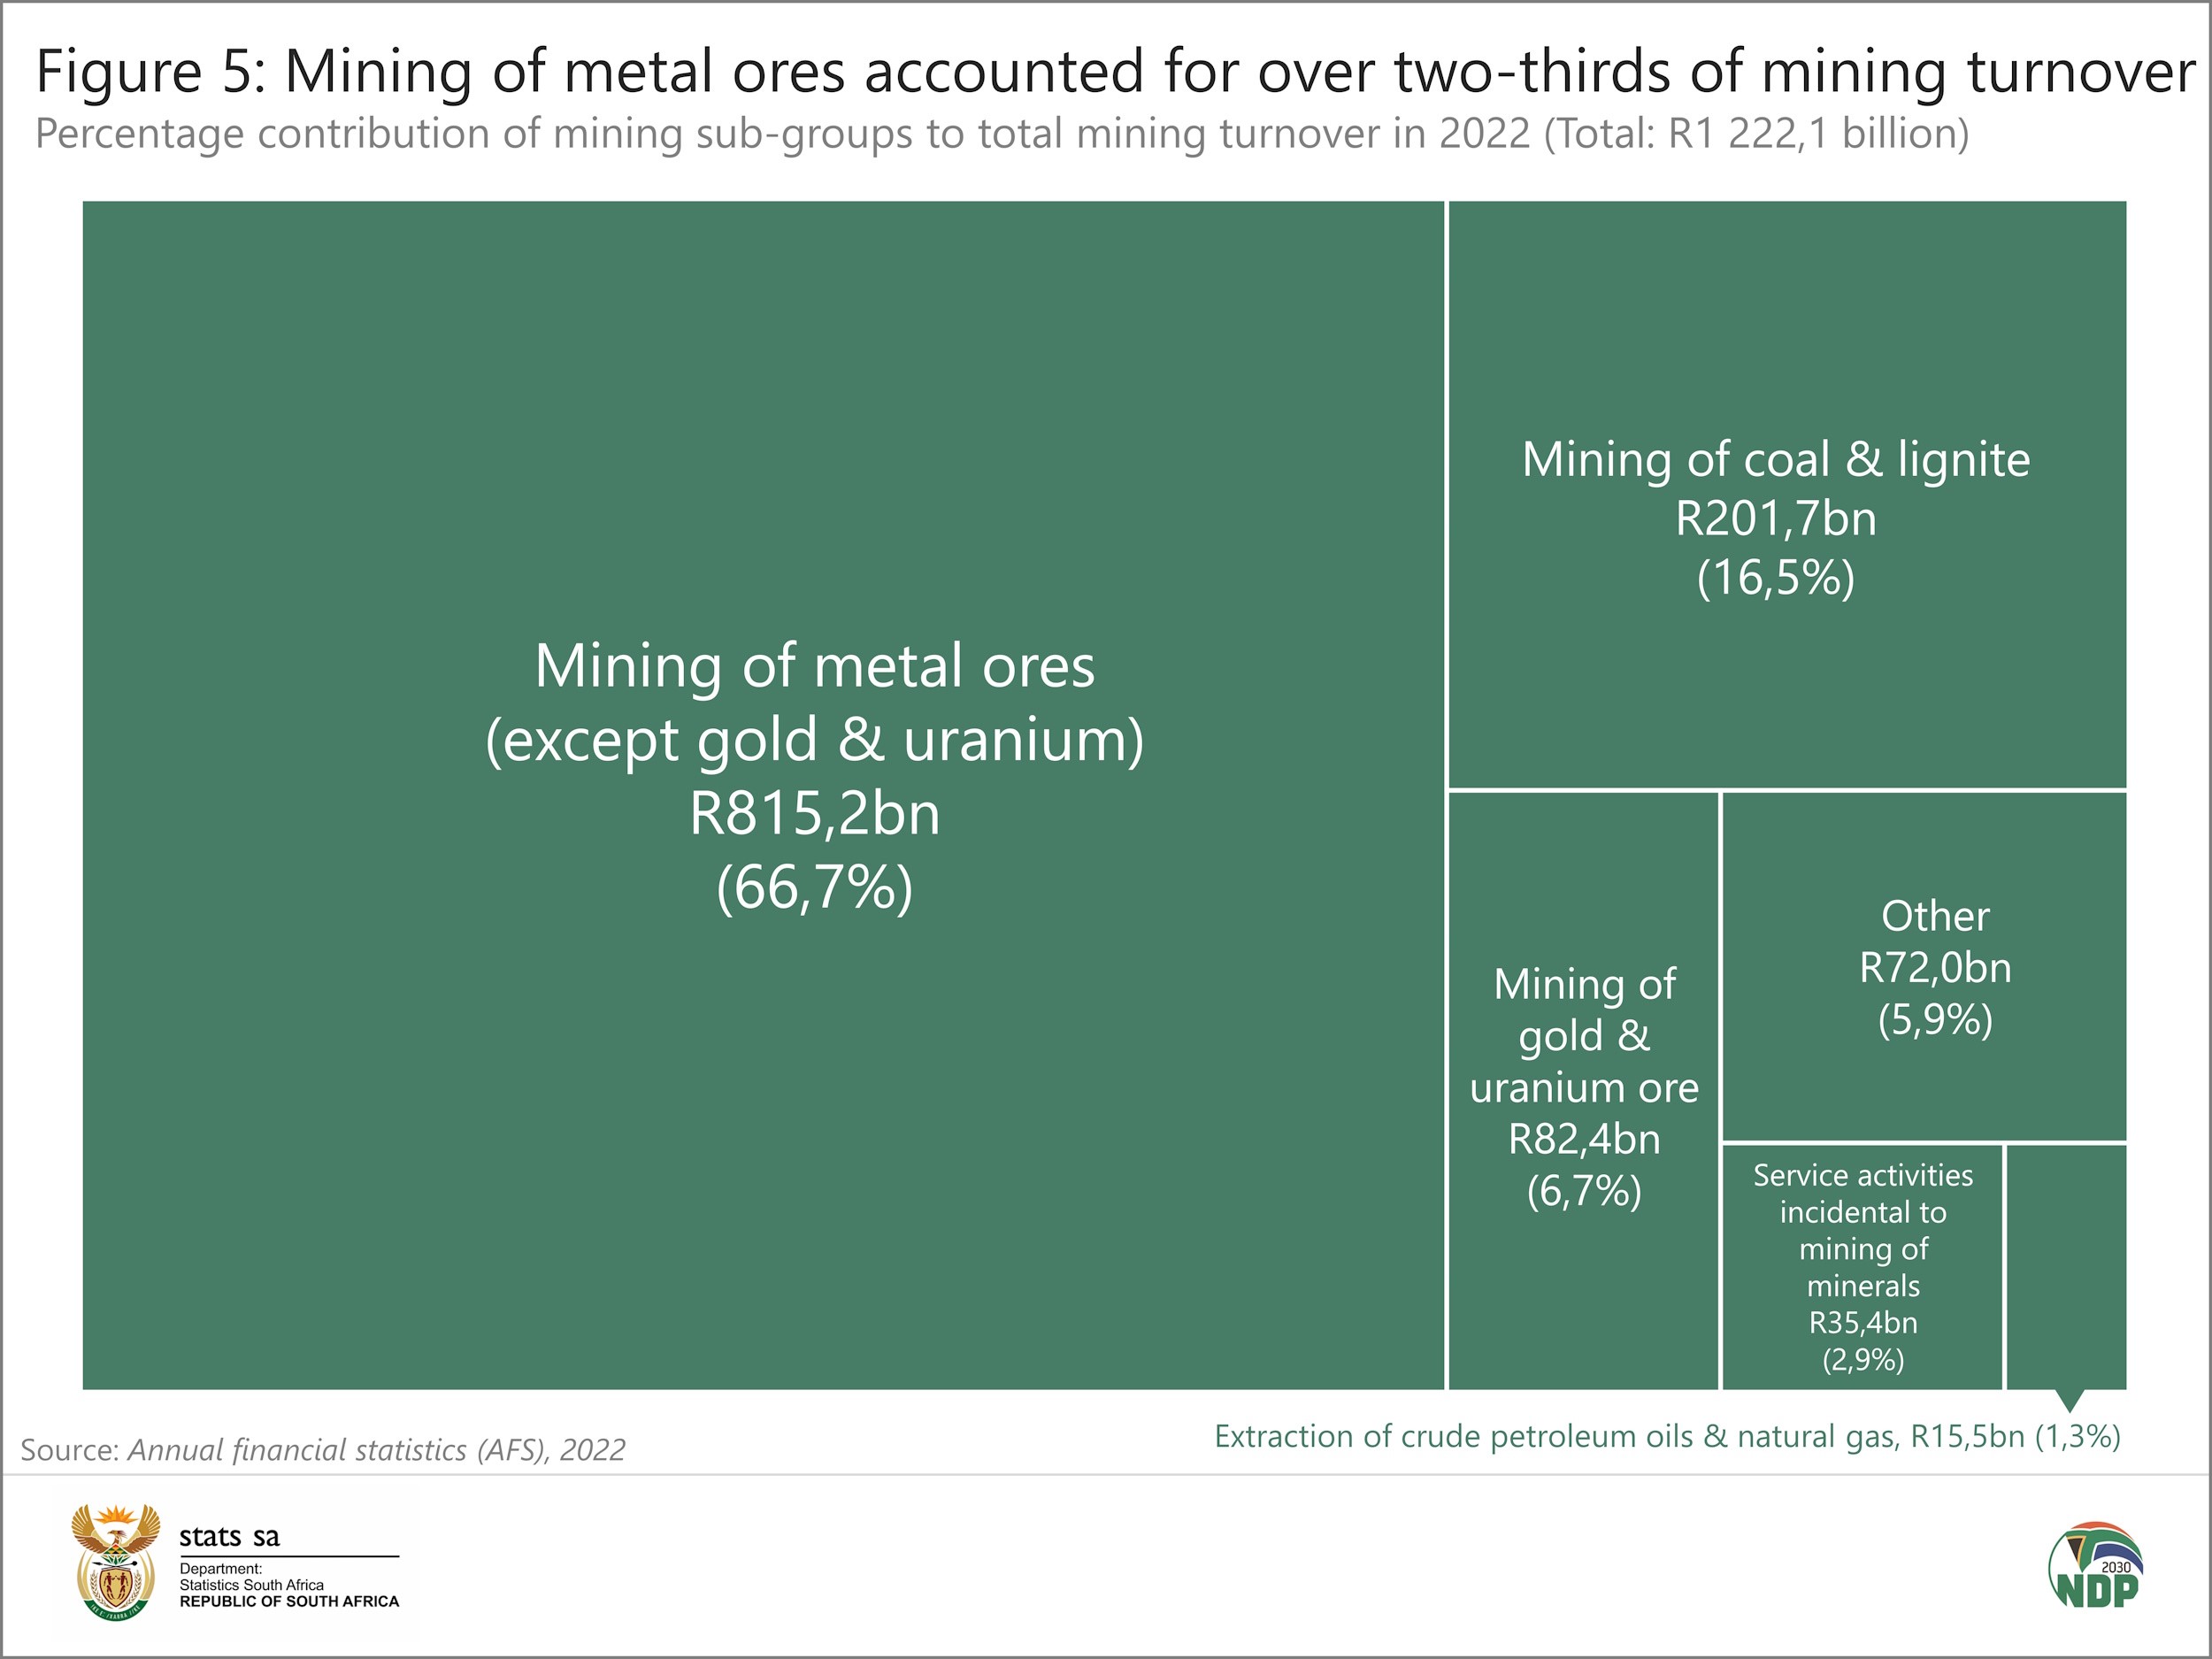
Figure 5 illustrates the dominance of the mining of metal ores (except gold & uranium) sub-group to mining turnover. The mining industry generated R1 222,1 billion in turnover in 2022, with mining of metal ores (except gold & uranium) accounting for just over two-thirds.
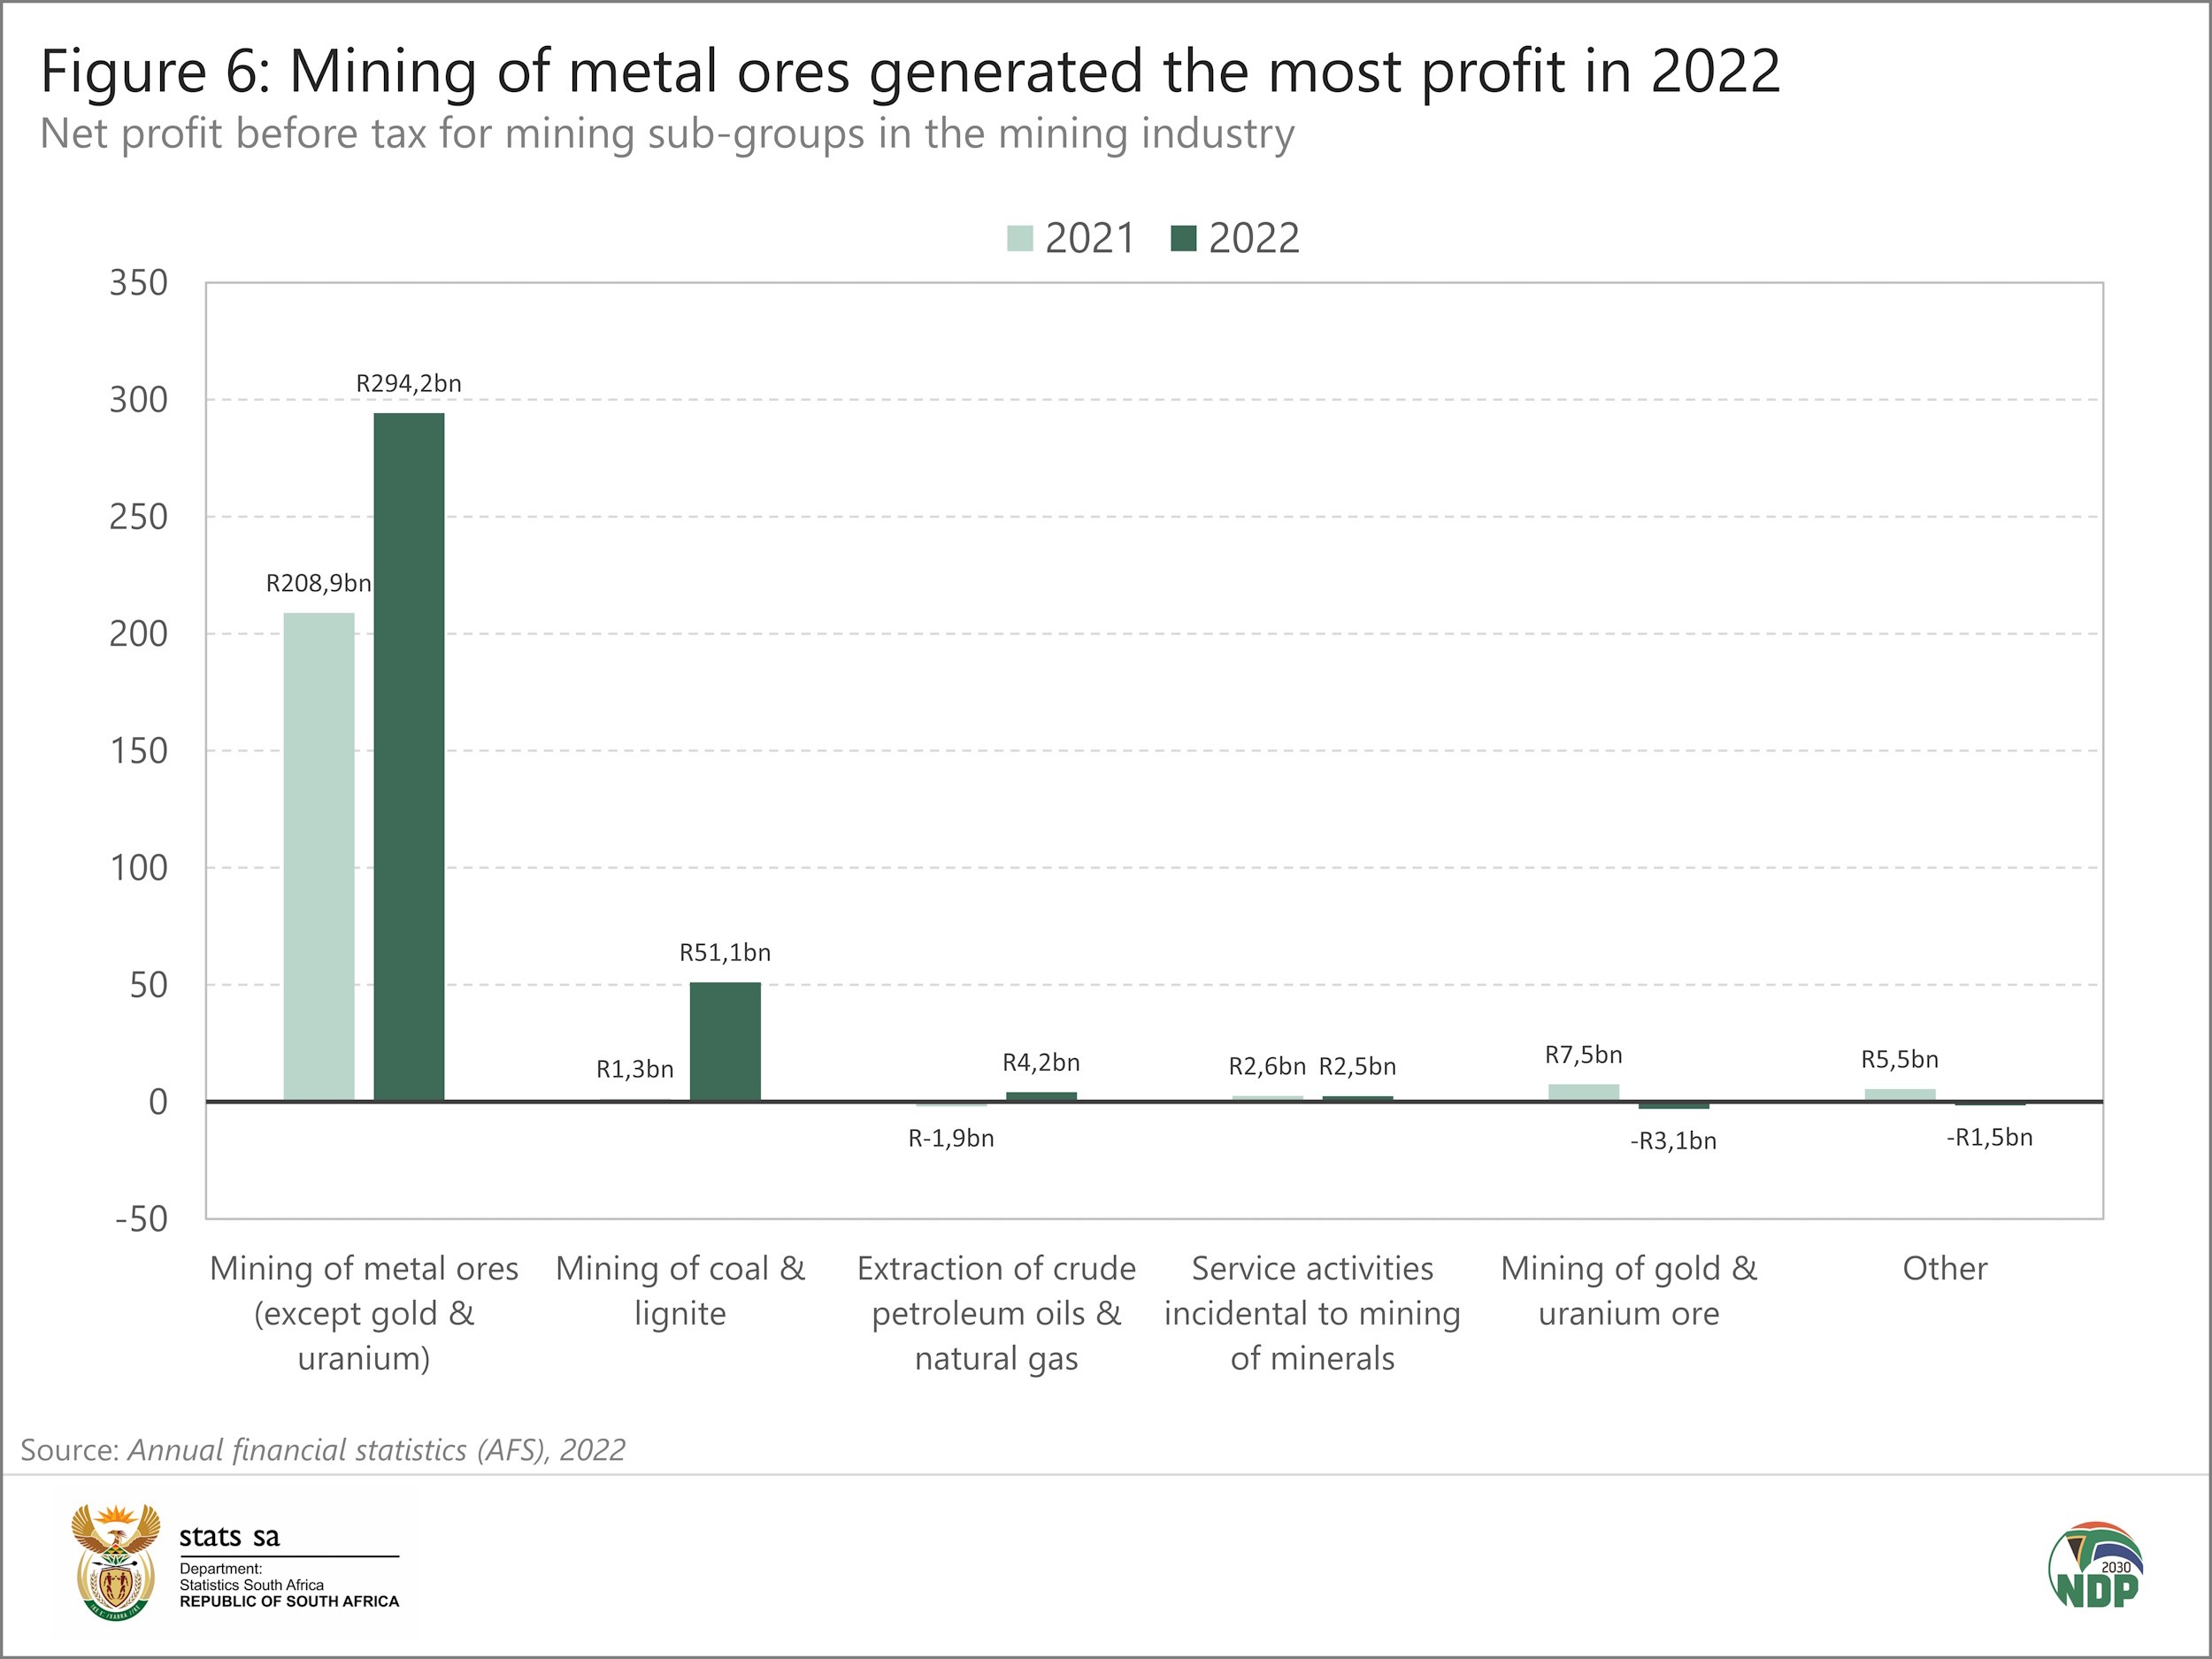
The mining of metal ores (except gold & uranium) sub-group also registered the highest net profit (before tax) in 2022, followed by the mining of coal & lignite sub-group (Figure 6). The mining of gold & uranium ore sub-group registered a loss in the same year
.
For more information, download the AFS 2022 statistical release and associated Excel files here.
1 The AFS survey measures the financial health and performance of each industry, providing information on turnover, purchases, employment cost and capital expenditure. The report sources data from the financial statements of enterprises (i.e. private businesses and public corporations), and is in turn an important source for estimating annual gross domestic product (GDP). The AFS excludes agriculture and hunting; general government and educational institutions; and financial intermediation, pension funding, insurance and business services not elsewhere classified.
Similar articles are available on the Stats SA website and can be accessed here.
For a monthly overview of economic indicators and infographics, catch the latest edition of the Stats Biz newsletter here.