
Economic wrap-up for September 2023
Stats SA published a variety of reports, statistical releases and discussion documents in September. Here is a rundown of key economic indicators.
GDP: SA invests in machinery & equipment and households cut back on spending
In September, Stats SA released both national and provincial gross domestic product (GDP) figures. On the national front, GDP recorded its second consecutive quarter of growth, edging higher by 0,6% in the second quarter. Manufacturing and finance were the main drivers of growth on the production (supply) side of the economy. The electricity, gas & water supply industry continued to struggle, registering its fifth consecutive quarter of decline.
The expenditure (demand) side of the economy also expanded in the second quarter, driven mainly by investments in infrastructure and fixed assets. The country saw a sharp rise in spending on machinery & equipment. Interestingly, this included products related to renewable energy.
Consumers remained under pressure. Households tapped the brakes on spending, shifting their focus away from items such as food & beverages, furniture, recreation and clothing, opting instead to spend on restaurants & hotels, transport, health and education.
Gauteng remains the backbone of the national economy
The long-awaited provincial GDP series, currently published as a discussion document, paints a rich picture of the structure and performance of provincial economies.
In 2022, the economy of Gauteng was larger than the economies of Western Cape and KwaZulu-Natal combined, responsible for a third of national economic activity. Gauteng also benefited the most from economic growth in 2022 compared with 2021, expanding by 2,8%. The finance and transport & communication industries drove much of the upward momentum in the province.
Inflation heats up
After cooling for four months, annual consumer price inflation inched higher in August, rising to 4,8% from 4,7% in July. Most of the upward pressure came from higher fuel prices and increases in municipal rates (for water, electricity and property). Annual food inflation continued to ease, however, recording its fifth straight month of decline.
Price inflation at the factory gate was also higher, breaking a year-long downward trend. Annual producer price inflation (for final manufactured goods) increased to 4,3% in August from 2,7% in July. Metals, machinery & equipment and food & beverages were major contributors to the rate in August.
Monthly indicators: Manufacturing extends its gains
Several business cycle indicators were published in September, covering the month of July. Manufacturing; motor trade; tourist accommodation; restaurants, catering & fast-food and passenger transport recorded positive year-on-year gains in July. On the downside, mining; electricity generation; construction (buildings completed); wholesale trade; retail trade and freight transport were weaker (Figure 1).
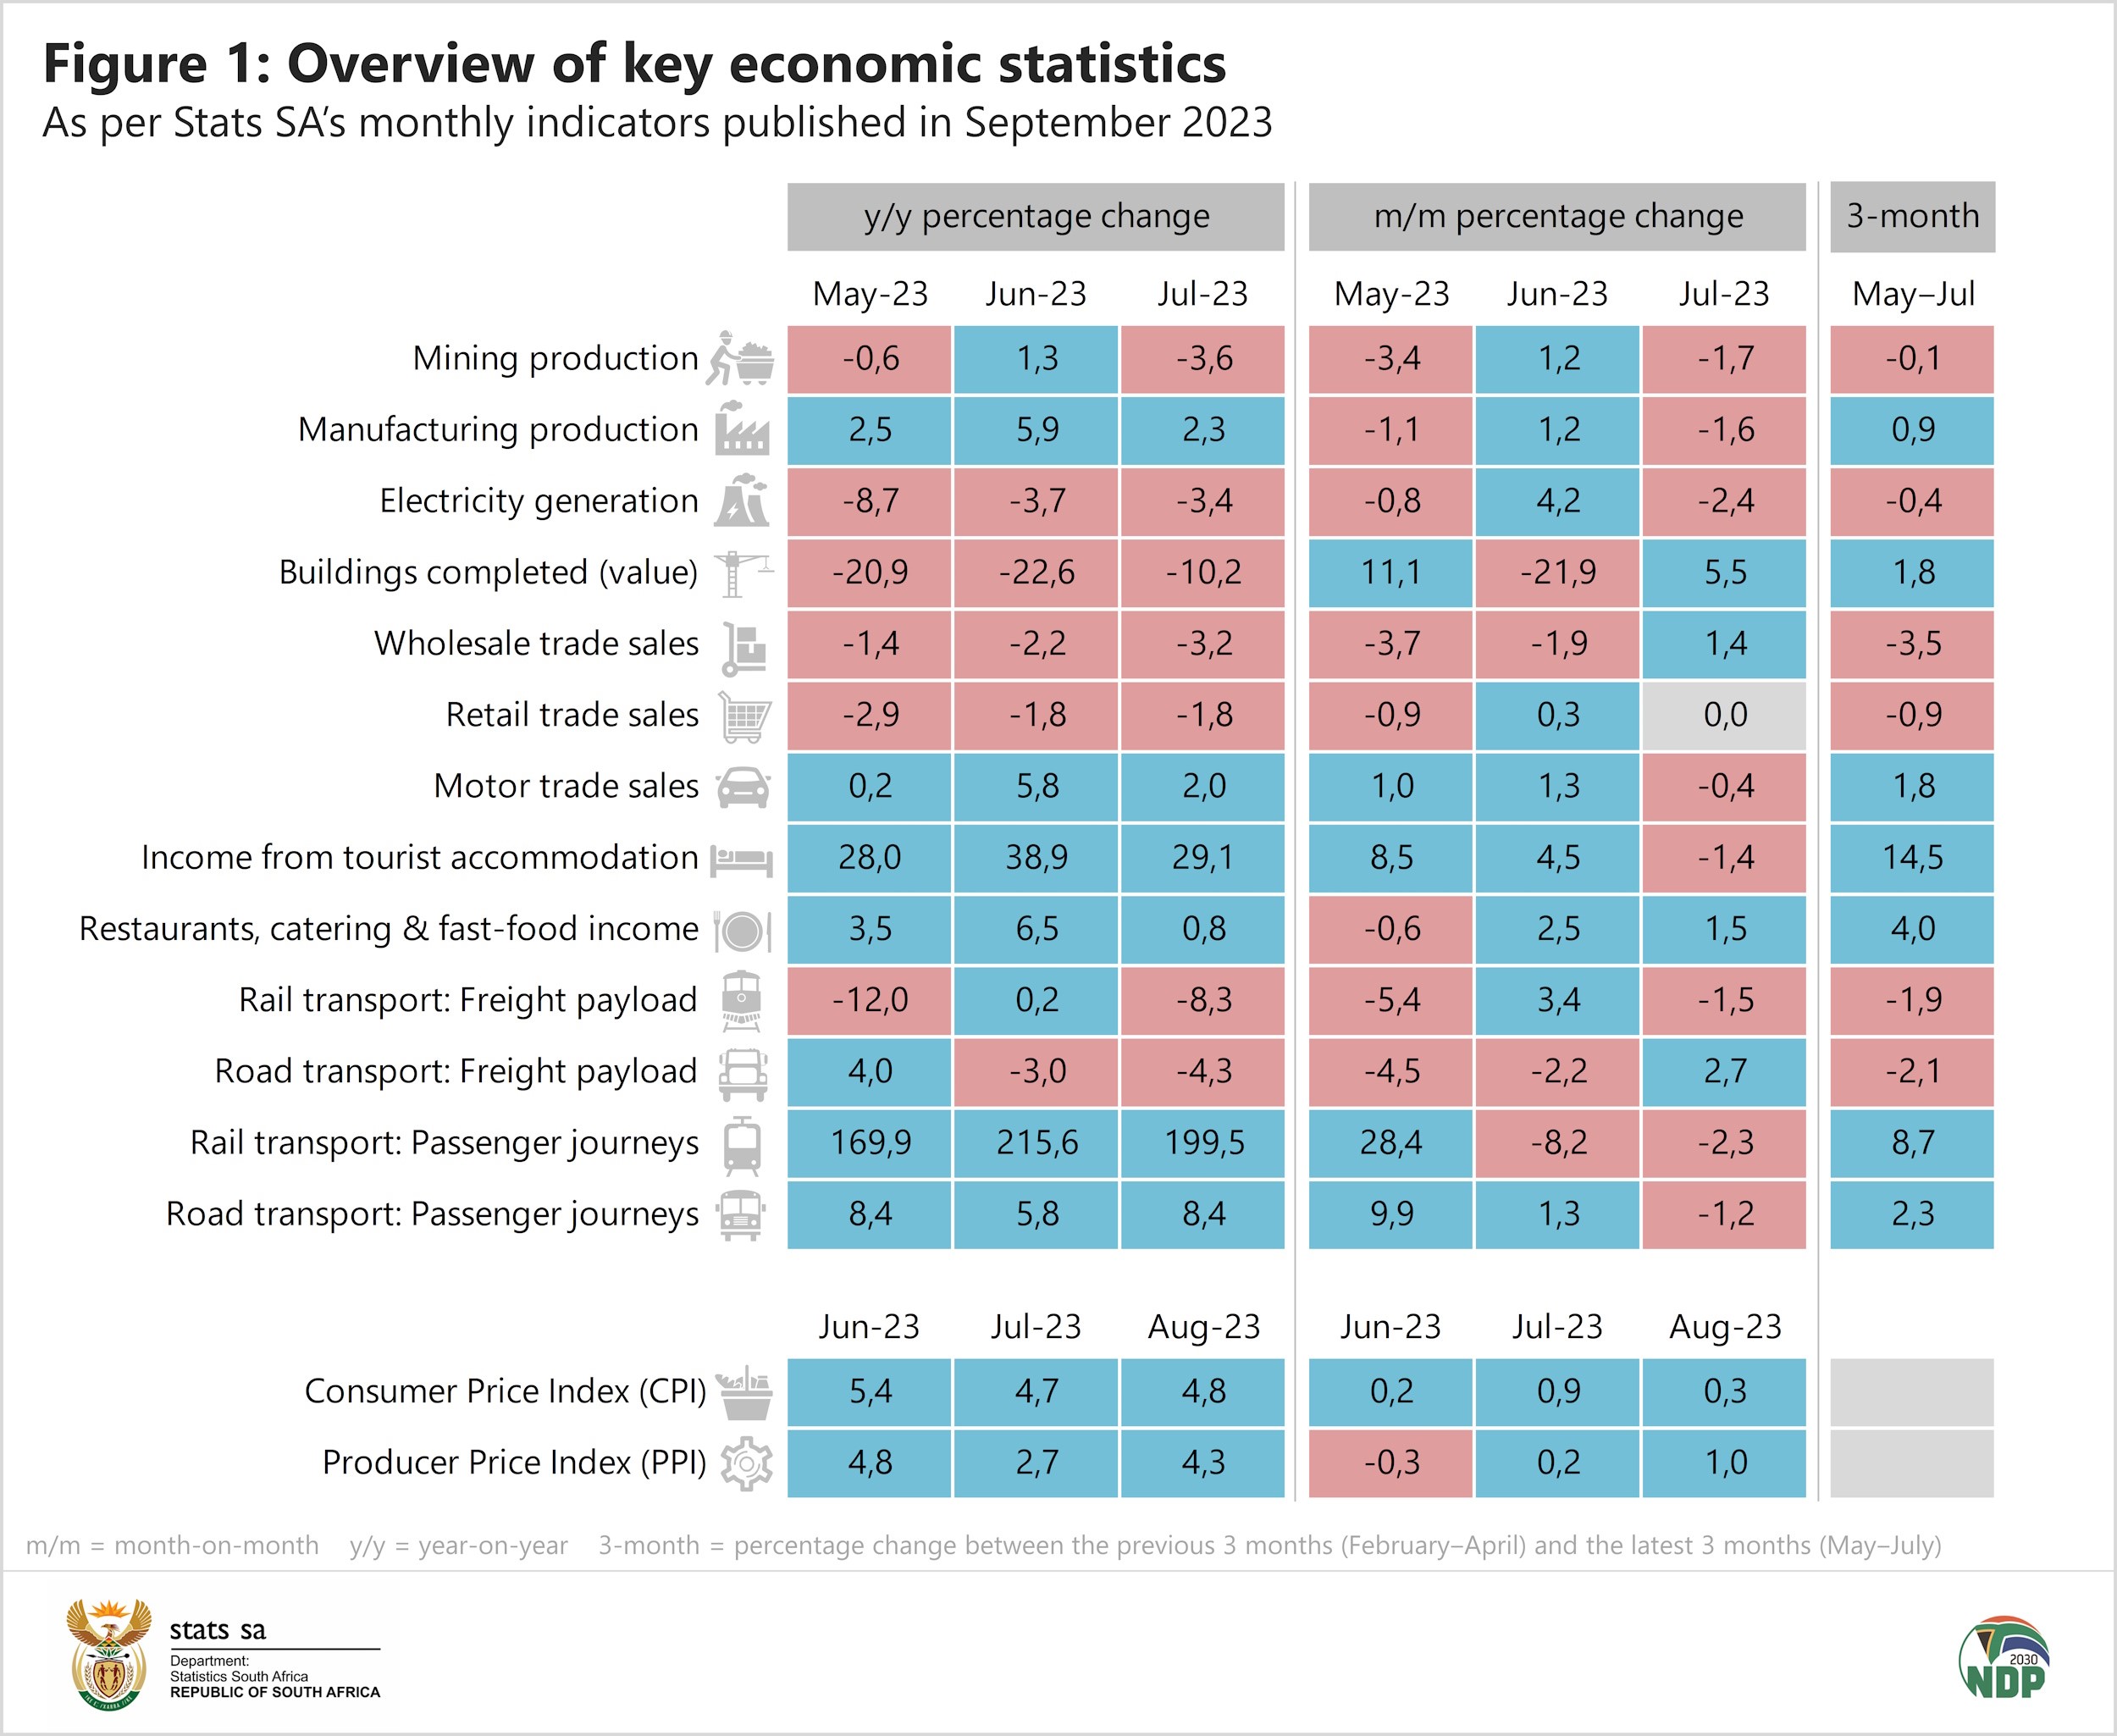
Manufacturing production extended its gains, registering its fourth consecutive month of year-on-year growth. Production increased by 2,3% in July with six of the ten manufacturing divisions recording a rise in output. Petroleum, chemicals, rubber & plastics and the automotive division drove much of the upward momentum.
Overall mining production was down, contracting by 3,6% year-on-year in July. Platinum group metals, coal and diamonds were the biggest drags on growth. Nickel, manganese ore and chromium ore were also weaker. On the upside, miners in copper, gold and iron ore recorded positive results.
Retail trade was also negative. Sales were down for an eighth consecutive month (year-on-year), possibly a further indication of consumer strain. Sales declined by 1,8% in July, weighed down mainly by general dealers (supermarkets) and hardware stores.
What to look forward to in October
Together with its regular set of monthly economic releases, Stats SA will publish the latest annual Financial statistics of higher education institutions report on Thursday, 26 October. The data will provide a financial overview of South Africa’s universities and universities of technology for the year 2022. The report will be published here.
Keep the latest data at your fingertips with our publication schedule here. For a comprehensive list of products and releases, download our catalogue. For a regular update of economic indicators and infographics, visit our data story feed here and catch the latest edition of the Stats Biz newsletter.