
New samples for monthly business cycle indicators
In September 2023, Statistics South Africa (Stats SA) published the results of a number of monthly surveys, which are based on new samples. These are:
- P3041.2 – Manufacturing: Production and sales;
- P6141.2 – Wholesale trade sales;
- P6242.1 – Retail trade sales;
- P6343.2 – Motor trade sales;
- P6410 – Tourist accommodation;
- P6420 – Food and beverages; and
- P7162 – Land transport.
New samples for these surveys are drawn annually.
The impact of each new sample is described in the statistical release (reference month July 2023 and publication month September 2023). This note is an update of a similar piece published in 2022 and provides a summary of the new samples drawn as well as the recent history thereof.
Keeping samples and surveys up to date
Each sample is drawn from Stats SA’s statistical business register (SBR), which is maintained through information provided by the South African Revenue Service (SARS). Stats SA undertakes quality improvement surveys to keep the SBR up to date regarding the demographic events of the businesses such as mergers, change in contact details and primary economic activity. It is important, therefore, to draw new samples to keep surveys up to date with changes in the SBR to ensure that economic activity is accurately measured.
Differences in levels between the samples
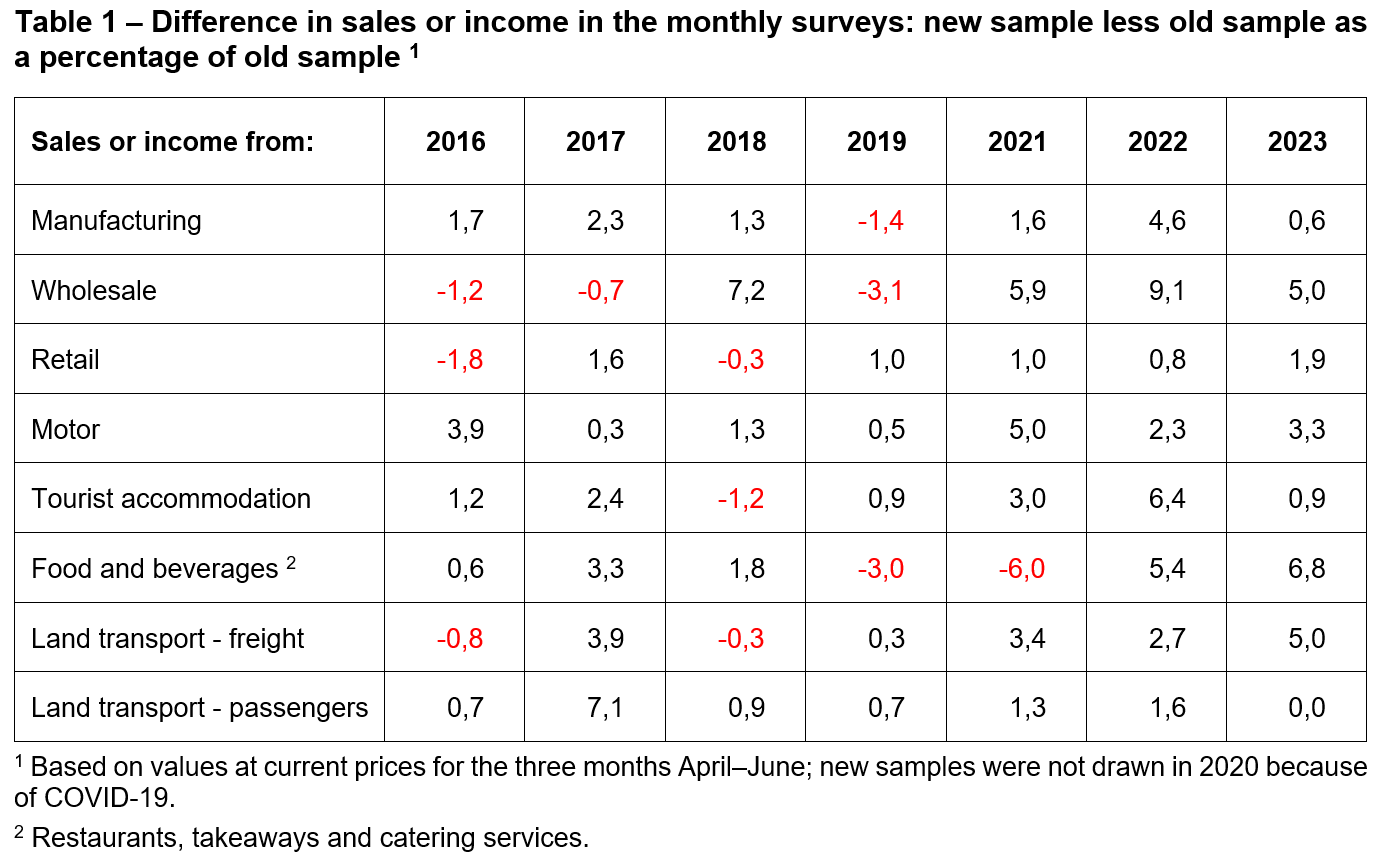
For each of the surveys listed above, new samples were administered in parallel with the old samples for three months, namely April, May and June 2023. This approach is taken every year when new samples are introduced. Comparisons between the new and old samples are provided in Table 1. For example, in 2023 the level of manufacturing sales was 0,6% higher based on the new sample. The differences in 2023 ranged from 0,0% (land transport – passengers) to 6,8% (food and beverages). Table 1 shows the history of level changes between old and new samples going back to 2016.
Linking the old series to the new
For most users, the most useful and interesting statistics from monthly business cycle indicators are the growth rates rather than the actual values of sales or income. Publishing the old and new series without linking the time-series would distort growth rates, whether the growth rates are calculated month-on-month or year-on-year, at current or constant prices, or using seasonally adjusted or unadjusted data. The greater the difference between the two samples, the greater the distortion in growth rates would be if there were no linking.
Consequently, Stats SA revises the historical data by linking the old series to the new series using a simple formula:
![]()
Linking results in a continuous series between revised and new, such that the growth rates are not distorted by the change in the sample.
Figure 1 illustrates the effect of new samples in terms of levels, measured at current prices. Wholesale trade sales are shown for three different samples, namely 2021, 2022, and 2023. The 2021 sample runs until June 2022, because that is the last month in which it was used. A new sample was drawn in 2022, which was used up until June 2023. The 2023 sample will be used until June 2024.
Figure 1 – Wholesale trade levels
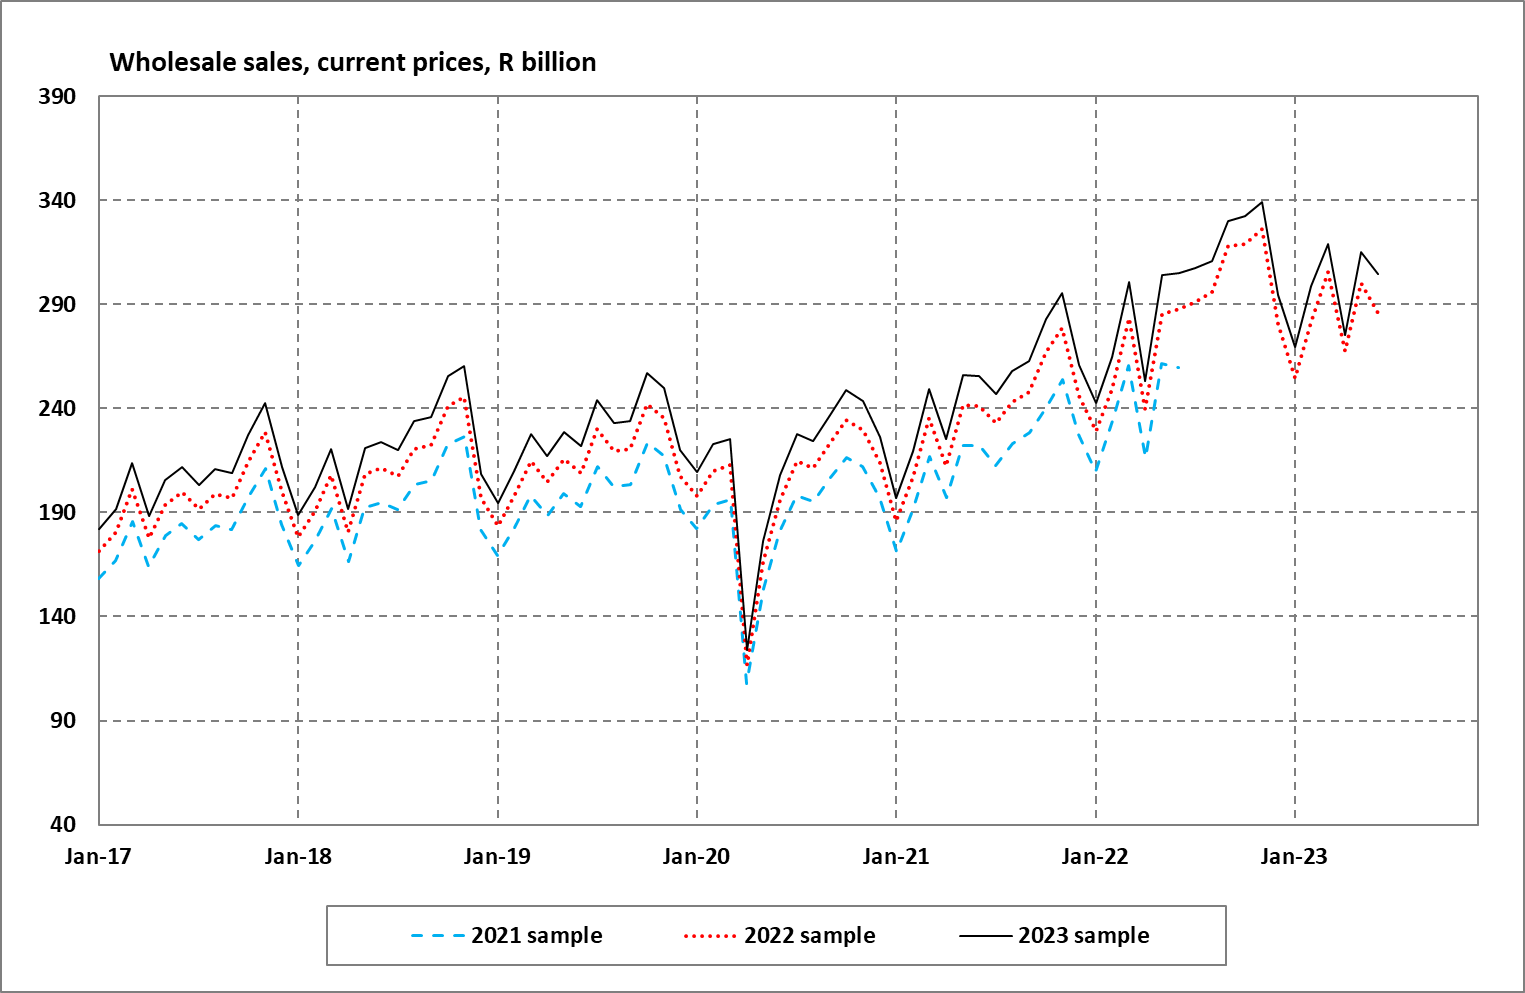
In Figure 1 the 2022 sample lies approximately 9% above the 2021 sample, and the 2023 sample lies approximately 5% above the 2022 sample. However, the patterns for all three samples are similar over time, and as shown in Figure 2 the impact on historical growth rates is relatively small.
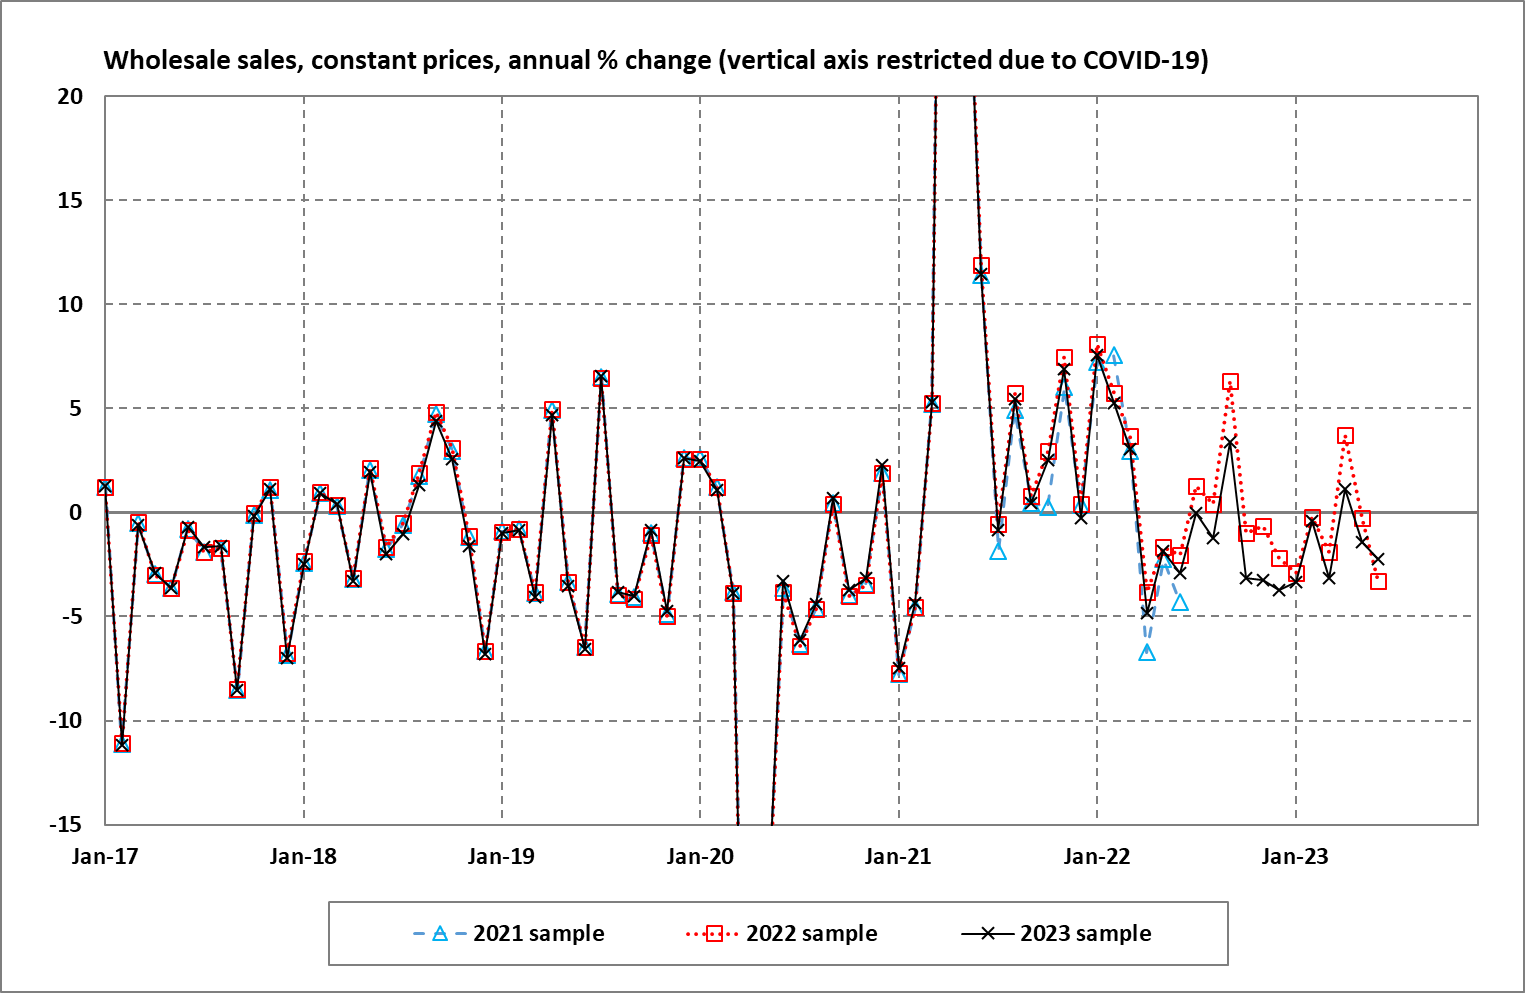
Figure 2 shows wholesale trade annual growth rates corresponding to the three different samples, all based on estimates at constant prices. The linking described above is performed at current prices, and the results are then deflated to arrive at constant prices. Thus the effect of linking carries through to constant prices automatically, with two important results for real growth rates. First, the growth rates are not distorted by the introduction of new samples. Second, the newly calculated growth rates are close to those published previously. Differences in growth rates (between the old and new samples) are partly the result of data cleaning processes related to technical issues such as the late receipt of data from respondents, the replacement of imputed values with actual values, and changes in respondents’ reporting structures.
Figure 2 – Wholesale trade growth rates
Figures 3 and 4 show the results for retail trade sales, and they can be interpreted in the same way as Figures 1 and 2. The gaps between the samples in Figure 3 (retail) are much smaller than those in Figure 1 (wholesale), reflecting the differences between retail and wholesale that we see in Table 1 (for 2022 and 2023).
In Figure 3, note that the sharp upward spikes in retail trade are the high festive-season sales that we see every December (i.e. the data are not seasonally adjusted). Figure 3 also shows a sharp downward spike in April 2020, which is the impact of COVID‑19 and lockdown; a similar downward spike can be seen in Figure 1.
In Figure 4, note once again that new samples do not have much impact on historical growth rates, which is the outcome of linking using formula [1].
Figure 3 – Retail trade levels
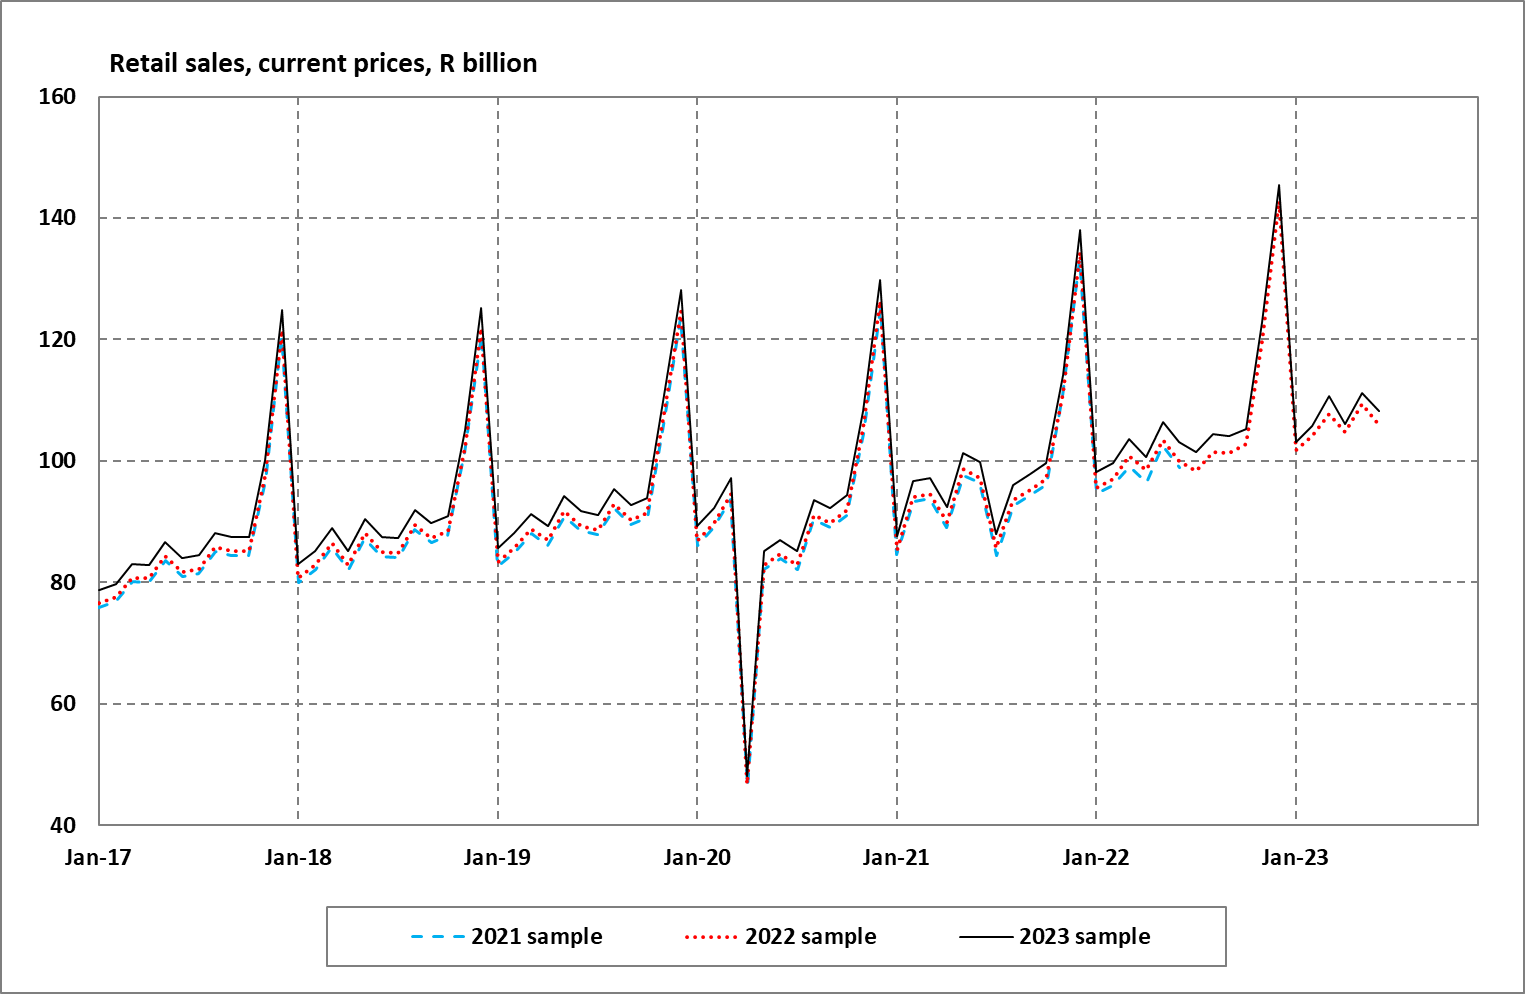
Figure 4 – Retail trade growth rates
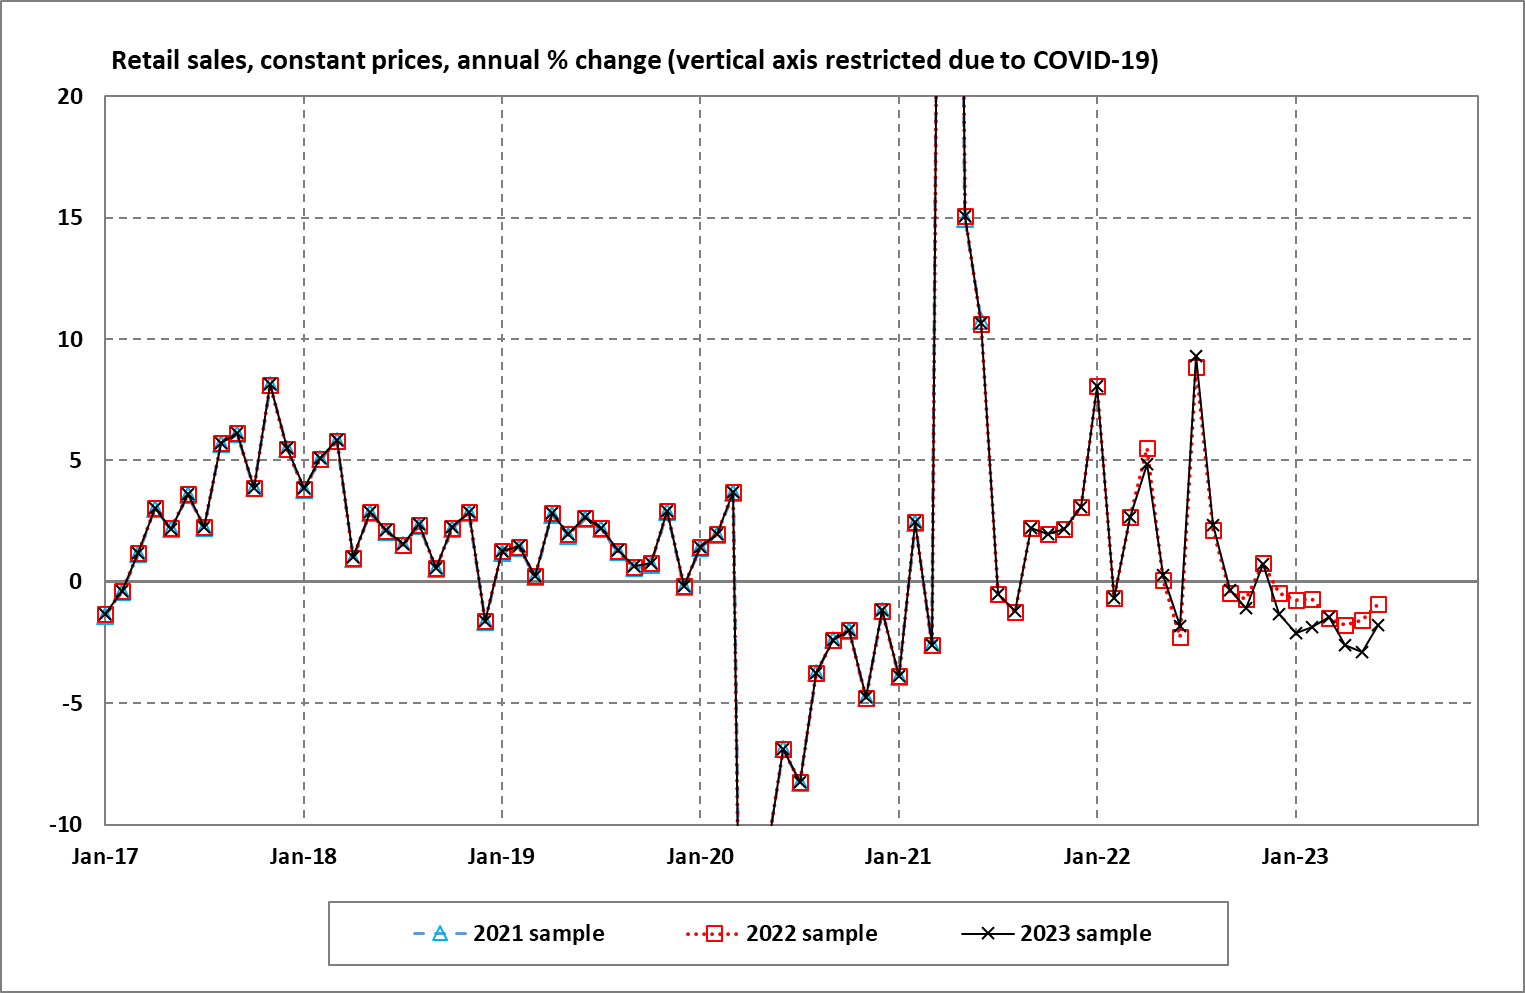
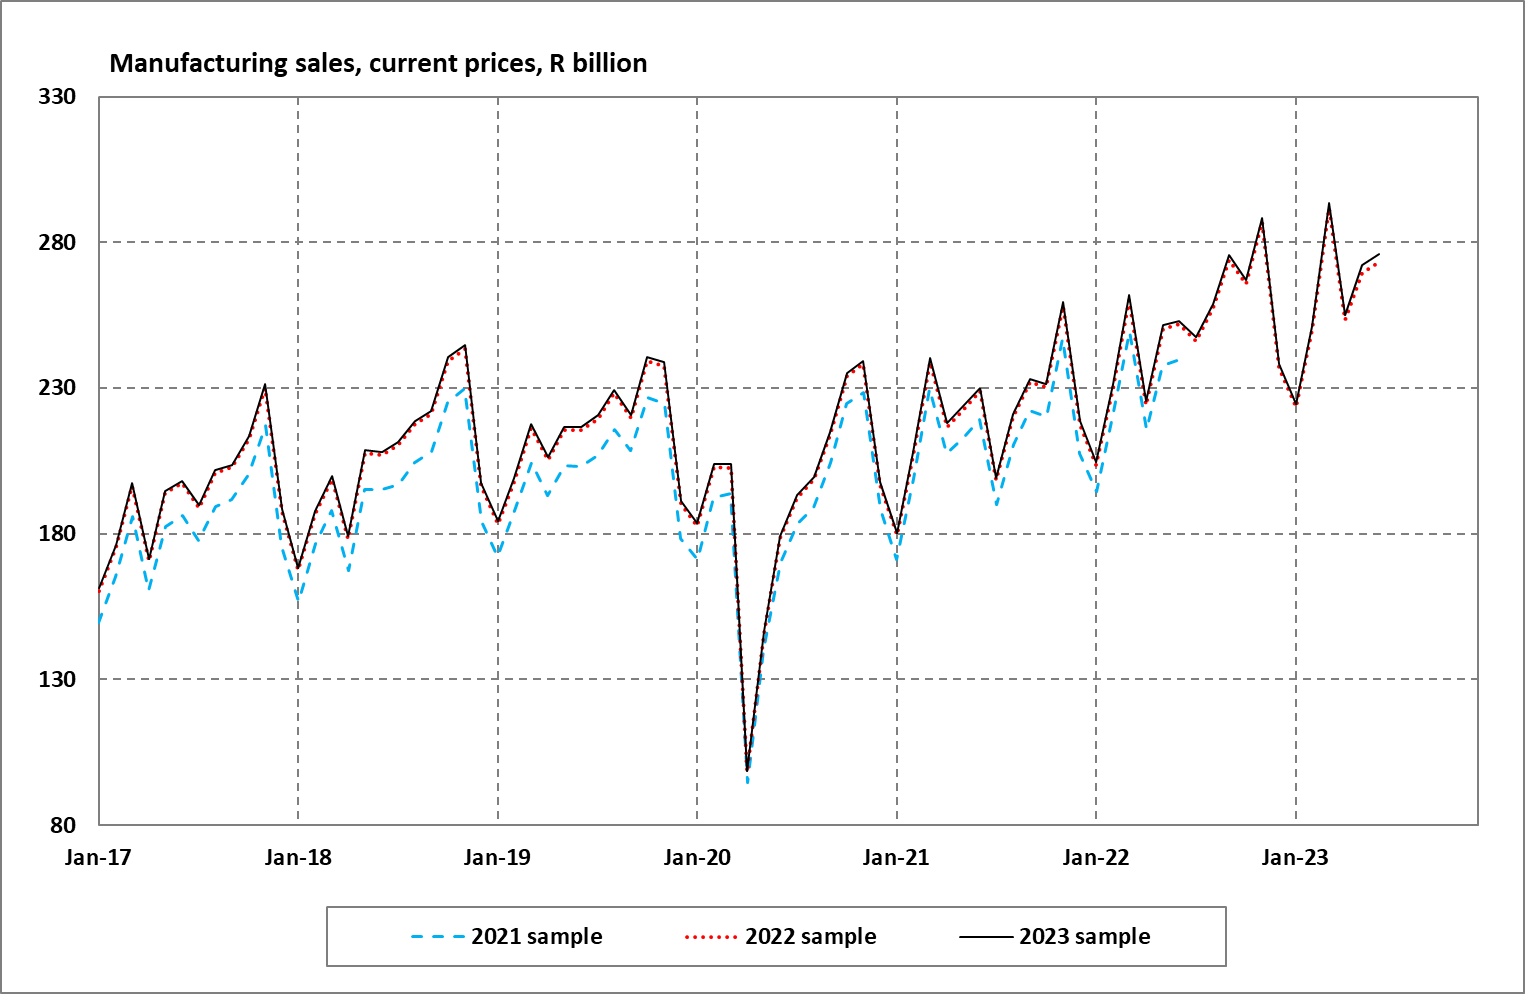
Figure 5 shows manufacturing sales based on the three different samples for 2021, 2022, and 2023. The 2023 sample lies above the 2022 sample, which lies above the 2021 sample.
The sharp upward spikes around October / November that we see each year are the seasonally high manufacturing sales ahead of the festive season. Figure 5 also shows the large economic impact of the COVID‑19 pandemic in April 2020.
Figure 5 – Manufacturing sales levels
In contrast to Figure 5, Figure 6 shows manufacturing sales that have been seasonally adjusted, i.e. the seasonality has been removed. In Figure 6 we no longer see the upward spikes around October / November (because these are seasonal effects), but the sharp downward spike in April 2020 remains. In addition, Figure 6 shows that the effect of linking the old sample to the new sample carries through to the seasonally adjusted series.
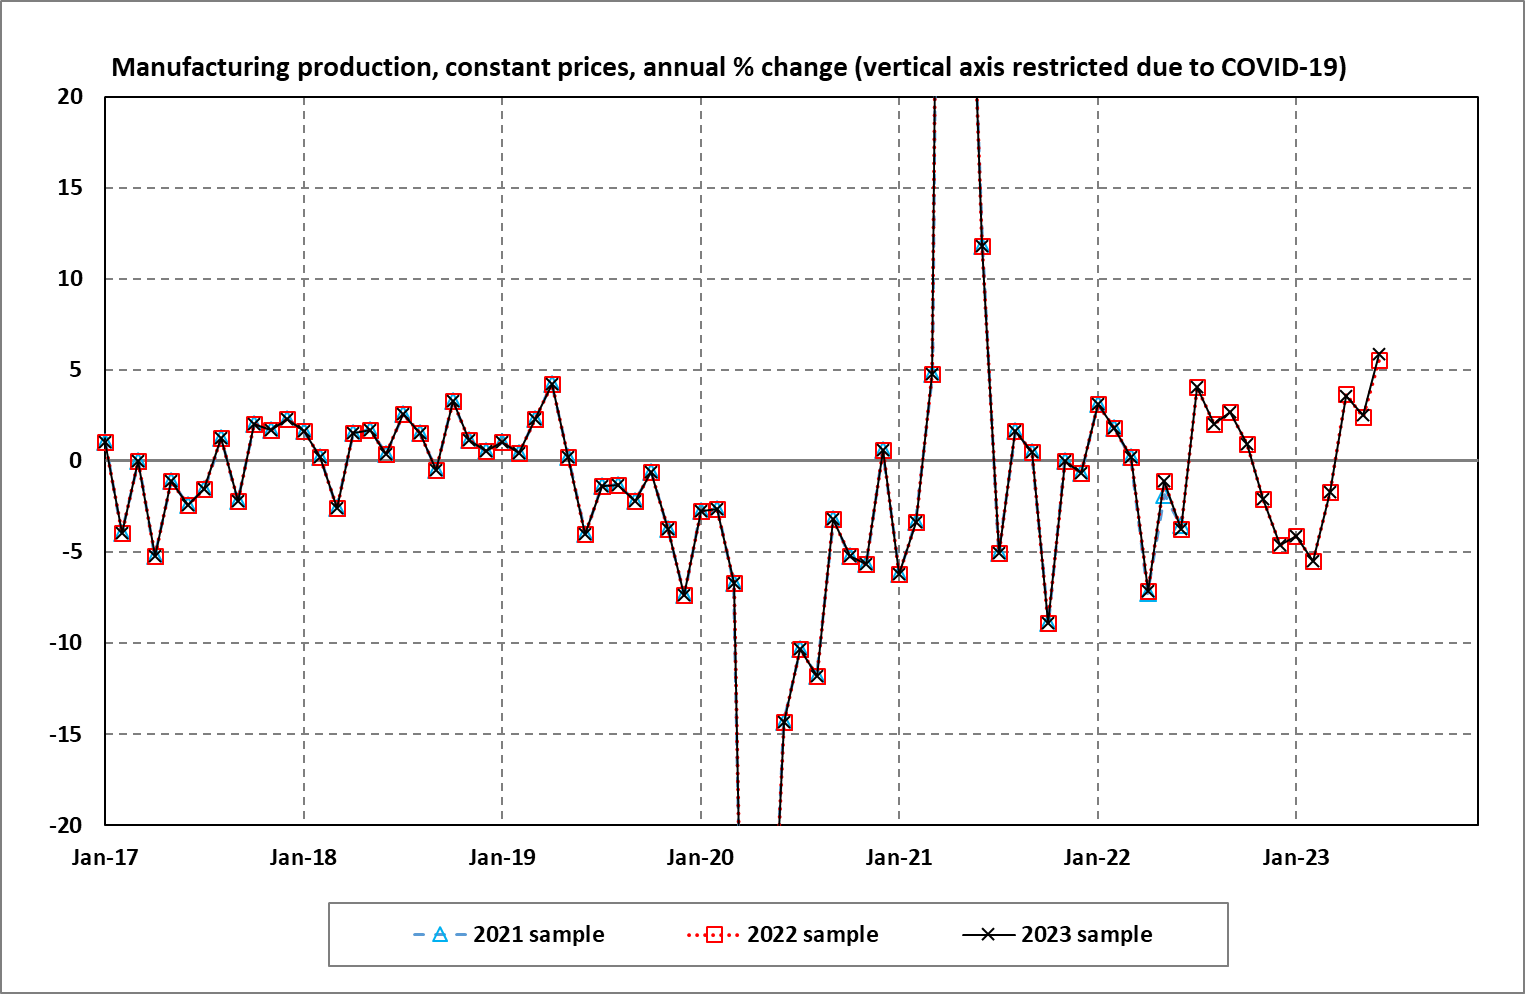
Figure 7 shows annual growth rates for manufacturing production, calculated from the manufacturing production index. Note that no linking is required for the production index when new samples are introduced, because although manufacturing sales are an important input for calculating production, the level of the production index is anchored at its base-year average of 100 in 2019.
Figure 6 – Manufacturing sales levels, seasonally adjusted
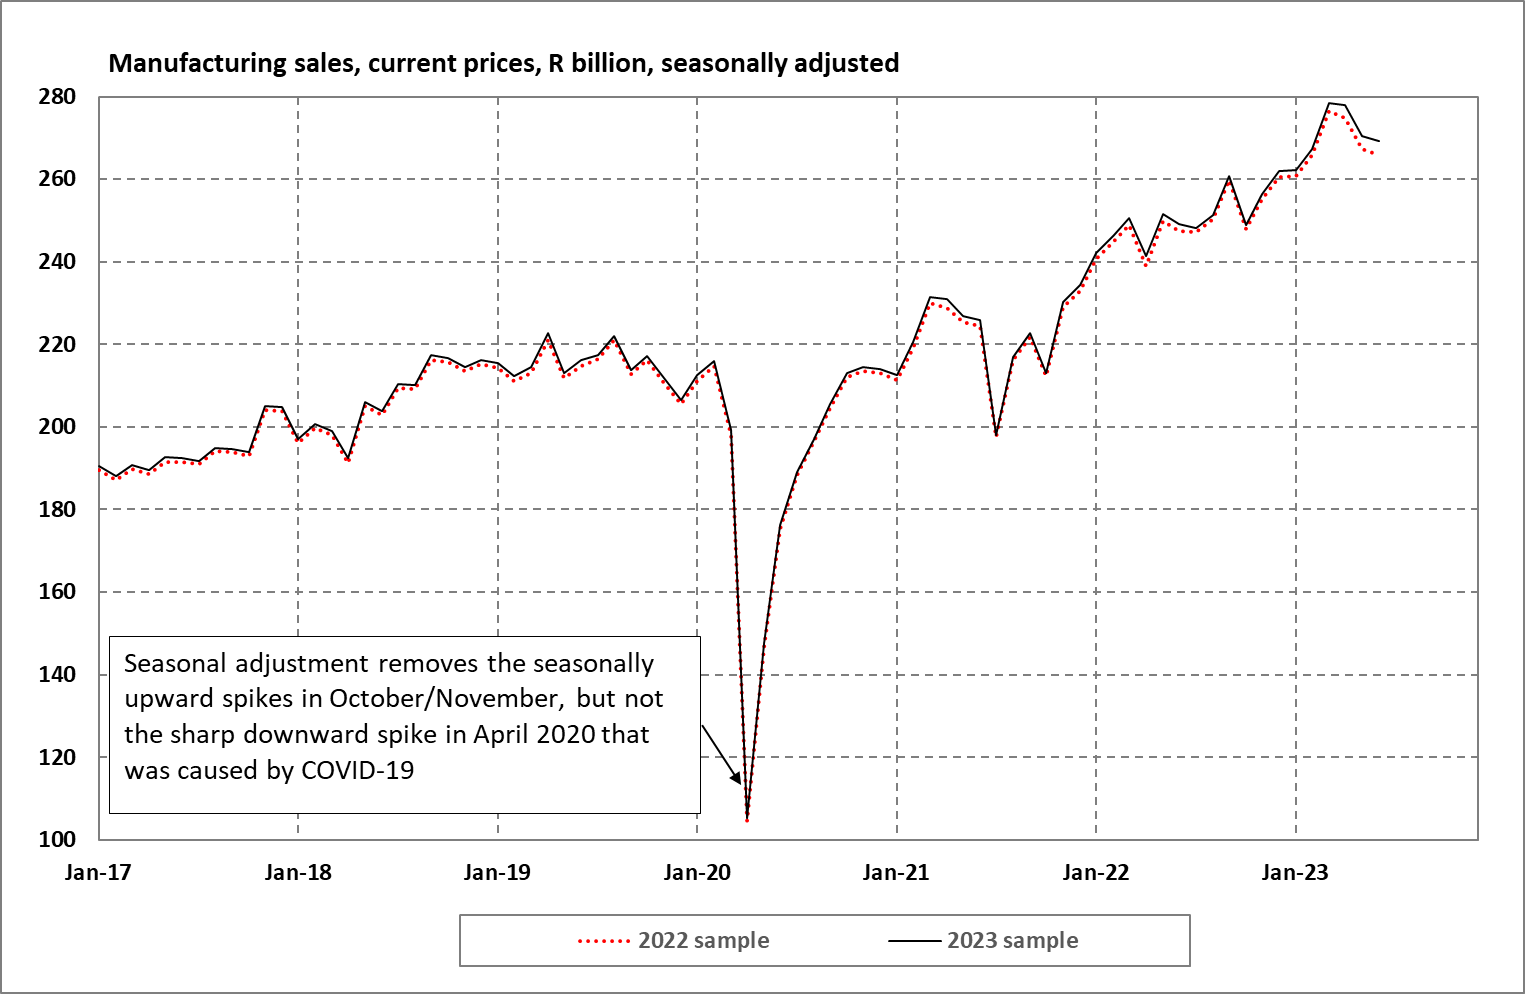
Figure 7 – Manufacturing production growth rates
Conclusion
The annual sample-refresh ensures that the results mirror the updated SBR, which in turn reflects changes observed in the taxation data from SARS. New samples typically result in changes in the levels of variables such as sales and income, which would distort growth rates if the estimates based on different samples are not linked. Stats SA runs parallel surveys to measure differences in levels caused by new samples, and uses this information to revise historical series such that the old series can be linked to the new series with no artificial breaks. This is important as it protects the integrity of the growth-rate time-series.
Similar articles are available on the Stats SA website and can be accessed here.
For a monthly overview of economic indicators and infographics, catch the latest edition of the Stats Biz newsletter here.