
Consumer inflation edges higher in August
After four consecutive months of decline, annual consumer inflation pushed up in August, rising to 4,8% from 4,7% in July. Inflation for food & non-alcoholic beverages (NAB) continued to cool, taking some of the heat off the headline rate. This was not enough, however, to counteract a rise in fuel prices and increases in municipal tariffs.
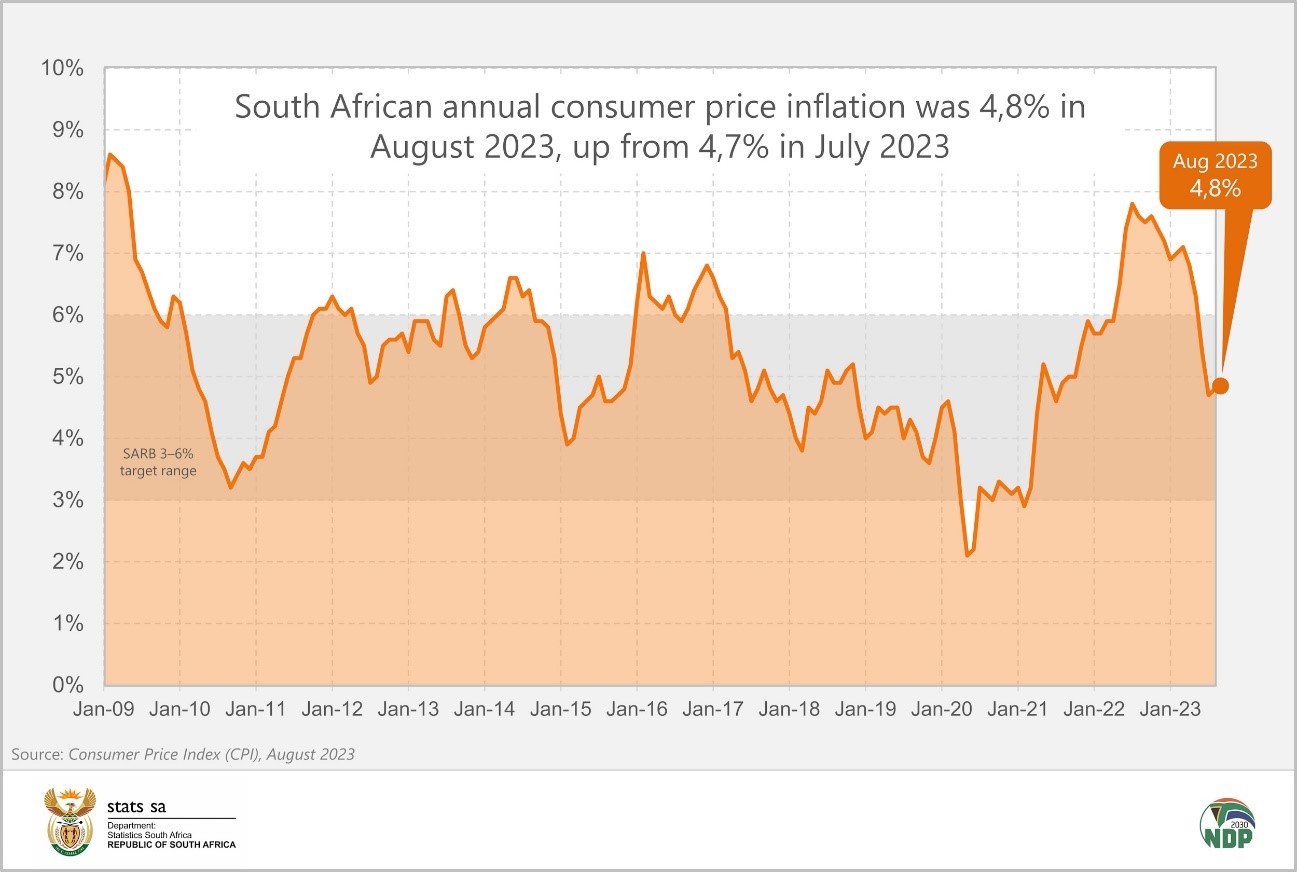
The monthly change in the consumer price index (CPI) was 0,3%, down from 0,9% in July. The housing & utilities and transport categories drove much of the 0,3% increase, each contributing 0,1 of a percentage point to the monthly rate.
Food inflation continues to taper off
Annual inflation for food & NAB declined for a fifth straight month, softening from 9,9% in July to 8,0% in August. Except for fruit, all food and NAB categories recorded lower annual rates in August.
The bread & cereals category registered an annual rate of 9,9%, lower than July’s reading of 13,1%. Several products were cheaper in August compared with July, including white bread, brown bread, maize meal and cereals. Rice put a damper on the party, however, with prices jumping by 3,4% month-on-month.
General meat inflation was softer too, with the annual rate declining to 3,6% from 5,1% in July. Prices for most beef and chicken products declined between July and August, with the exception of chicken giblets and beef extract. The price index for meat was 0,7% lower in August compared with July.
The milk, eggs & cheese category followed the same script. The annual rate eased from 14,4% in July to 11,9%. A number of products registered lower prices in August compared with July, including fresh full-cream milk, eggs and cheddar cheese. Favourite treats such as condensed milk and custard were sadly more expensive.
Sugar, sweets & desserts registered the highest annual inflation rate (18,5%) among all food & NAB categories. This was slightly cooler than July’s print of 18,7%. Jam and chocolate slabs were cheaper in August compared with July, while prices for brown sugar, white sugar and ice cream continued to rise.
Annual inflation for alcoholic beverages slowed to 6,9% from 7,8% in July. Beer prices subsided by 0,8% in August compared with July. For wine drinkers, prices declined by 0,3% over the same period.
Municipal rates for electricity, water and property
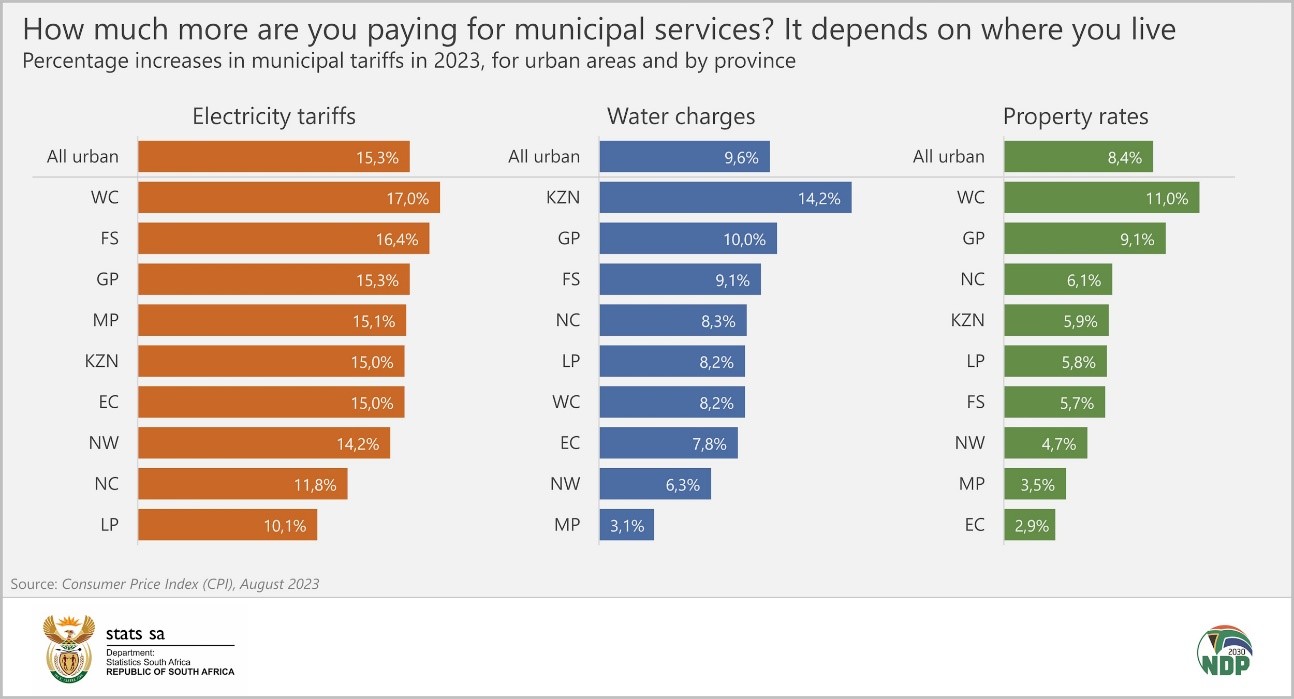
As mentioned in the July CPI overview,1 Stats SA surveys municipal rates in July and August. The August data concludes the 2023 survey. Electricity tariffs increased by 15,3% in 2023, much higher than the 7,9% rise recorded in 2022. Households paid 9,6% more for water in 2023 after bearing the brunt of an 8,1% rise the year before. Property rates were up by 8,4% following a 4,3% increase in 2022.
In 2023, Western Cape residents experienced the biggest increases in both electricity tariffs (up 17,0%) and property rates (up 11,0%). Residents in KwaZulu-Natal recorded the largest rise in water charges (up 14,2%), followed by Gauteng (up 10,0%).
Other notable price changes in August
Fuel prices increased by 2,2% between July and August, lifting the annual rate from -16,8% in July to -11,7%.
Restaurants & hotels recorded the second highest annual inflation rate (after food & NAB) in August. Restaurant inflation quickened to 6,7% from 6,5% in July. Prices for red meat-based products were up by 2,9% between July and August, resulting in an annual change of 9,8%. Hamburger prices increased by 1,2% between July and August, taking the annual rate to 6,6%.
Prices for hotel rooms increased by 5,9% in the 12 months to August. This is higher than the annual rate of 2,3% recorded in July.
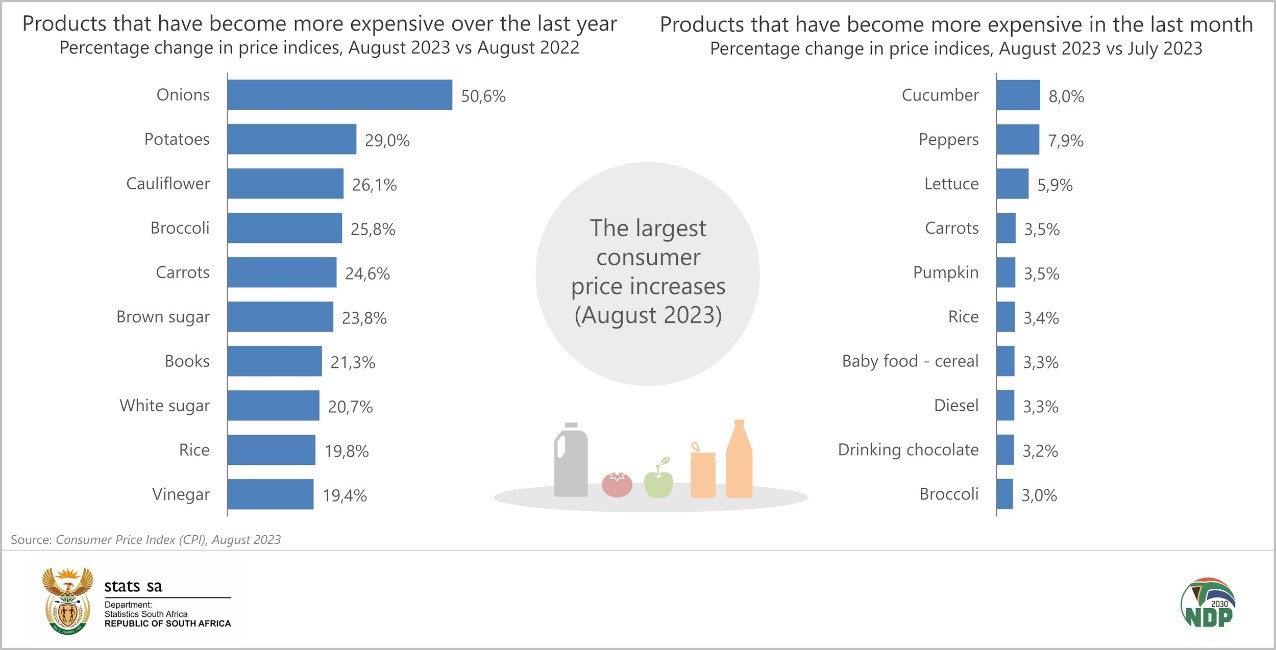
The graphs below show the products that recorded the biggest price increases in August.
For more information, download the August 2023 CPI statistical release and Excel files with indices and average prices here. The archive is available here.
1 Stats SA, Consumer inflation lowest in two years (read here).
Similar articles are available on the Stats SA website and can be accessed here.
For a monthly overview of economic indicators and infographics, catch the latest edition of the Stats Biz newsletter here.