
SA economy expands in Q2: 2023
South African real gross domestic product (GDP) expanded by 0,6% in the second quarter (April–June) of 2023.1 This follows a 0,4% rise in the first quarter.
Overview
Six industries on the supply side of the economy grew in the second quarter, with manufacturing and finance driving much of the upward momentum. On the demand side, the country benefitted from a sharp rise in investments in machinery and equipment, which included products related to renewable energy. Despite a decline in the overall household consumption, consumers continued to spend more on restaurants and hotels.
Manufacturing and finance help lift the supply side of the economy
Six of the ten industries recorded growth in the second quarter, with manufacturing and finance making the most significant positive impact (Figure 1).
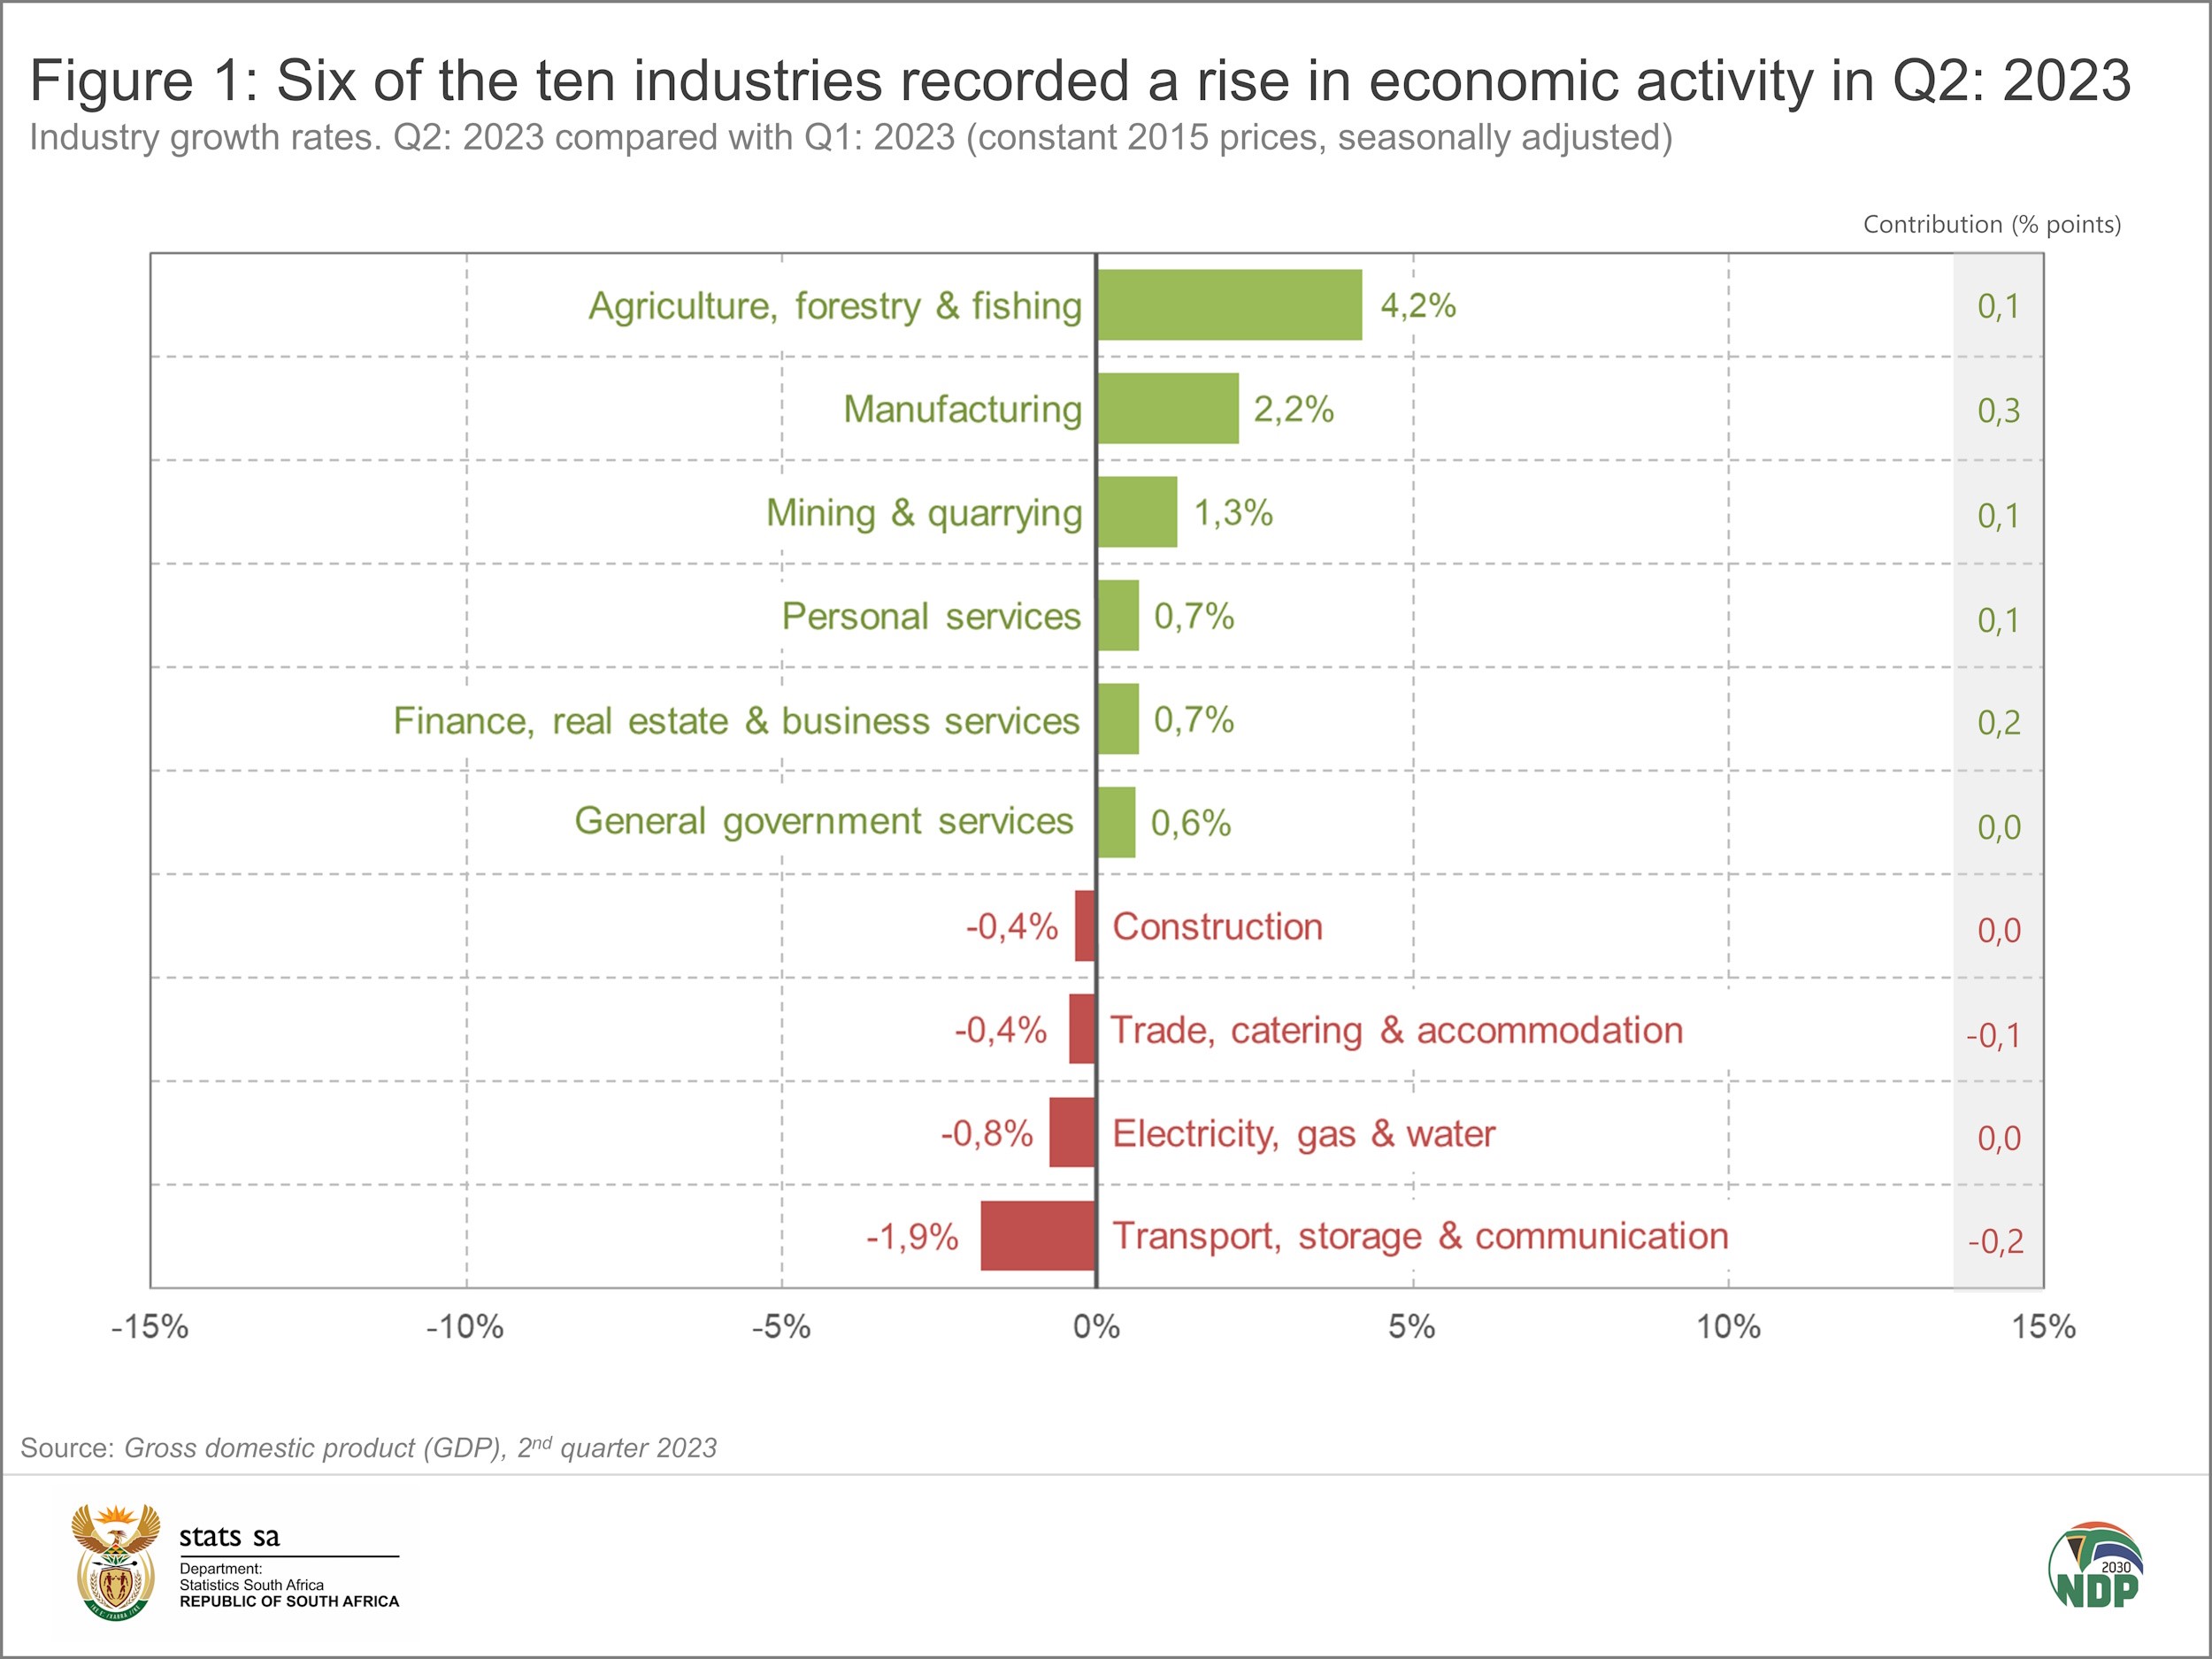
Manufacturing production expanded by 2,2%, mainly pushed higher by petroleum, chemical products, rubber & plastic products. Manufacturers in metals, metal products, machinery & equipment also recorded a good quarter, driven in part by increased demand for crude steel. Increased investment in South Africa’s automotive sector helped lift the production of transport equipment and motor vehicles.
The finance industry edged higher by 0,7%, boosted by financial intermediation, insurance and real estate services.
After two consecutive quarters of decline, South African agriculture turned positive. The 4,2% rise in output was driven by increases in the production of field crops and horticulture products. Favourable weather conditions, increased cultivation and a rise in export demand provided further support.
Mining looked good too, posting a second straight quarter of growth. Platinum group metals, gold, minerals classified in the category ‘other metallic minerals’ and coal helped lift the industry.
The personal services industry was positive on the back of higher growth in education and health.
The rise in general government services was mainly due to an increase in staff numbers.
Not all industries had a good second quarter. After 18 months of consistent growth, the transport, storage & communication industry stumbled, declining by 1,9%. Transport support services were lackluster and there were declines in land freight and road passenger transport.
The trade industry was down on the back of weaker retail and wholesale figures. The overall decline was partially offset by increased activities in the motor trade, tourist accommodation and restaurant, catering & fast-food sectors.
After holding its head above water for nine months, the construction industry lost steam in the second quarter. A decline in economic activity related to non-residential and residential buildings pulled the industry lower. There was a small uptick in construction works, but this was not enough to lift the industry into positive territory.
Investments in machinery and equipment help push up the demand side of the economy
Gross fixed capital formation dominated growth on the demand side of the economy (Figure 2). A sharp rise in investments in imported machinery and equipment – mostly for electricity infrastructure – drove gross fixed capital formation higher. This was supported by an increase in sales of locally produced electric motors, generators and special purpose machinery.
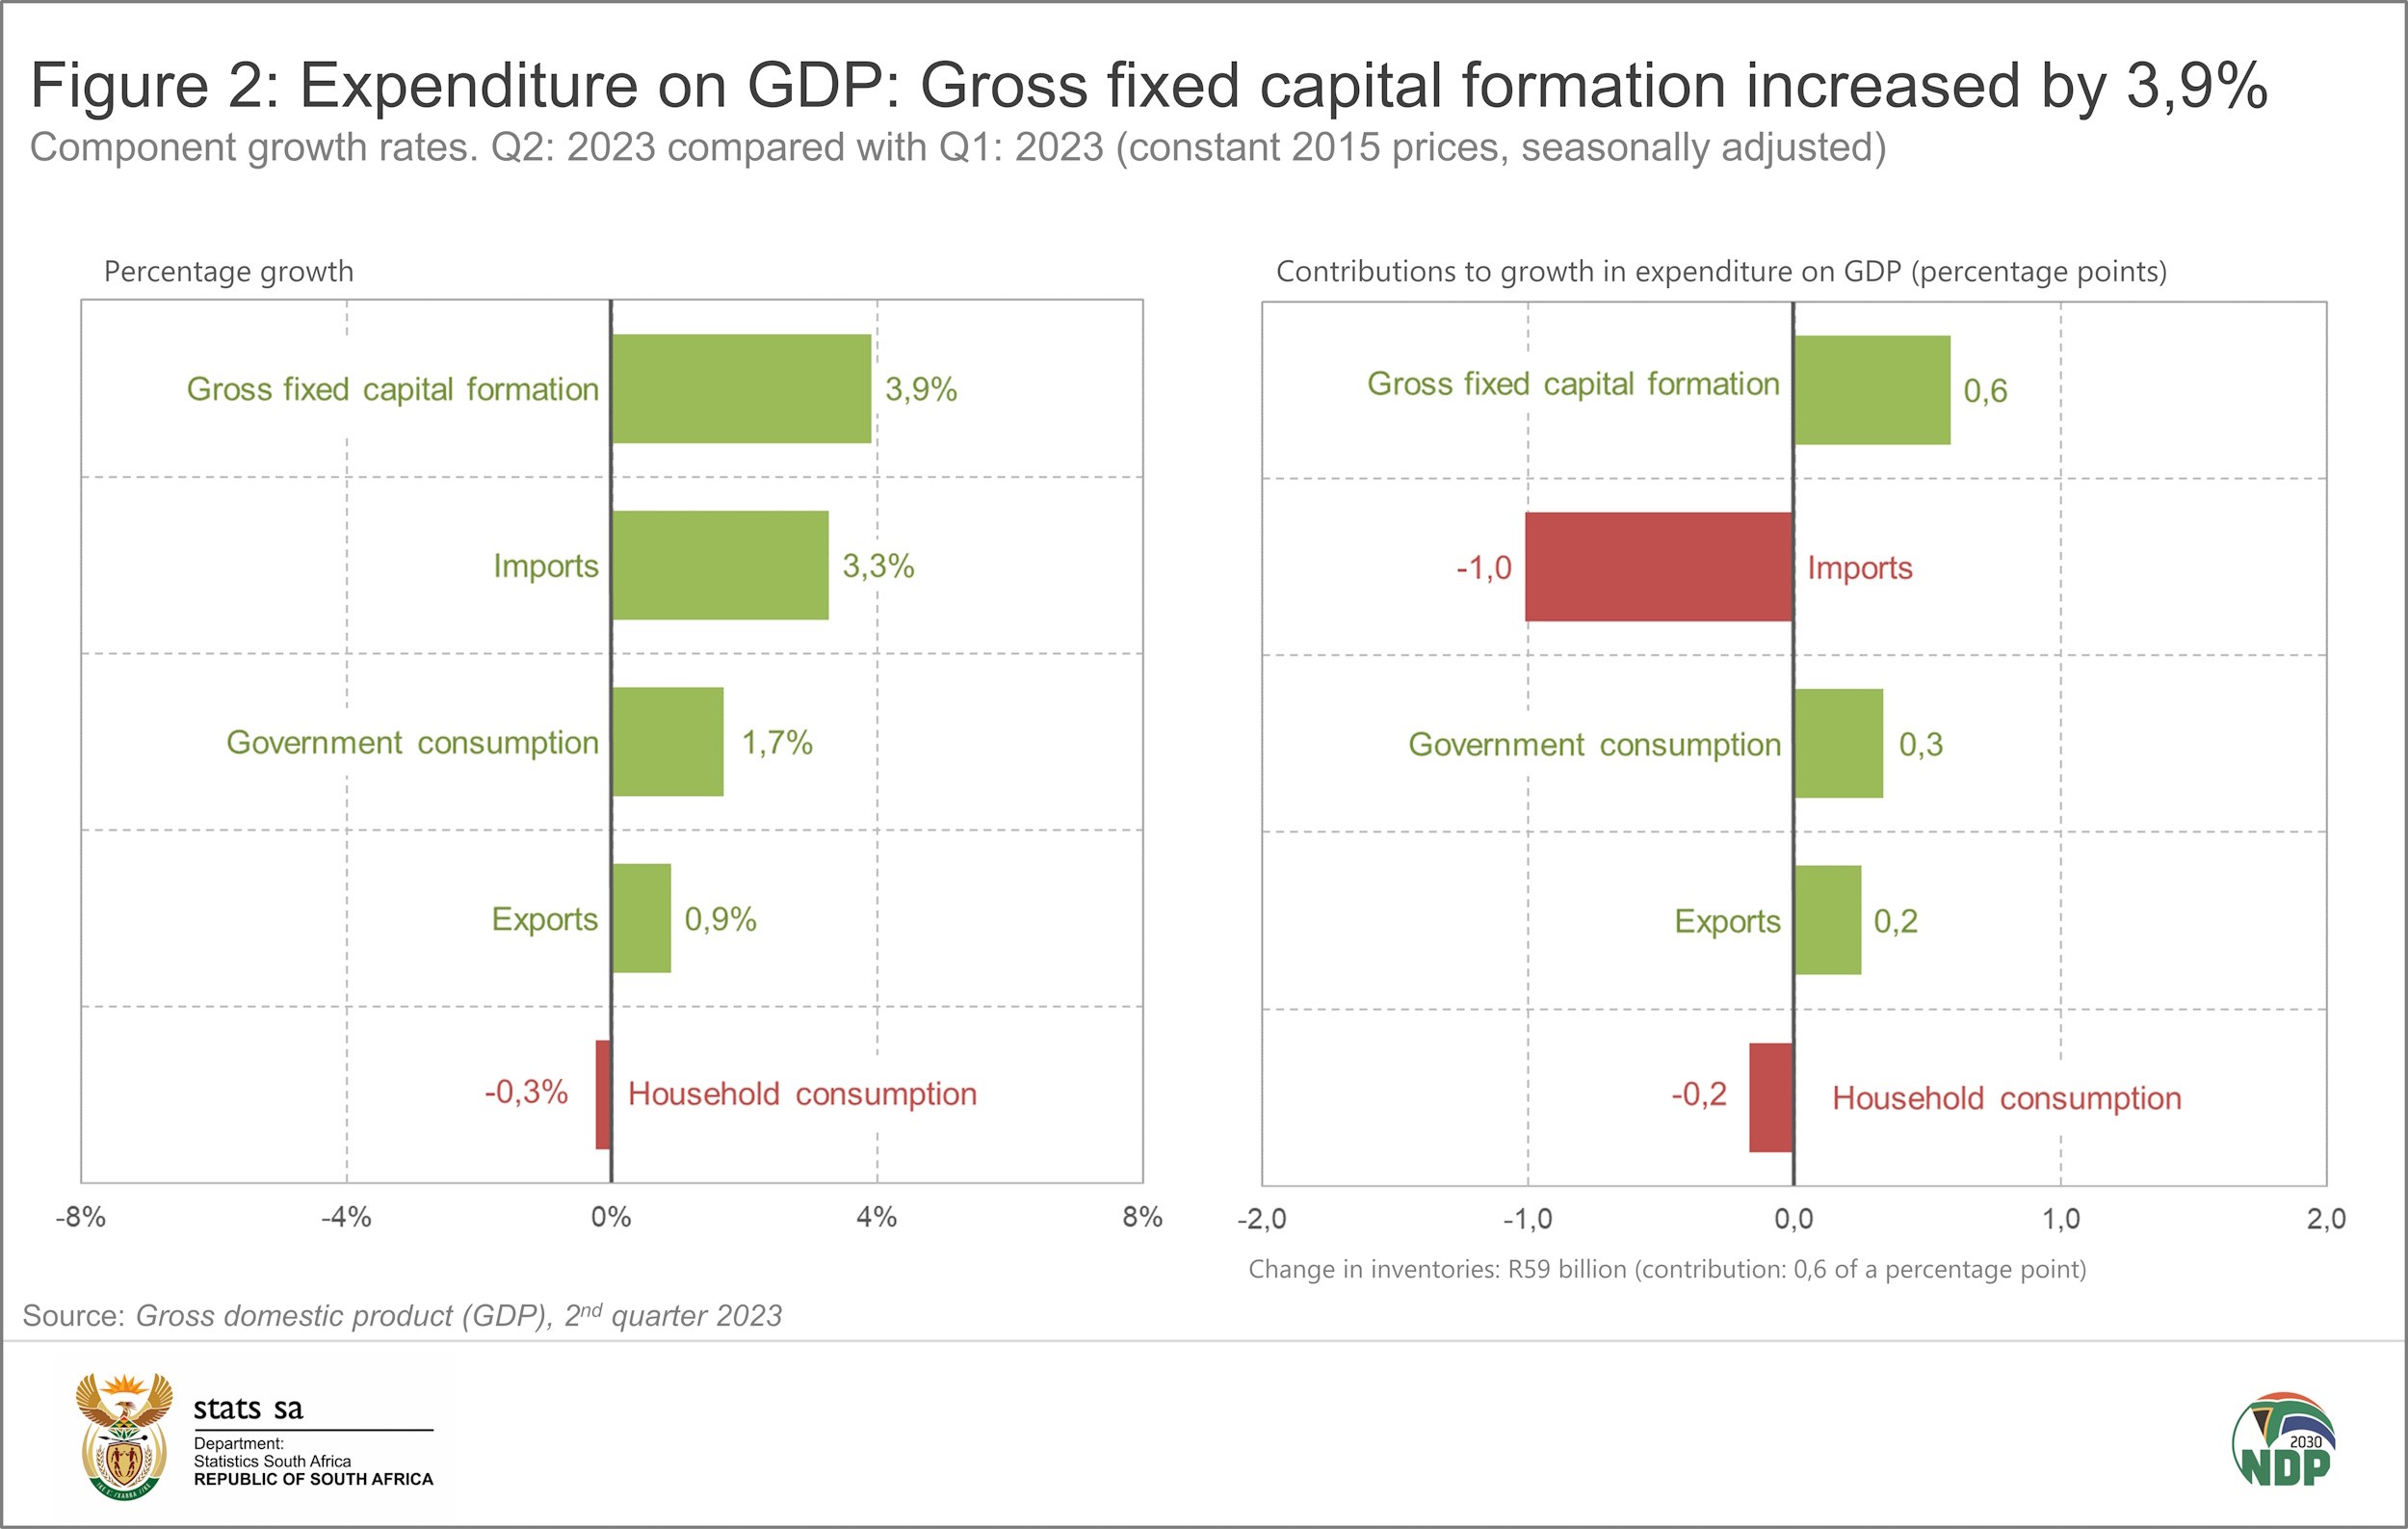
The demand for machinery and equipment contributed to the 3,3% rise in imports. Imported products included those related to renewable energy, batteries, vegetable products, artificial resins & plastics, base metals & articles of base metals, and animal & vegetable fats and oils.
South African exports edged higher by 0,9%, driven by increased trade in chemical products; prepared foodstuffs, beverages & tobacco; vehicles & transport equipment; mineral products and machinery & electrical equipment.
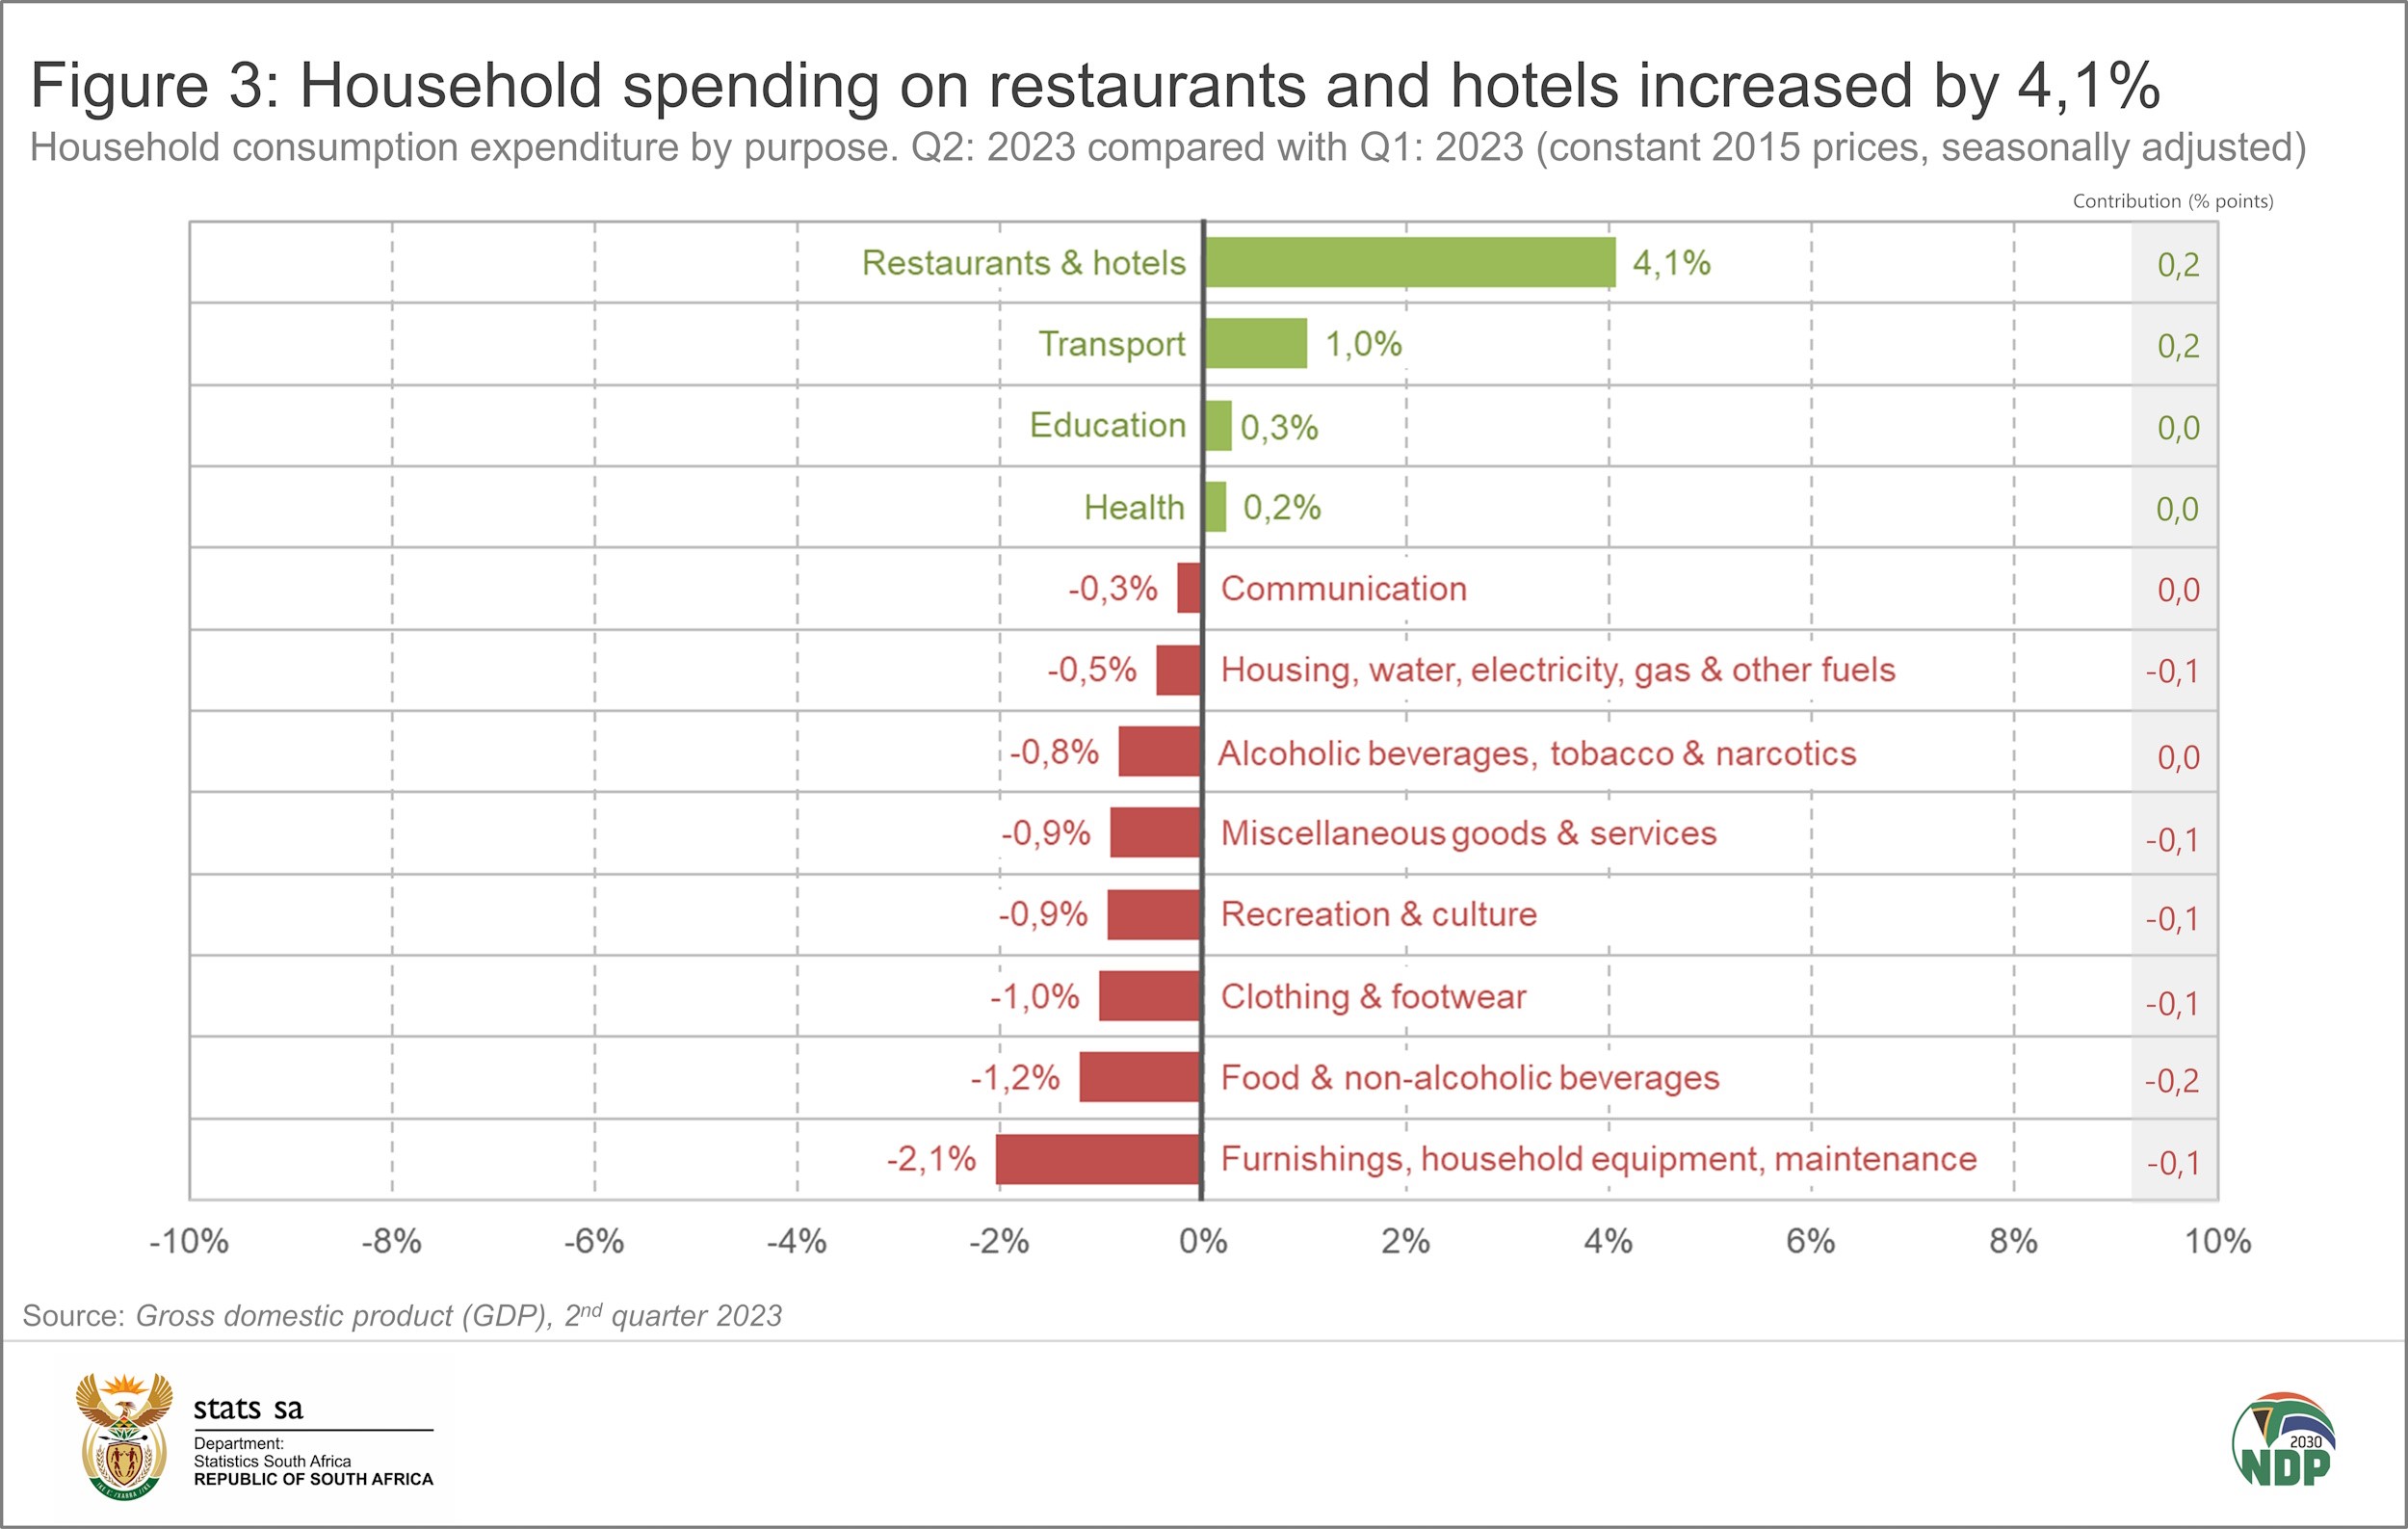
Household consumption decreased in the second quarter as consumers cut back on a variety of goods and services (Figure 3). Despite the overall decline, households continued to increase their spending on restaurants and hotels, representing a seventh consecutive quarter of growth for this category.
For more information, download the latest GDP release, media presentation and Excel files here.
1 The quarter-on-quarter rates are seasonally adjusted and in real (volume) terms (constant 2015 prices).
Similar articles are available on the Stats SA website and can be accessed here.
For a monthly overview of economic indicators and infographics, catch the latest edition of the Stats Biz newsletter here.