
Gender equality in local government: an update
As Women’s Month draws to a close, recent data provides a snapshot of gender representation in local government.
In 2021, South Africa’s municipal workforce numbered 282 286 individuals. Of these, 13 492 were senior-level posts, which include directors and managers.1 Women occupied 5 312 (or 39%) of these senior-level positions, according to Stats SA’s latest Non-financial census of municipalities report.
Many municipalities fall below the 50% mark of gender representation
Figure 1 expands on the data. Each bubble on the chart represents a municipality. The size of a bubble represents the total number of senior-level posts, which provides an indication of the size of the municipality.
The position of a municipality on the x-axis represents the percentage of senior-level posts that are occupied by women. What immediately stands out is that most municipalities fall to the left and therefore, fall short of the 50% target outlined in the Women Empowerment and Gender Equality Bill.2 This target was reaffirmed in 2020 by the Deputy Minister of Cooperative Governance and Traditional Affairs.3 Only 25 of the 257 municipalities met or exceeded the target in 2021.
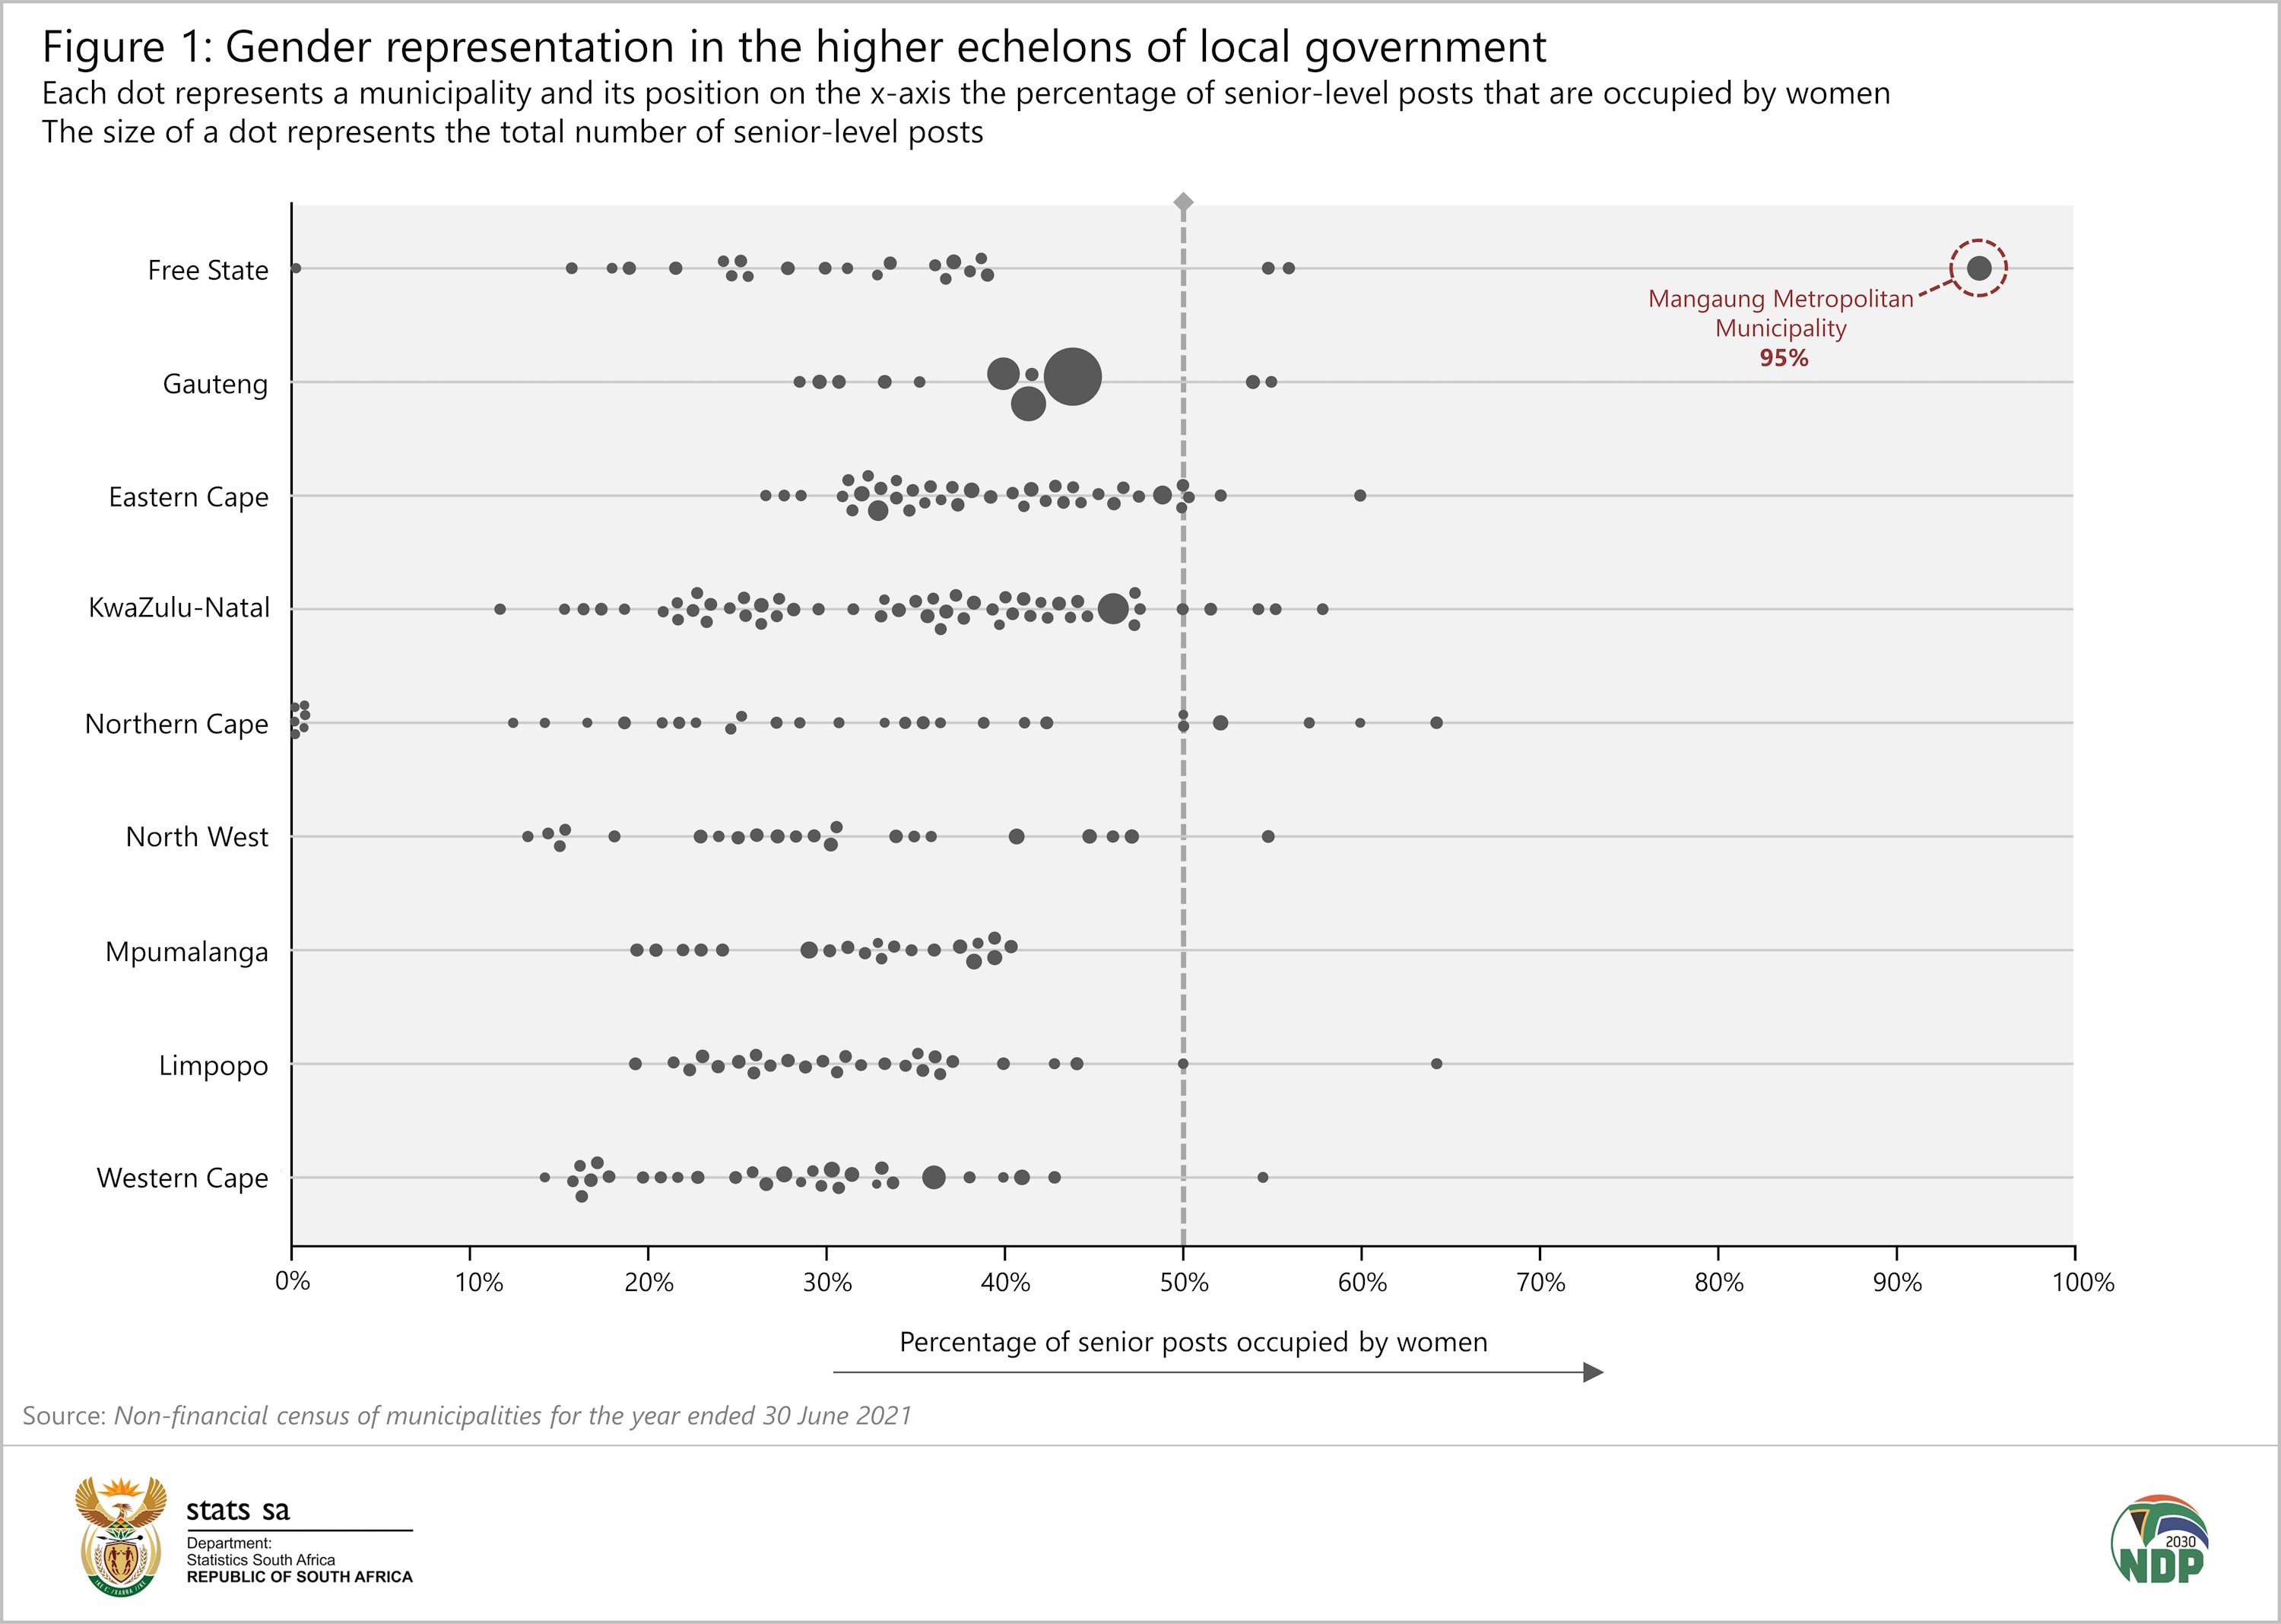
Figure 1 shows Mangaung Metropolitan Municipality in the Free State recording the highest percentage across local government, with women occupying 341 (or 95%) of 360 senior-level posts. Other municipalities with high percentages include Molemole Local Municipality (64%) in Limpopo, Joe Morolong Local Municipality (64%) in Northern Cape, Richtersveld Local Municipality (60%) in the Northern Cape and Ntabankulu Local Municipality (60%) in Eastern Cape.
On the other end of the scale, seven municipalities had no women in senior-level positions, with six located in the Northern Cape. What should be noted about these municipalities is that they have relatively small management teams. For example, Siyathemba Local Municipality had two senior-level posts in 2021, both occupied by men. Kareeberg Local Municipality is another example, with males occupying all three management posts.
On aggregate, representation was lowest across municipalities in Western Cape (30%), Limpopo (31%) and Mpumalanga (32%). The province with the highest level of gender representation in 2021 was Free State (57%), mainly the result of the high reading recorded by Mangaung Metropolitan Municipality. Gauteng registered the second highest level of representation (42%), followed by Eastern Cape (40%).
Although local government management representation as a whole has not yet reached the 50/50 target, it fares better than the general labour force. Women occupied 32% of managerial posts across the South African labour force in 2021.4 This is lower than local government’s reading of 39%.
Change over the years
The boundaries for the current municipal structure, consisting of 257 municipalities, were adopted during the 2016 local government elections and reported on for the first time in the Non-financial census of municipalities report for 2017. This allows for meaningful comparisons over the period 2017–2021. In 2017, women occupied 36% of senior-level posts across local government, rising to 39% in 2021.
For more information, download the 2021 Non-financial census of municipalities report here.
1 The analysis in this article excludes councillors and mayors.
2 Women Empowerment and Gender Equality Bill, B50–2013 (download here).
3 SAnews, More women representation needed in local government (read here).
4 Stats SA, Labour Market Dynamics in South Africa, 2021. Table 4.6 (download here).
Similar articles are available on the Stats SA website and can be accessed here.
For a monthly overview of economic indicators and infographics, catch the latest edition of the Stats Biz newsletter here.