
Economic wrap-up for July 2023
If you’ve missed any recent economic data from Stats SA, we’ve got you covered. Here is a quick rundown of what you need to know.
These cities rule our manufacturing industry
It’s not often that industry data are published for districts. Detailed spatial data require large surveys with large samples, which can be expensive. That is why the high level of detail covered by two recent manufacturing reports is a one-in-four-year occurrence. The reports provide insight into the spread of manufacturing across the country in terms of employment, finances and production.
Selected variables are available on a district level. These show that activity is highly concentrated in four cities. The City of Ekurhuleni, the City of Johannesburg, the City of Cape Town and eThekwini account for a hefty share – just over half – of South African manufacturing sales. Collectively, they also accommodate almost 60% of the national manufacturing workforce.
The City of Tshwane might be home to the best rugby team, but it ranks fifth in both manufacturing employment and sales of goods & services.
Monthly indicators: Mining and retail retreat while manufacturing moves forward
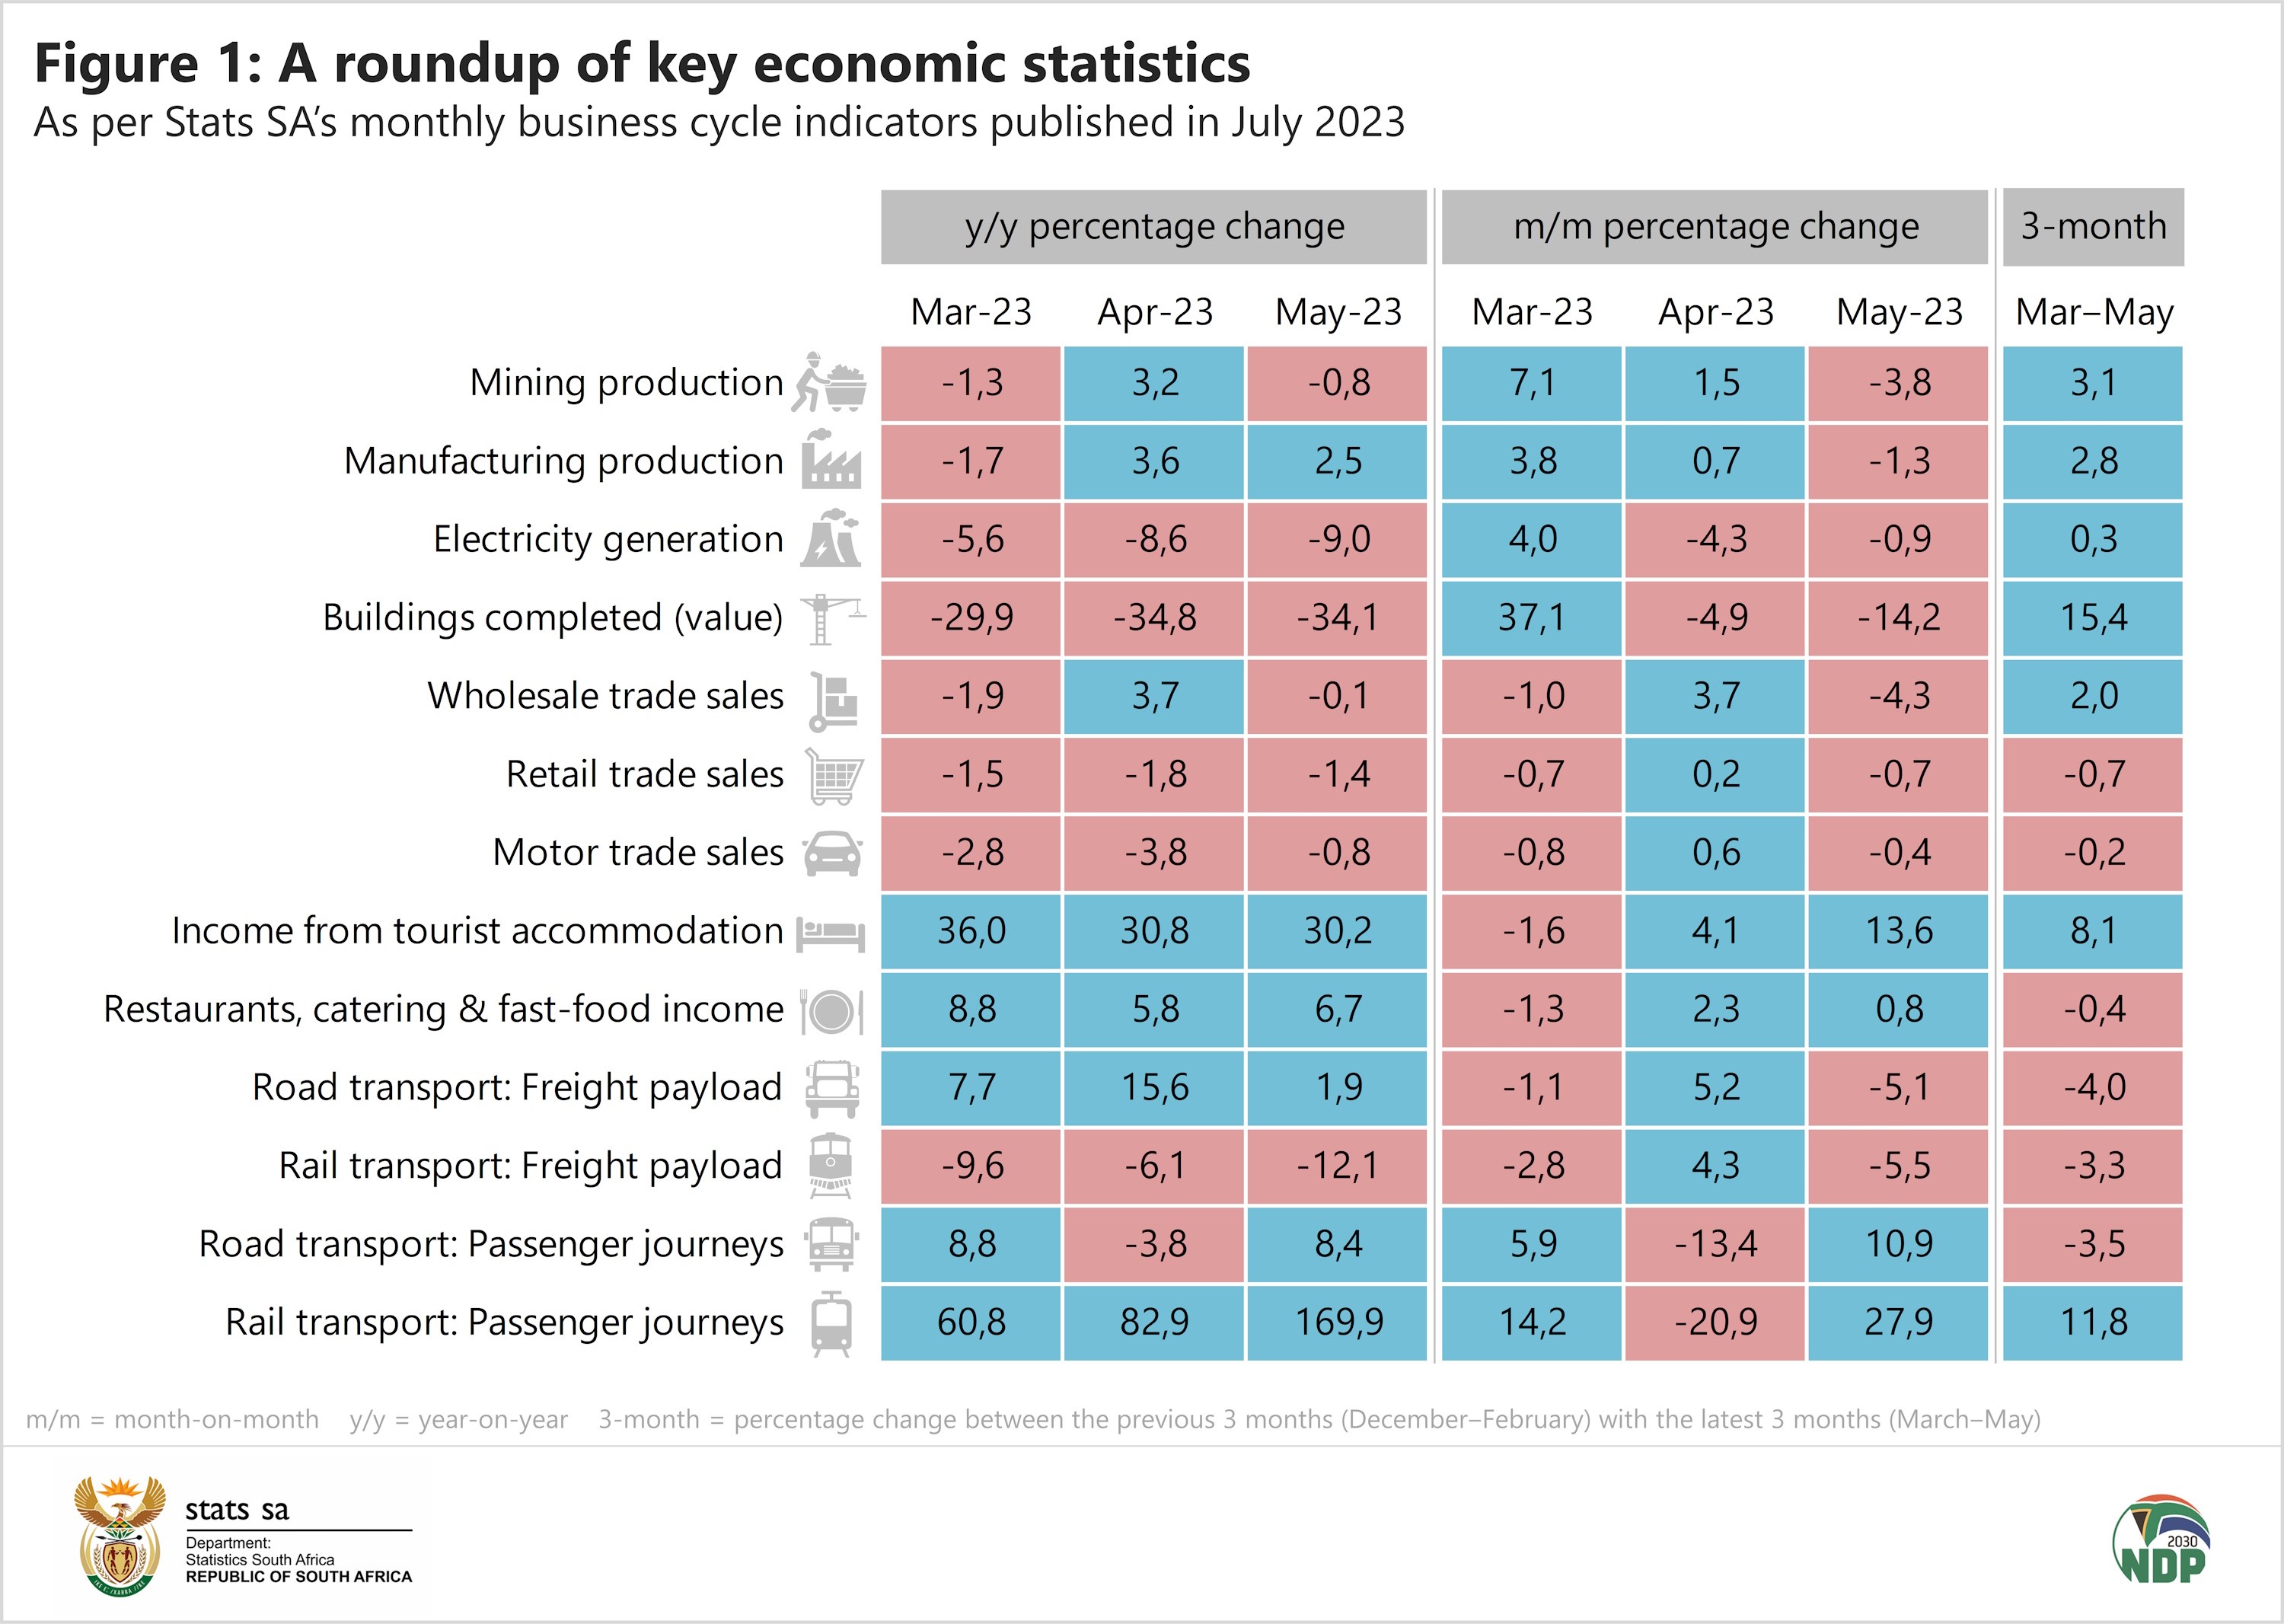
Turning to the monthly manufacturing release, national manufacturing production recorded its second successive month of positive year-on-year growth, expanding by 2,5% in May. Eight of the ten manufacturing divisions recorded a rise in output, led by the automotive division that saw a notable increase in the production of parts and accessories.
On the mining front, production eased by 0,8% year-on-year in May. Platinum group metals and diamonds were the biggest factors behind the decline. Gold, however, continued to shine on the upside, recording a fifth consecutive month of positive year-on-year growth.
South African retail trade sales shrank for a sixth consecutive month, declining by 1,4% year-on-year in May. Five of the seven retailer groups were weaker, with general dealers and hardware stores driving much of the downward momentum. Bucking the trend, textiles & clothing continued its positive run, registering a 12th consecutive month of year-on-year growth.
Figure 1 provides a summary of the latest set of monthly indicators.
Inflation continues to lose steam
Inflation continued on a downward trend in June, much to the relief of burdened consumers. Annual consumer inflation cooled to its lowest reading in 20 months, mainly the result of softer fuel prices and lower price increases for food. June’s print is significant ‒ it’s the first time since April 2022 that consumer inflation is below the 6% upper limit of the South African Reserve Bank’s monetary policy target range.
Inflation at the factory gate also continued to ease, with the annual rate slowing to 4,8% in June from 7,3% in May. June’s reading is the lowest since February 2021 when the rate was 4,0%.
What to look forward to in August
There are several notable statistical releases to look out for this month. The latest Quarterly Labour Force Survey (QLFS) is due for release on 15 August. This will provide employment and unemployment data for the second quarter of 2023. The release will be published here.
The last week of the month will see the release of two reports related to government. The first, the Non-financial census of municipalities, will unveil data on municipal services, bucket toilets, indigent households and local government employment. This will be published on 31 August and will be available here.
The second report, published on the same day, will cover financial data on extra-budgetary accounts and funds (EBAs). The 256 EBAs form an important arm of government that provides services for government or to the public on behalf of government. Examples include the South African Revenue Service and the Unemployment Insurance Fund. The report will be published here.
To keep up to date with other upcoming releases, see our publication schedule. For a comprehensive list of products and releases from Stats SA, download our catalogue.
For a monthly overview of economic indicators and infographics, catch the latest edition of the Stats Biz newsletter here.
Similar articles are available on the Stats SA website and can be accessed here.