
Falling inside the norm: Municipal remuneration and contractor spending
A wide range of indicators inform municipal financial health. In 2014, National Treasury published a uniform set of financial norms and ratios for local government.1 Stats SA recently published data that can be used to inform these norms. In the examples below, we explore how municipalities fare in terms of remuneration and contracted services.
Paying municipal employees and councillors
Total municipal expenditure was R472 billion2 in the 2022 municipal financial year, with remuneration costs accounting for R132 billion, or 28% of the total.3 The aggregate proportion of 28% falls within the National Treasury norm of 25%‒40%. However, a more nuanced picture emerges if we map all 257 municipalities individually.
Each dot in Figure 1 represents a municipality. The location of each municipality on the x-axis represents its share of remuneration costs to its expenditure. West Rand District Municipality appears on the far right, recording the highest proportion. Its remuneration costs accounted for 78% of its expenditure. Rustenburg Local Municipality in North West registered the lowest reading at 12% (click on the image to enlarge).
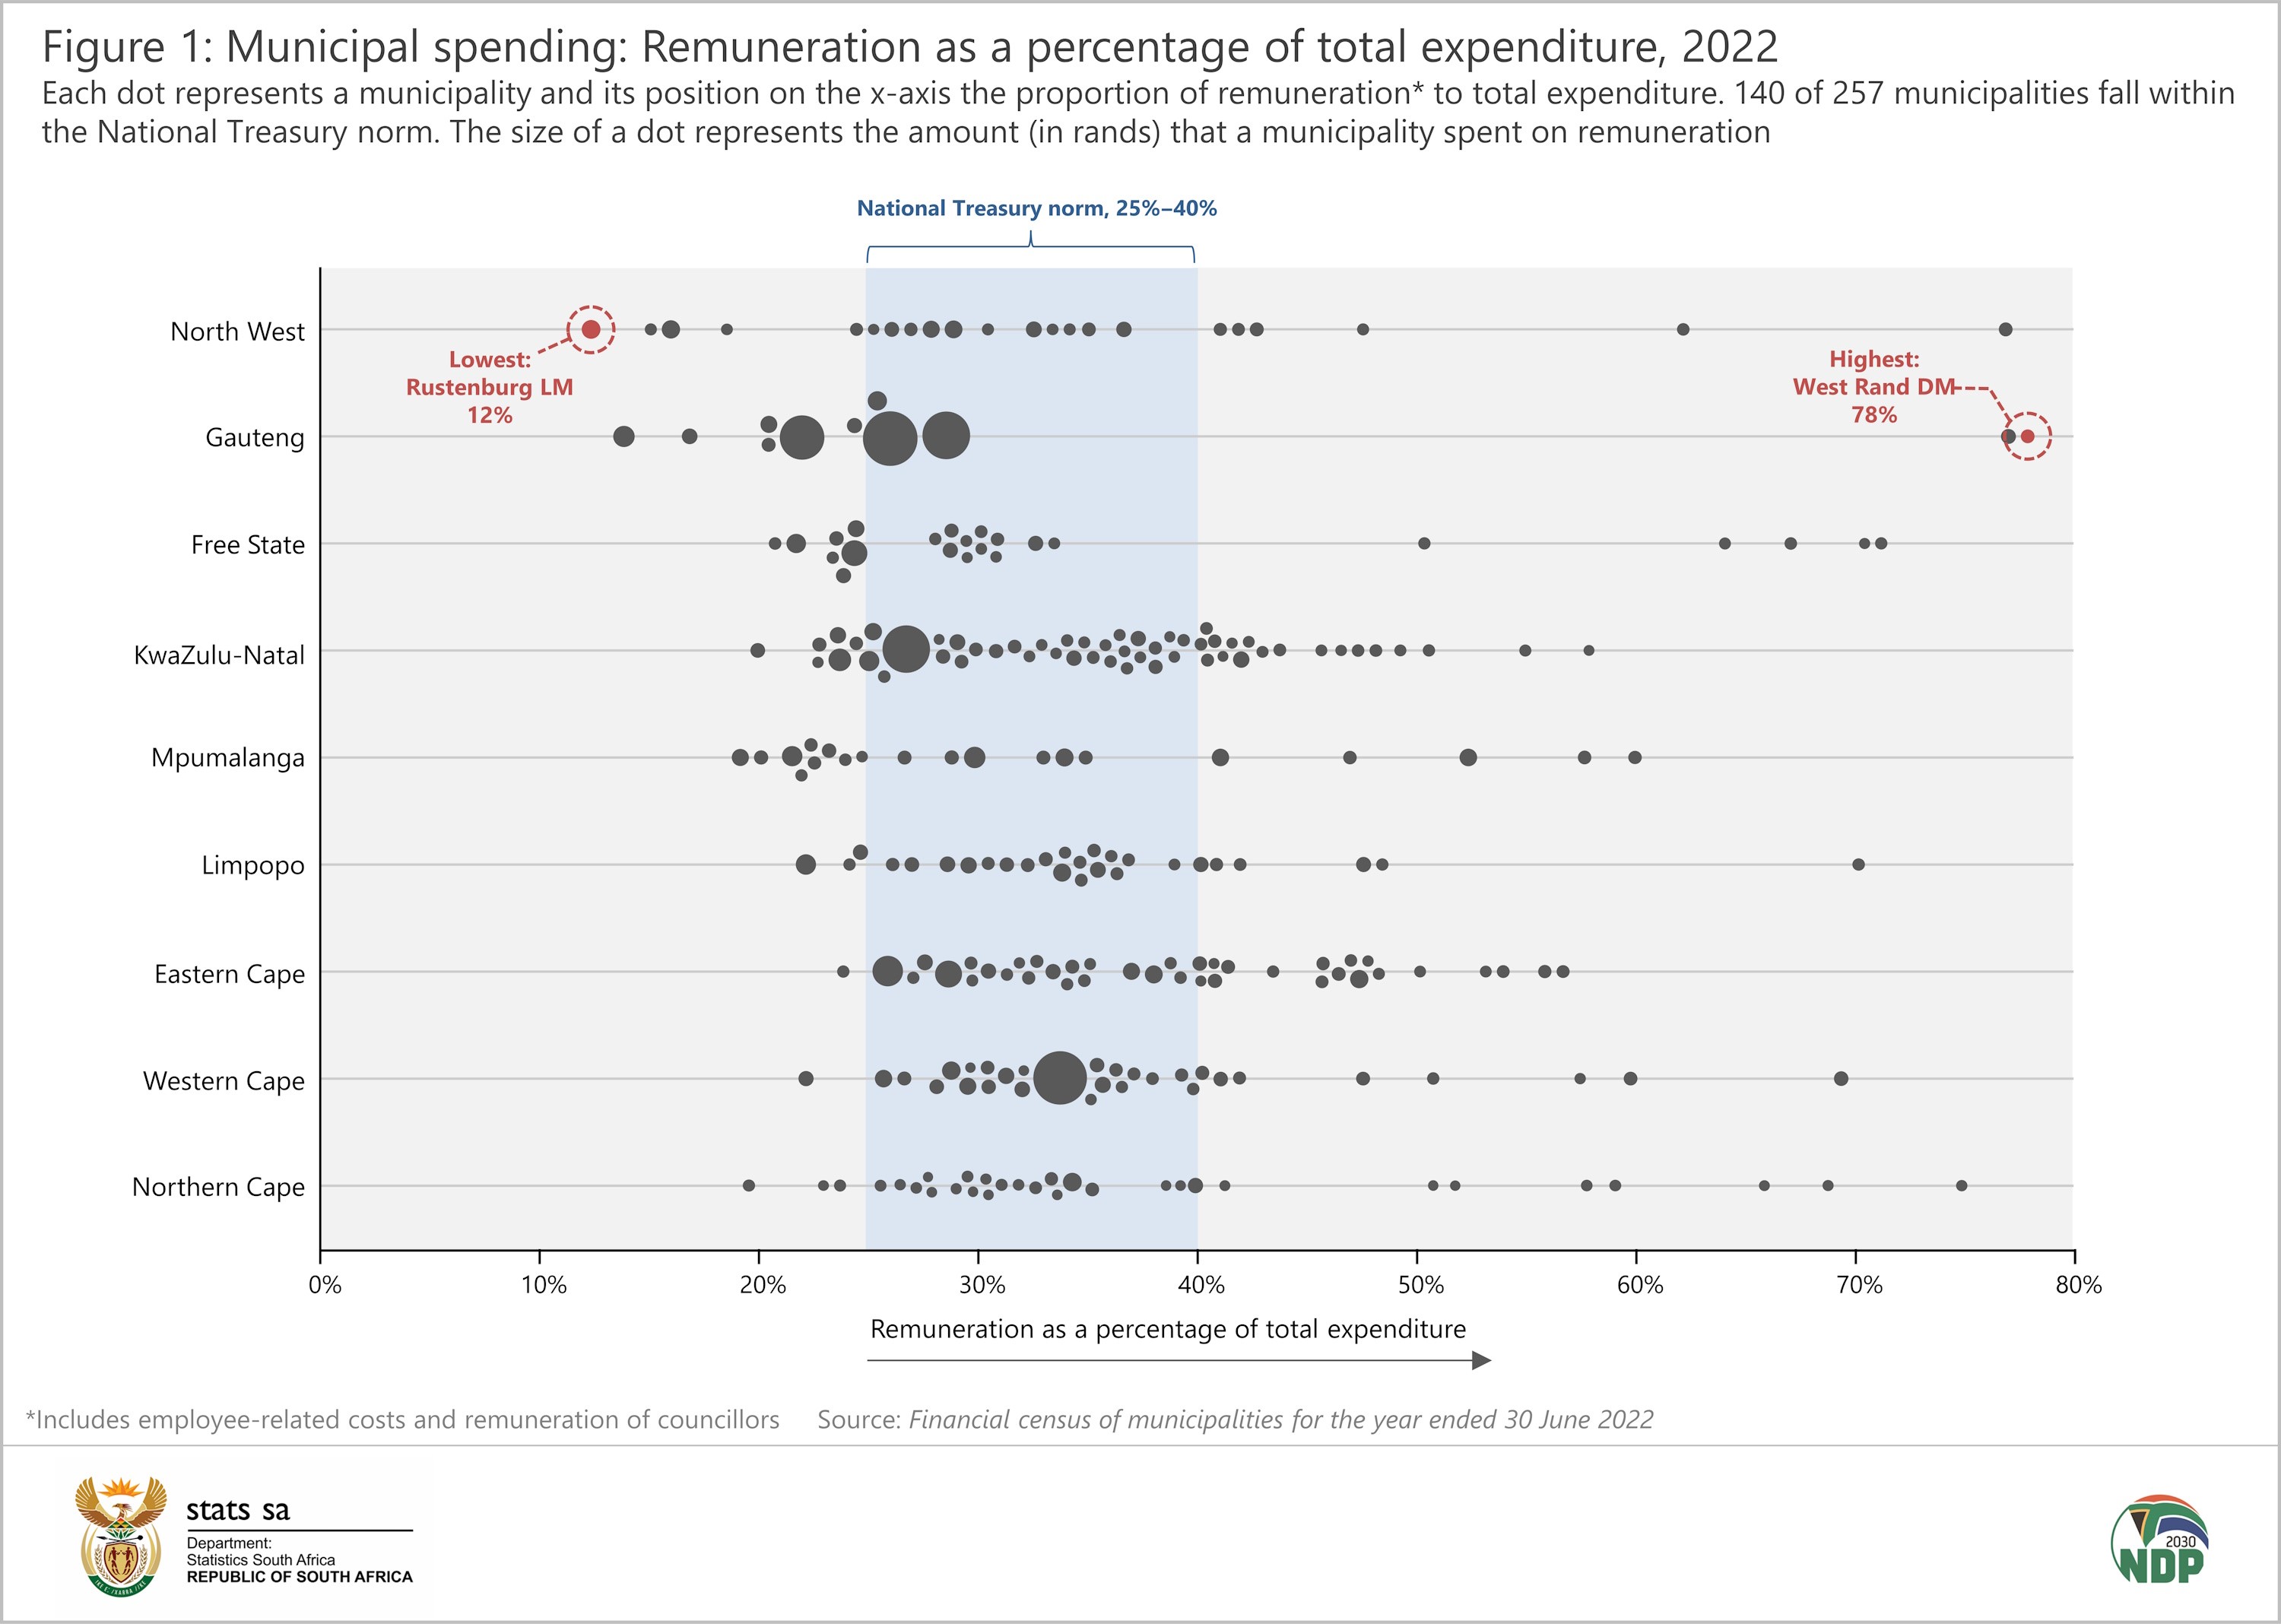
According to National Treasury, when this ratio exceeds the specified norm, it may indicate excessive staffing, inefficiencies or a misallocation of funds. However, National Treasury also advises to keep in mind the powers and functions of the municipality when evaluating this ratio. District municipalities, for example, perform an administrative role and are typically not directly involved in service delivery (except for a few that have taken on the role as water service authorities and water service providers). Significant expenditure items such as water and electricity purchases are usually not included in their budgets. As a result, the share of remuneration costs to total expenditure for many districts tends to be higher compared with their local and metropolitan counterparts.
Keeping this in mind, just over half (140) of municipalities fall within the National Treasury norm. Western Cape recorded the largest share of municipalities (21 of 30) that complied.
Paying contracted services
Municipalities often outsource work to consultants, professional services, and private contractors. Local government spent R39 billion on contracted services in the 2022 financial year, accounting for 8,4% of total expenditure. This is above the National Treasury norm of 2%‒5%.
Four municipalities spent no money (or 0% of total expenditure) on contracted services. On the other end of the scale, contracted services accounted for almost half of total expenditure in Dr Ruth Segomotsi Mompati District Municipality (Figure 2). Nationally, 52 of the country’s 257 municipalities were in alignment with the norm. Free State registered the largest share of municipalities (13 of 23) that complied.
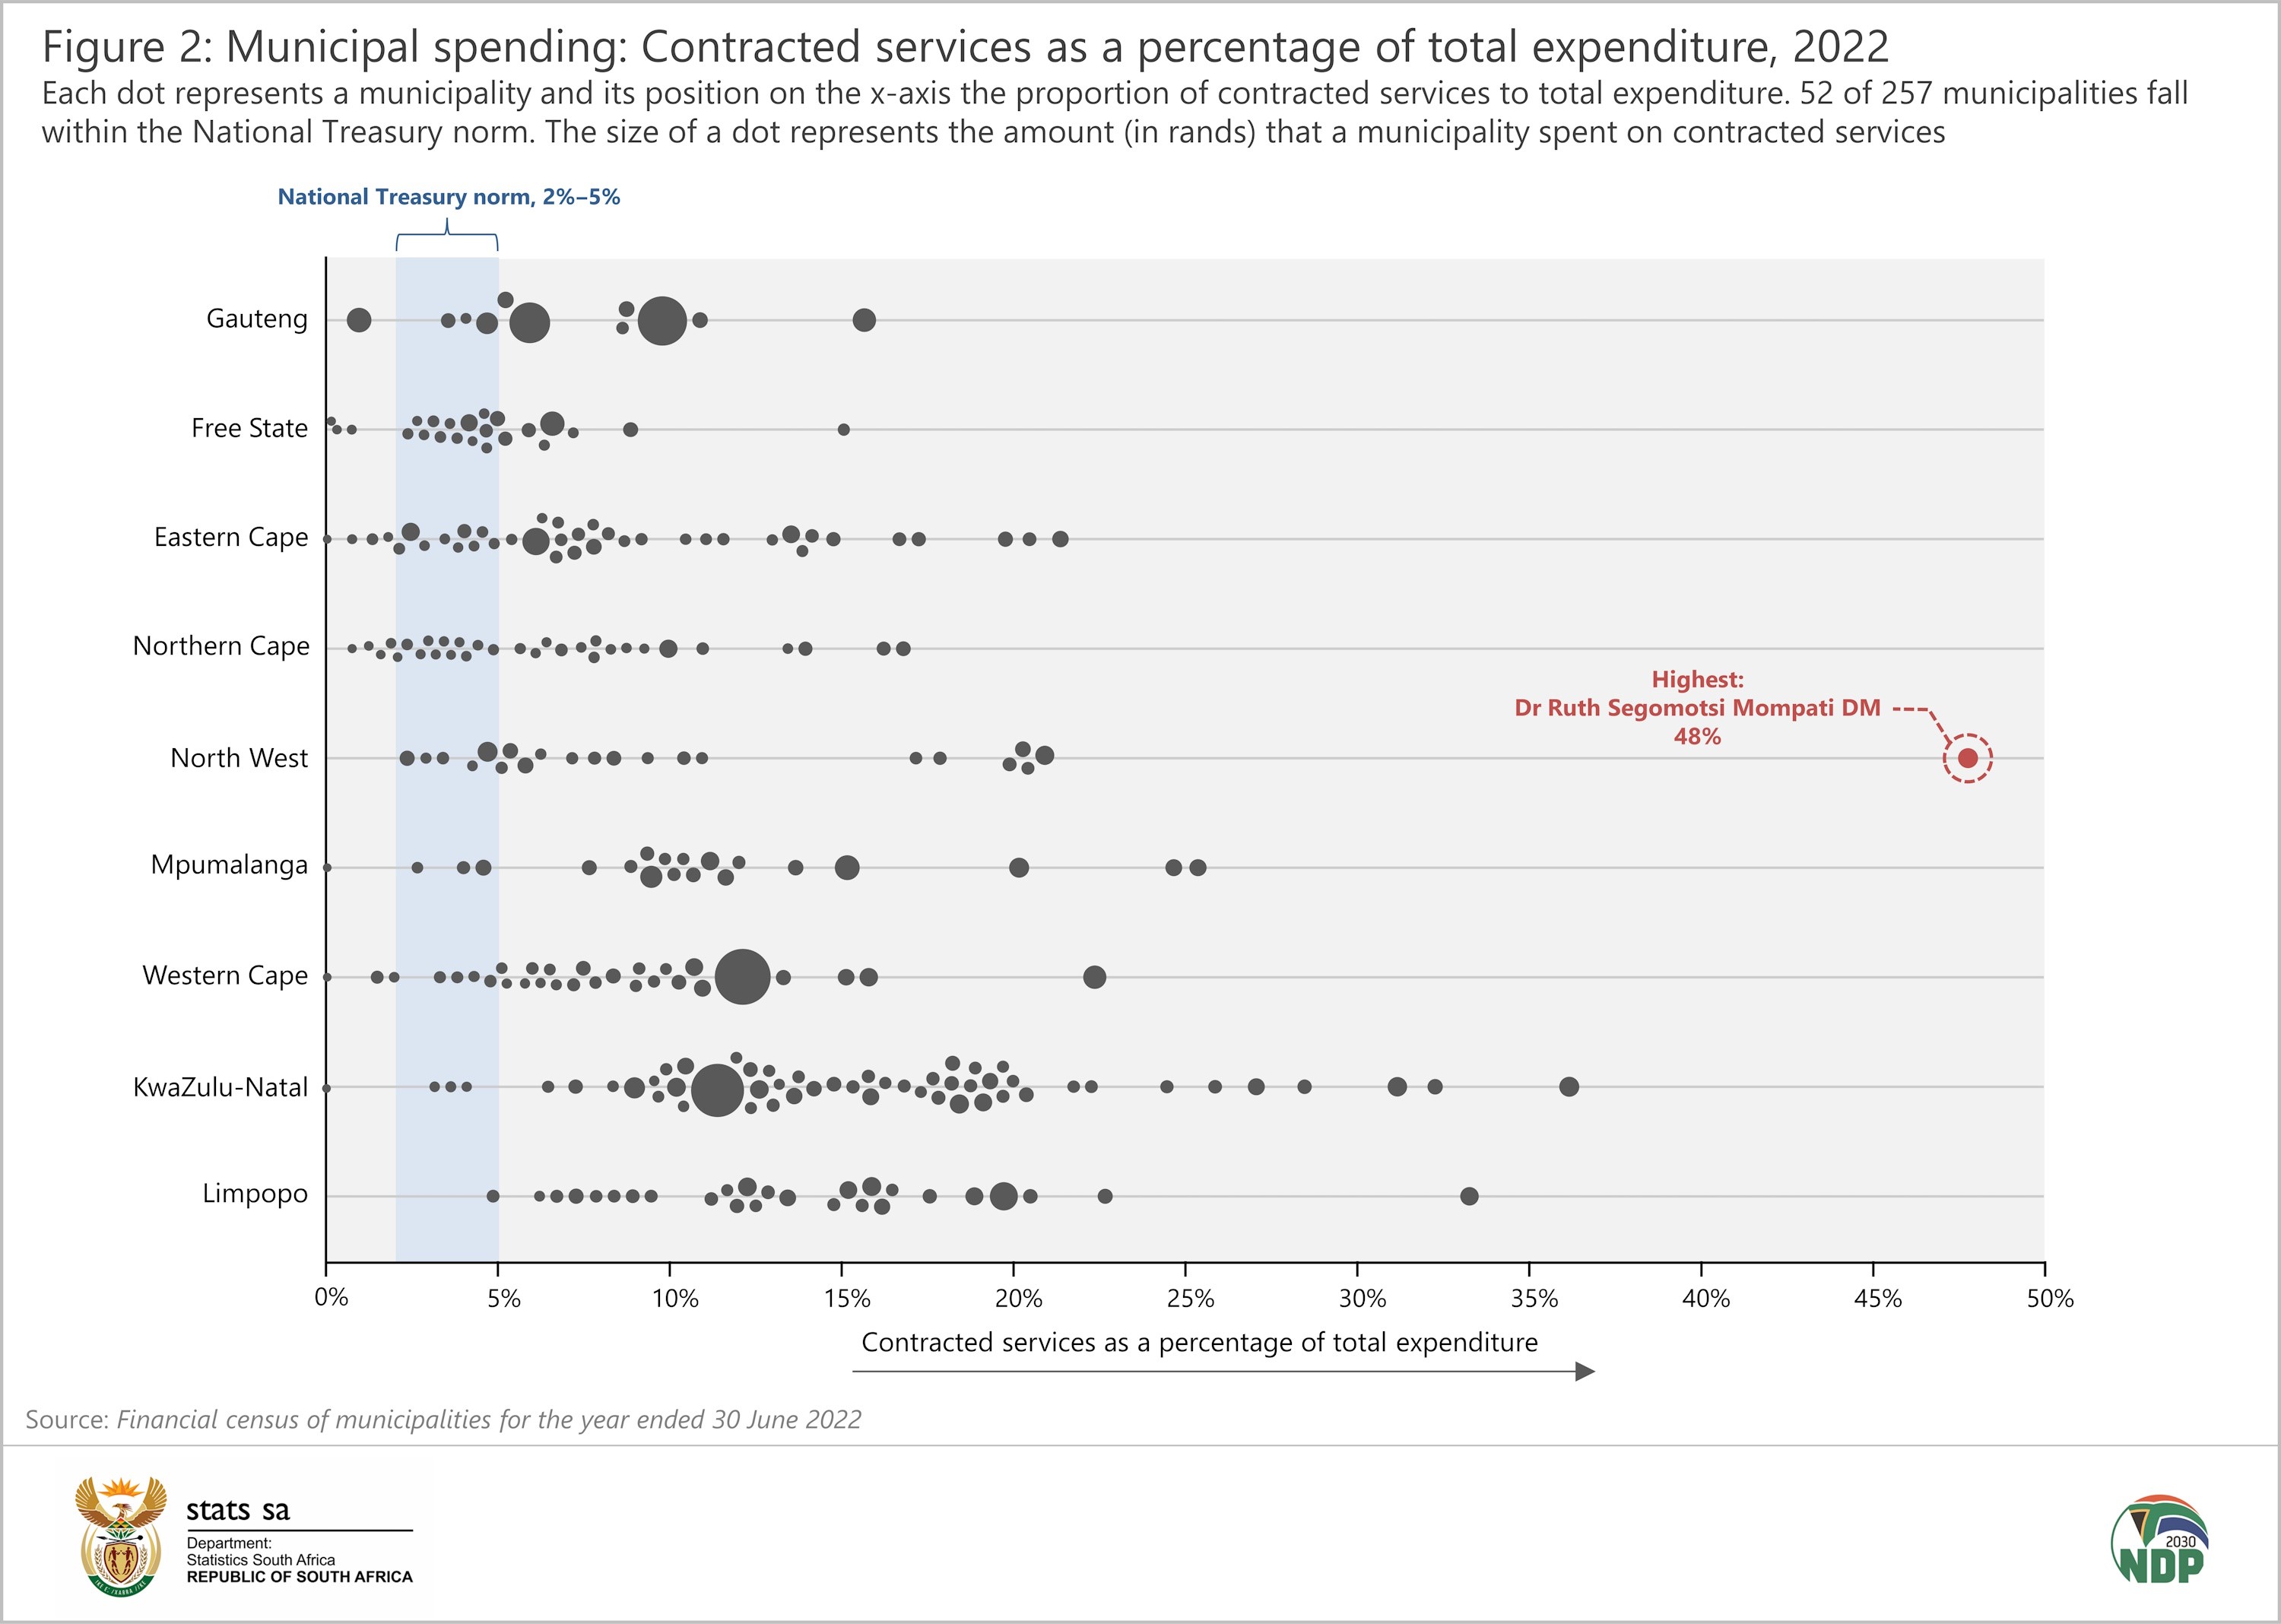
If a municipality exceeds this norm, it could indicate that many functions are outsourced to private contractors, not efficiently utilised or that a municipality is struggling to build its own human capacity, increasing its reliance on private contractors. However, National Treasury also notes that this ratio depends on the service delivery model that the municipality has adopted. Municipalities often struggle to find or attract the skills that they need, with contractors filling a vital gap.
A future avenue for research
An interesting question comes to mind. Could there be a relationship between the two indicators? One could surmise that municipalities that have little need for contracted services might spend relatively more on remuneration as most of the work would be done in-house. In contrast, municipalities that rely heavily on contractors to fill a skills shortage might spend relatively less on wages and salaries. Municipalities with excessive spending on both fronts might warrant further investigation.
For more information, download the latest Financial census of municipalities report and unit data in Excel here.
1 National Treasury, MFMA Circular No. 71, Uniform Financial Ratios and Norms, page 17 (download here).
2 Total expenditure excludes surplus, which is a balancing figure in the statistical release.
3 Remuneration includes employee-related costs and remuneration of councillors.
Similar articles are available on the Stats SA website and can be accessed here.
For a monthly overview of economic indicators and infographics, catch the latest edition of the Stats Biz newsletter here.