
Gauteng municipalities lead the way in income generation from households
Municipalities in Gauteng province are better off in terms of generating their own revenue in the form of services provided to households, while at the same time they are also getting a bigger share of the grants and subsidies received from both national and provincial governments in proportion to the increase in total population.
The quarterly financial statistics of municipalities (QFSM) is based on the information received from 87% of municipalities in the second quarter (April – June 2013). The publication includes all the metropolitan municipalities and the majority of large local and district municipalities. These statistics provide insight into the different kinds of property rates received by local and metropolitan municipalities in South Africa. Most of the municipalities, especially the ones that are urban based are able to survive from income generated from these services.
Municipalities are responsible for providing basic services to everyone within their municipal jurisdiction. These income generating services include supplying electricity, water and sewerage, collecting and disposing of refuse removals. In order to provide these services, municipalities charge residents for the provision of services.
The latest QFSM provides some interesting detail about the municipal income -generating sources. Municipal total income for the second quarter amounted to R63,8 billion, (compared to R61,5 billion for the first quarter (January – March 2013)) an increase of R2,3 billion. Of the R63,8 billion, sales of electricity contributed 29,4% (R18,7 billion), grants and subsidies contributed 22,6% (R14,4 billion), property rates contributed 18,5% (R11,8 billion), other income, which consists of, among others, interest received, rental of facilities and equipment, fines, etc., contributed 14,8% (R9,4 billion) and sales of water contributed 9,3% (R5,9 billion). The smallest contribution was for sewerage and sanitation and refuse removal at 2,9% (R1,8 billion), and 2,5% (R1,6 billion) respectively.
Figure 1: Percentage share of property rates received: April – June 2013
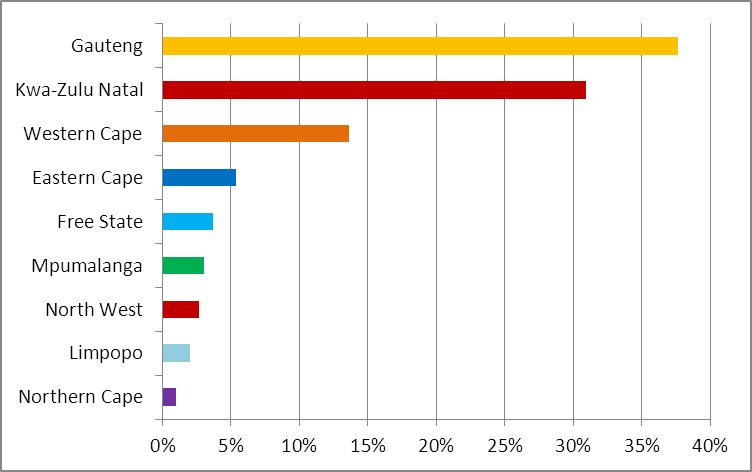
Figure 1 indicates that municipalities in Gauteng province are leading on income generated through property rates at 38% (R4,5 billion), followed by KwaZulu-Natal with 31% (R3,7 billion). The smallest contribution was made by municipalities in Northern Cape with 1% (R116 million).
Figure 2: Property rates received by categories: April – June 2013
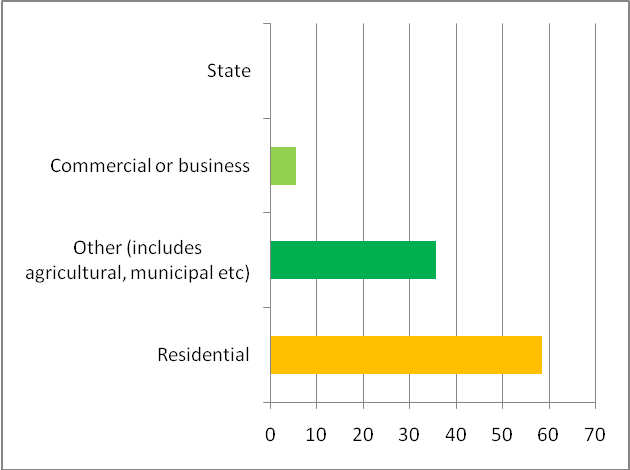
The fogure above shows residential property owners contributed 58% (R6,9 billion) of property rates received, with other (such as agriculture) contributing 36% (R4,2 billion), while commercial or businesses contributed 6% (R0,7 billion). The smallest contribution was less than 1% from property rates received from the state.
Sales of Electricity
Figure 3: Percentage share of sales of electricity: April – June 2013

Figure 3 indicates that sales of electricity by municipalities during the quarter ended 30 June 2013 amounted to R18,7 billion (29,4% of the total income of municipalities) compared with R17,4 billion in the quarter ended March 2013 with an increase of 7,3% (R1,2 billion). The largest contributions to the R18,7 billion was from municipalities in Gauteng with 42% (R7,8 billion), followed by municipalities in KwaZulu-Natal with 18% (R3,5 billion) and Western Cape with 17% (R3,2 billion)
Grants and subsidies
Figure 4: Percentage share of Grants and subsidies received: April – June 2013
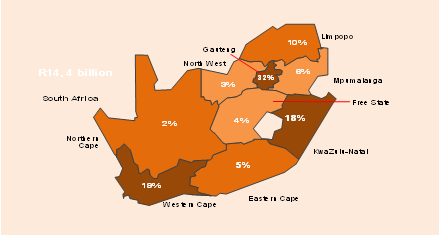
Municipalities received R14,4 billion in the form of grants and subsidies from provincial and national government during the quarter ended 30 June 2013, a decrease of 14,6% (R2,1 billion) compared to that received during the previous quarter was recorded. Figure 4 shows that the largest portion of the R14,4 billion in total grants and subsidies received went to municipalities in Gauteng with 33% (R4,6 billion), followed by those in Western Cape with 19% (R2,8 billion), KwaZulu-Natal with 18% (R2,6 billion) and Limpopo with 10% (R1,5 billion). The province with the lowest share of grants and subsidies received was Northern Cape with 3% (R358 million).
Concluding remarks
The above information highlights some of the financial status of municipal finances within the South African local government sphere. Readers can find more quarterly municipal financial information by accessing the publication, either online on the Stats SA website or by contacting Stats SA’s User Information service centre.
Data source: Quarterly financial statistics of municipalities (P9110)
Please click here to access the publication:
Please click here to access the presentation:
For more information please contact Jacob Shai: JacobS@Statssa.gov.za