
Inflation: the most vulnerable are at risk
The groups that are most susceptible to economic hardship are experiencing large increases in the cost of living, according to the latest inflation data.
Together with the headline consumer price index (CPI), Stats SA publishes inflation rates for each province, for ten different income groups and for pensioners. The basket for each of these indices is weighted according to the proportions of spending of each group.1
The poor are struggling the most
The headline rate was 6,8% in April 2023. The poorest households experienced the highest inflation rate: in the 12 months to April, the cost of living for households in decile 1 (the poorest households) increased by 11,3% (Figure 1).2 The rate was 7,8% for households in decile 5 and 6,2% for the wealthiest households (decile 10).
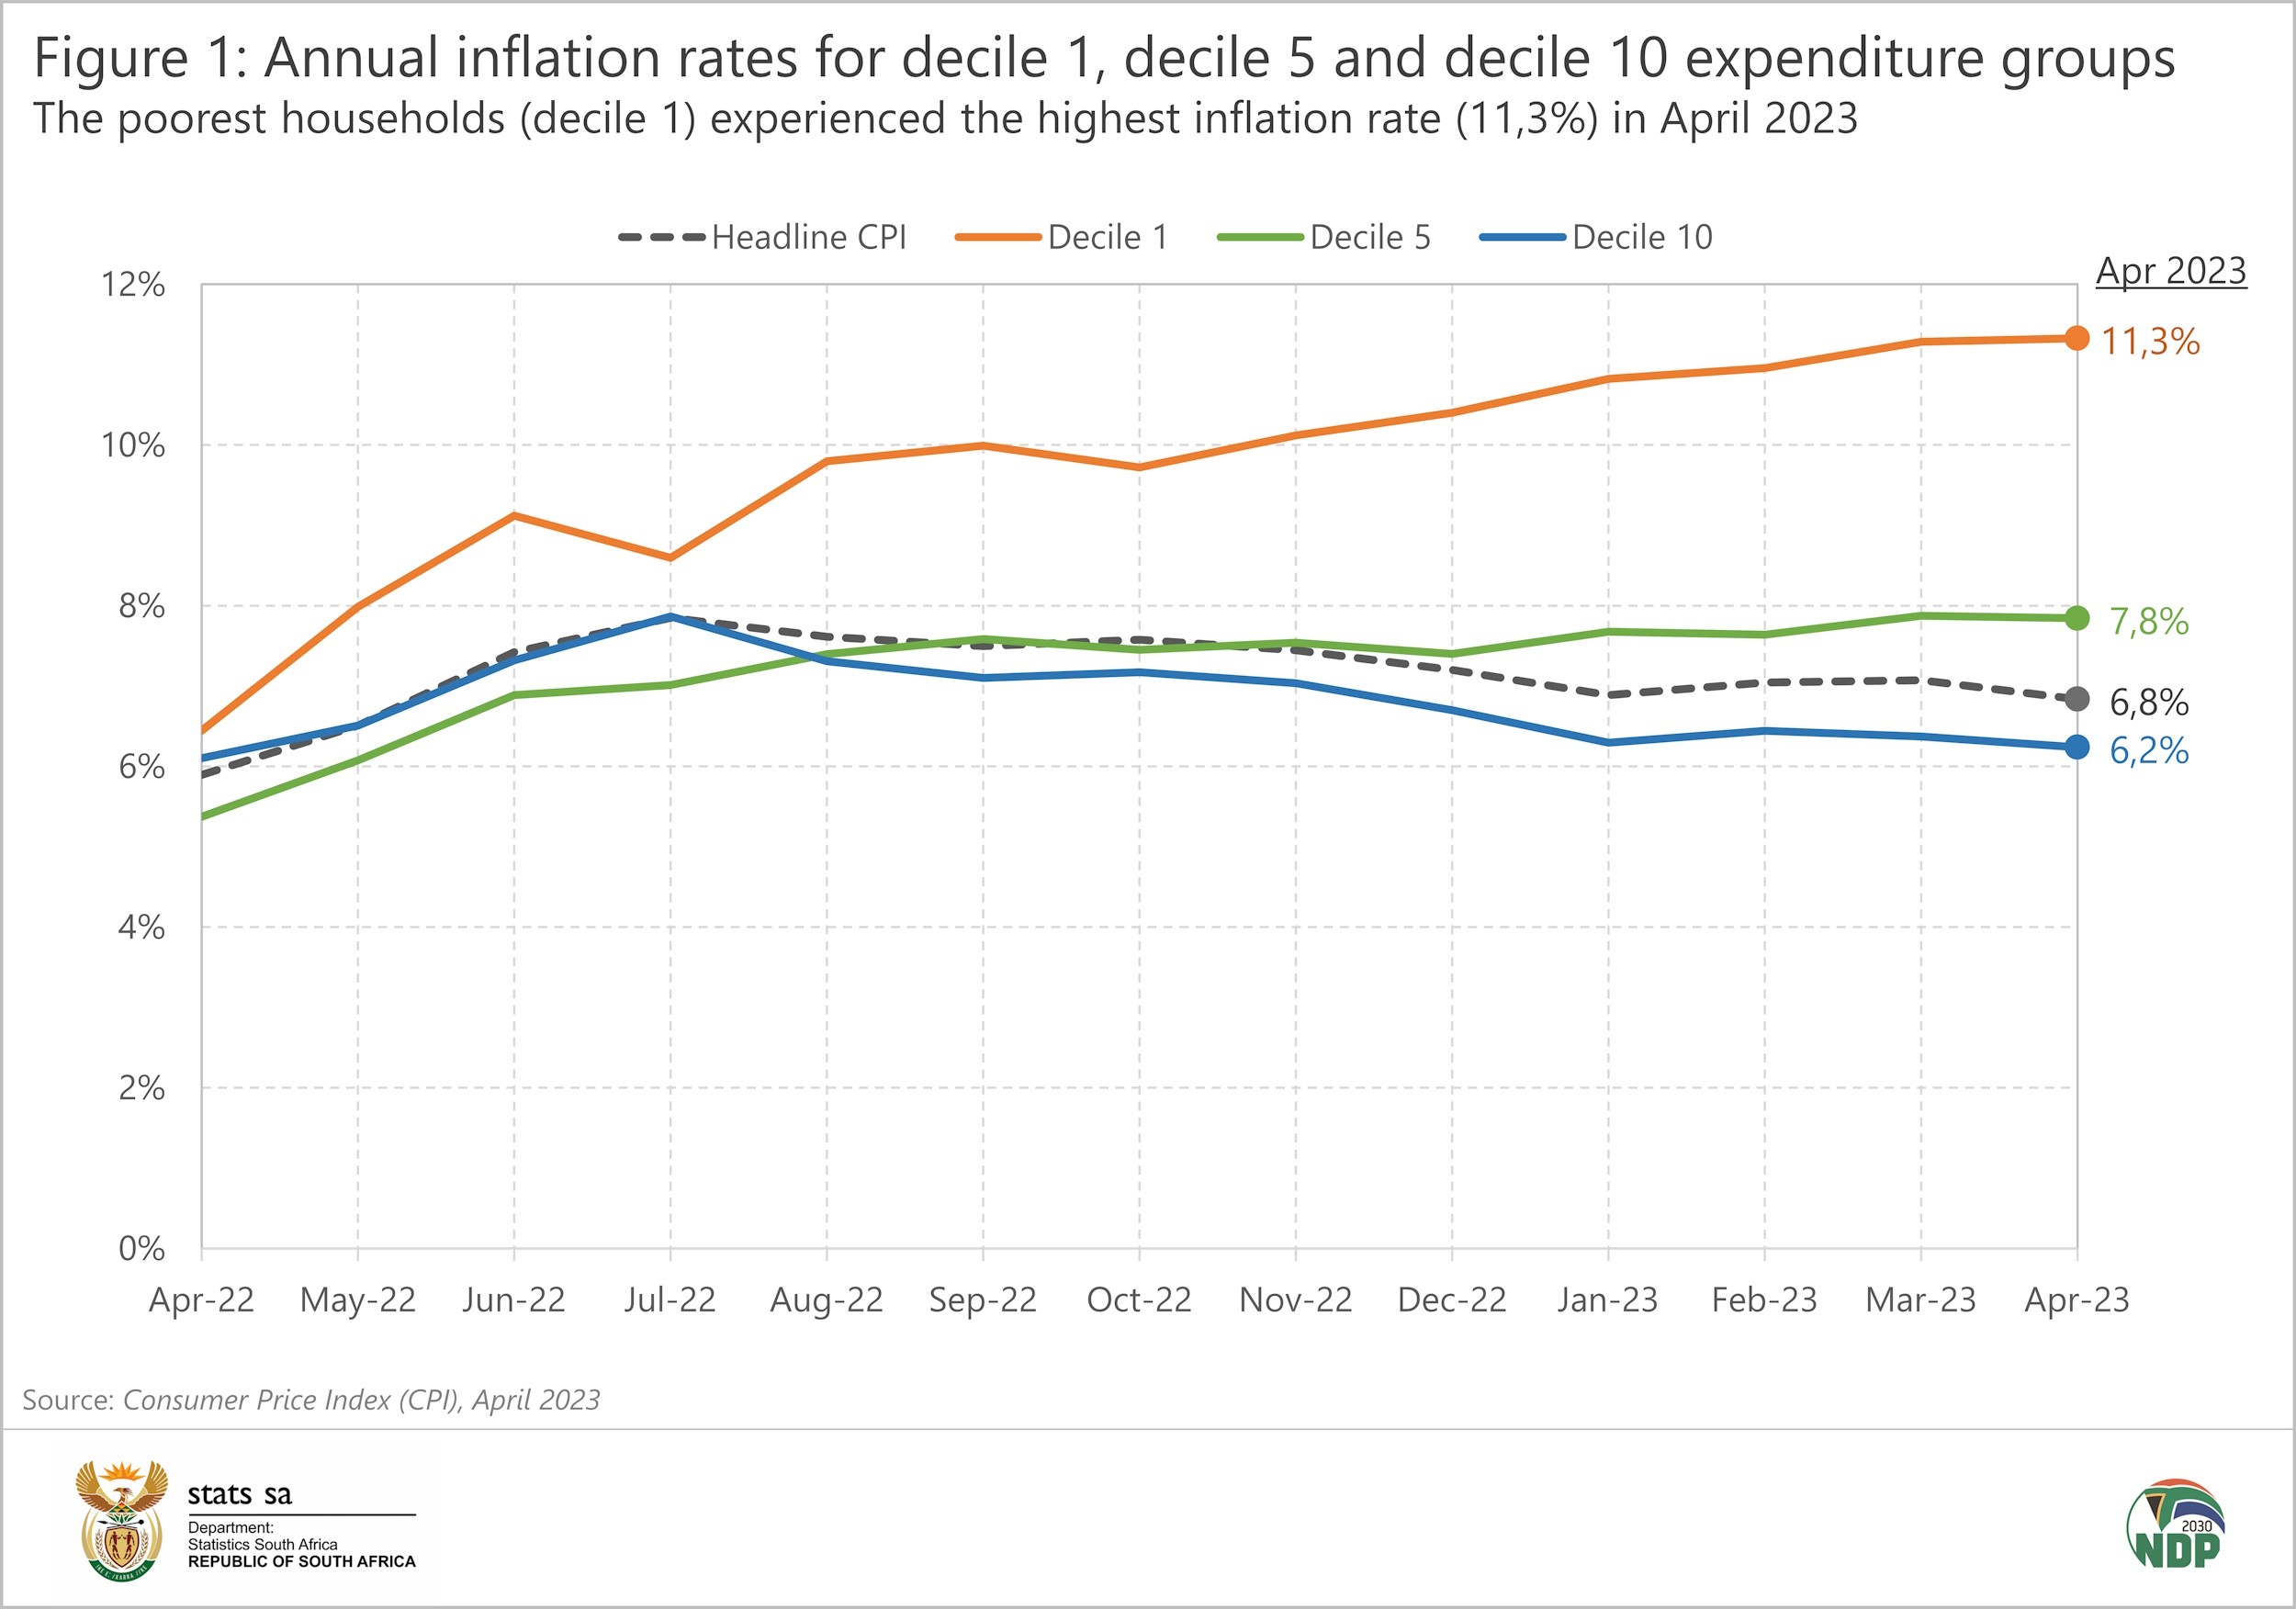
The rate for decile 1 exceeded the rates for decile 5 and decile 10 throughout this period, with the gap widening from July 2022 as food inflation accelerated. This shows how the poor have recently shouldered the brunt of rising prices.
The baskets for rich and poor exhibit stark differences (Figure 2).3 The poorest households (decile 1) spend half of their annual budgets on food and non-alcoholic beverages (NAB). For those with the highest expenditure (decile 10), food and NAB contributes 11%. Poorer households are thus more vulnerable to increases in the price of food.
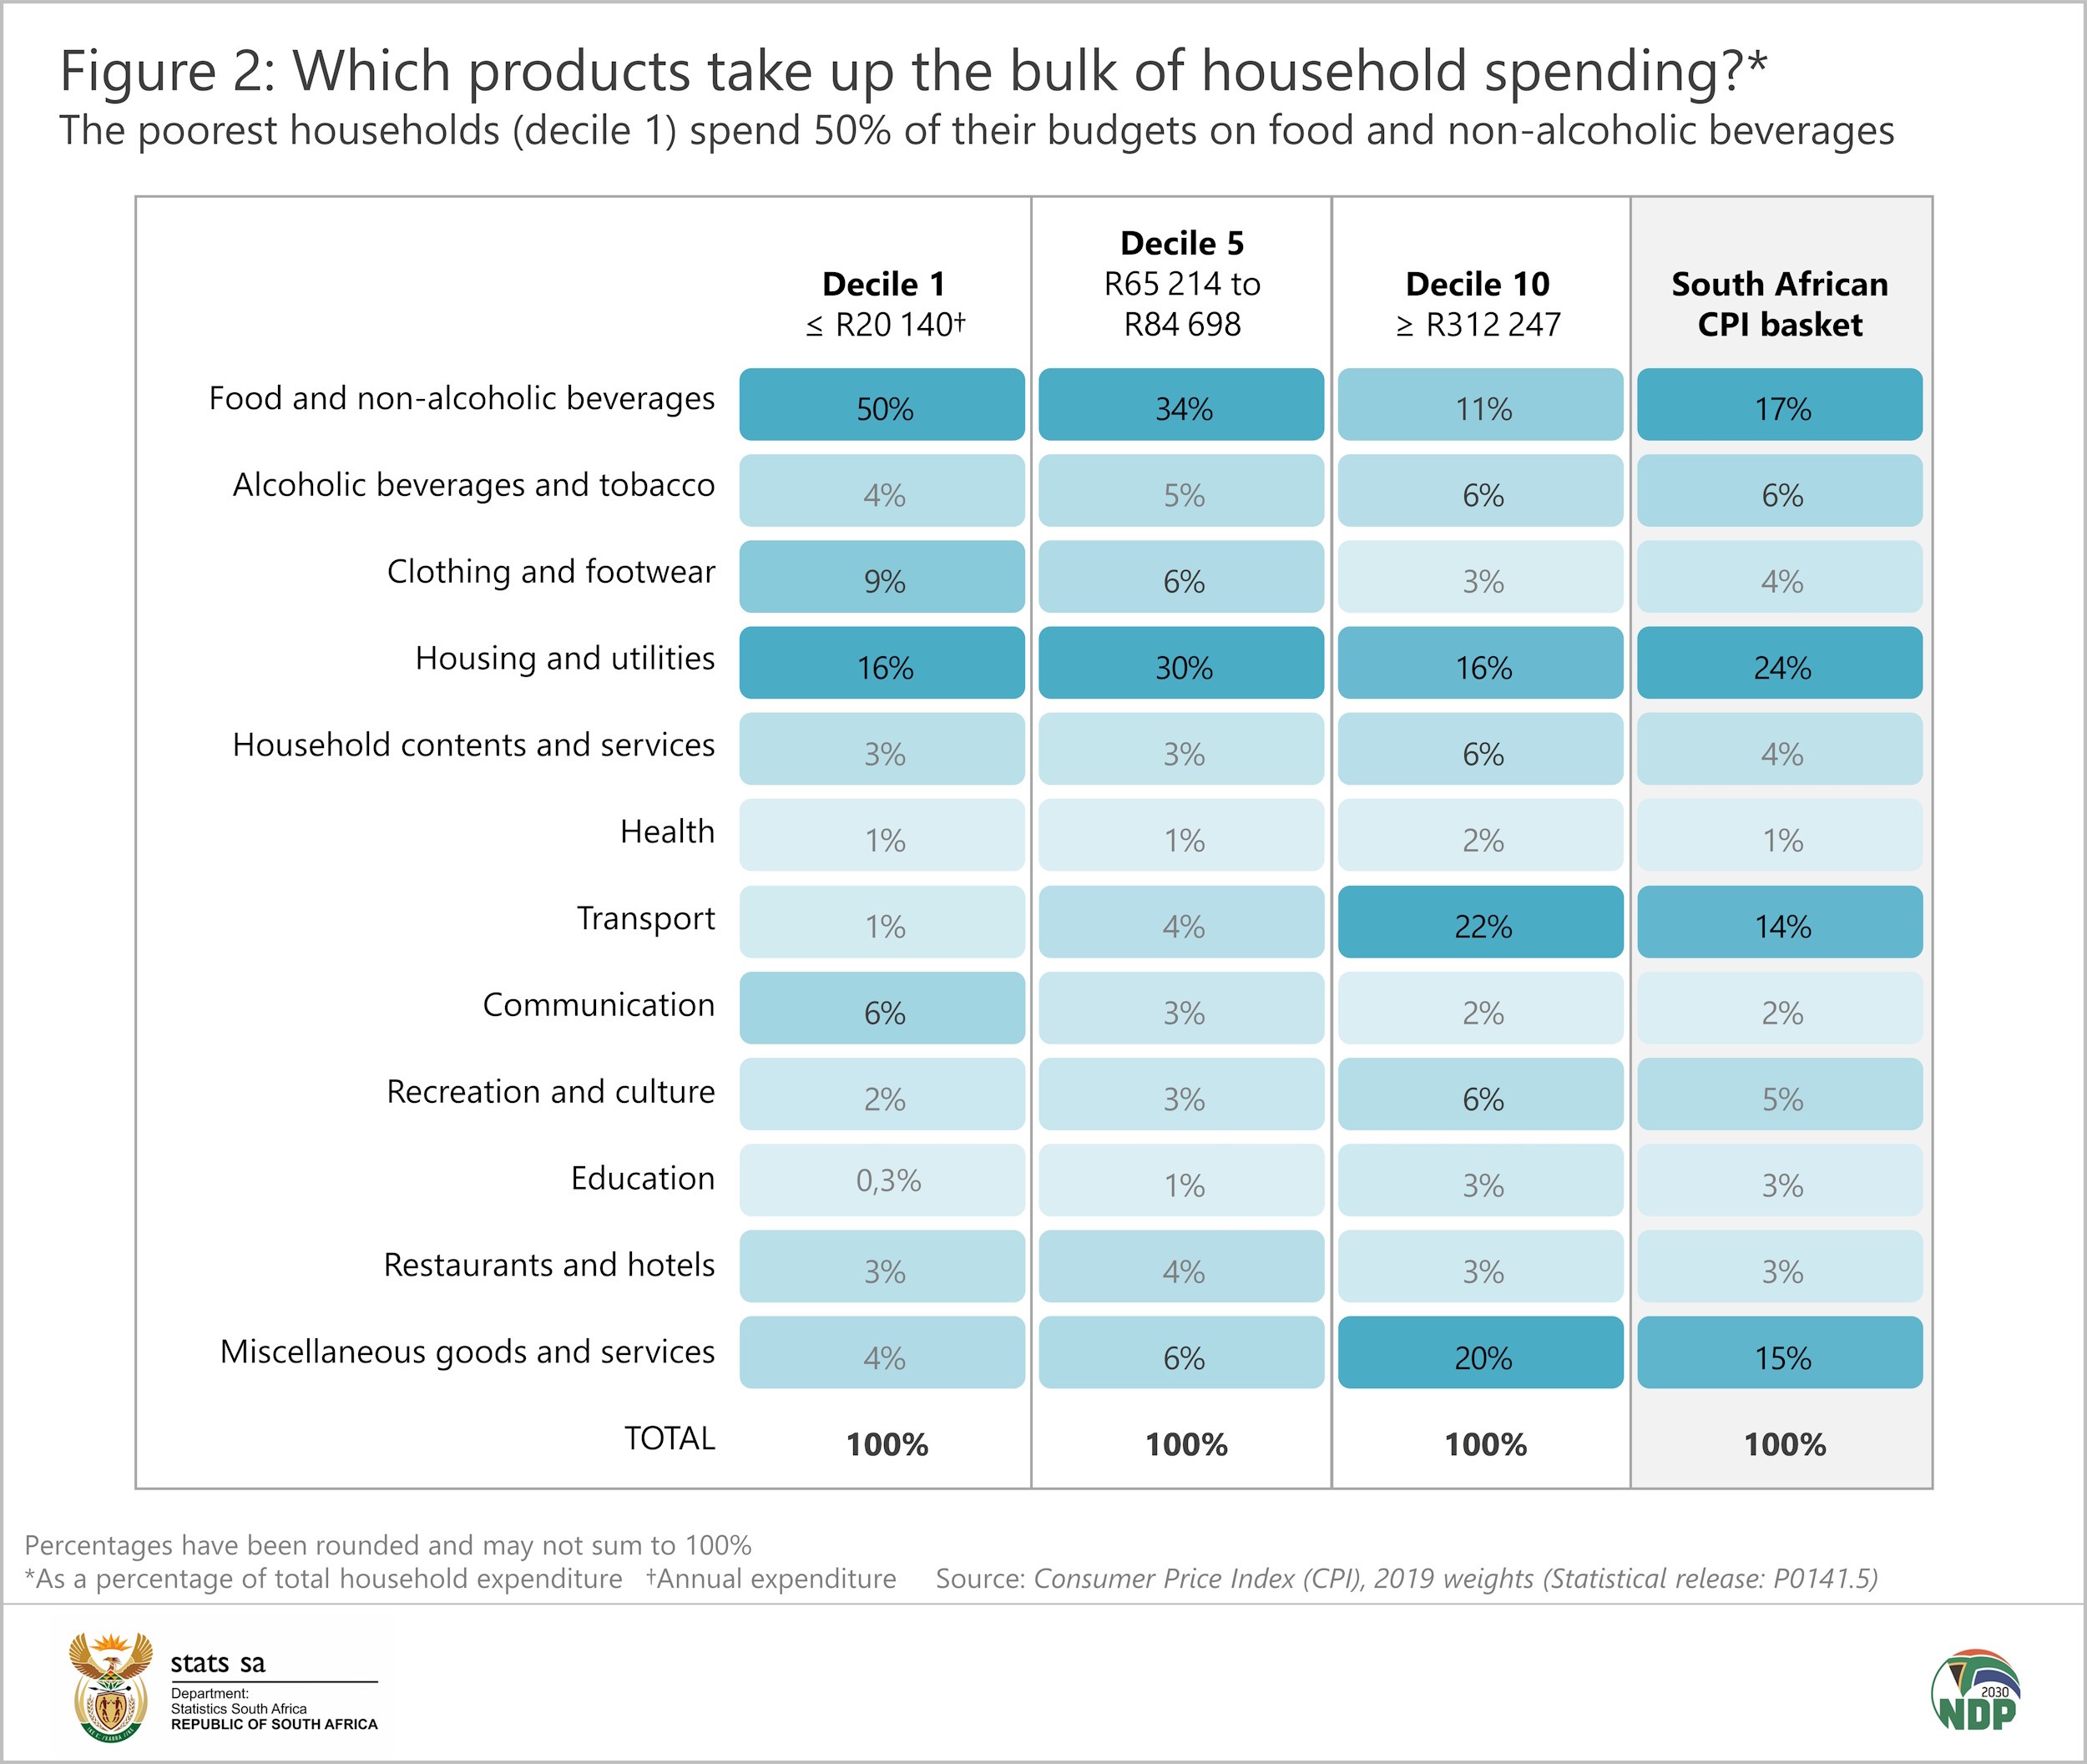
For the wealthiest, the biggest expenditure item is transport, followed by miscellaneous goods and services (which includes insurance). Increases in fuel prices therefore affect this group more severely.
The cost of living has risen the fastest in Free State and Mpumalanga
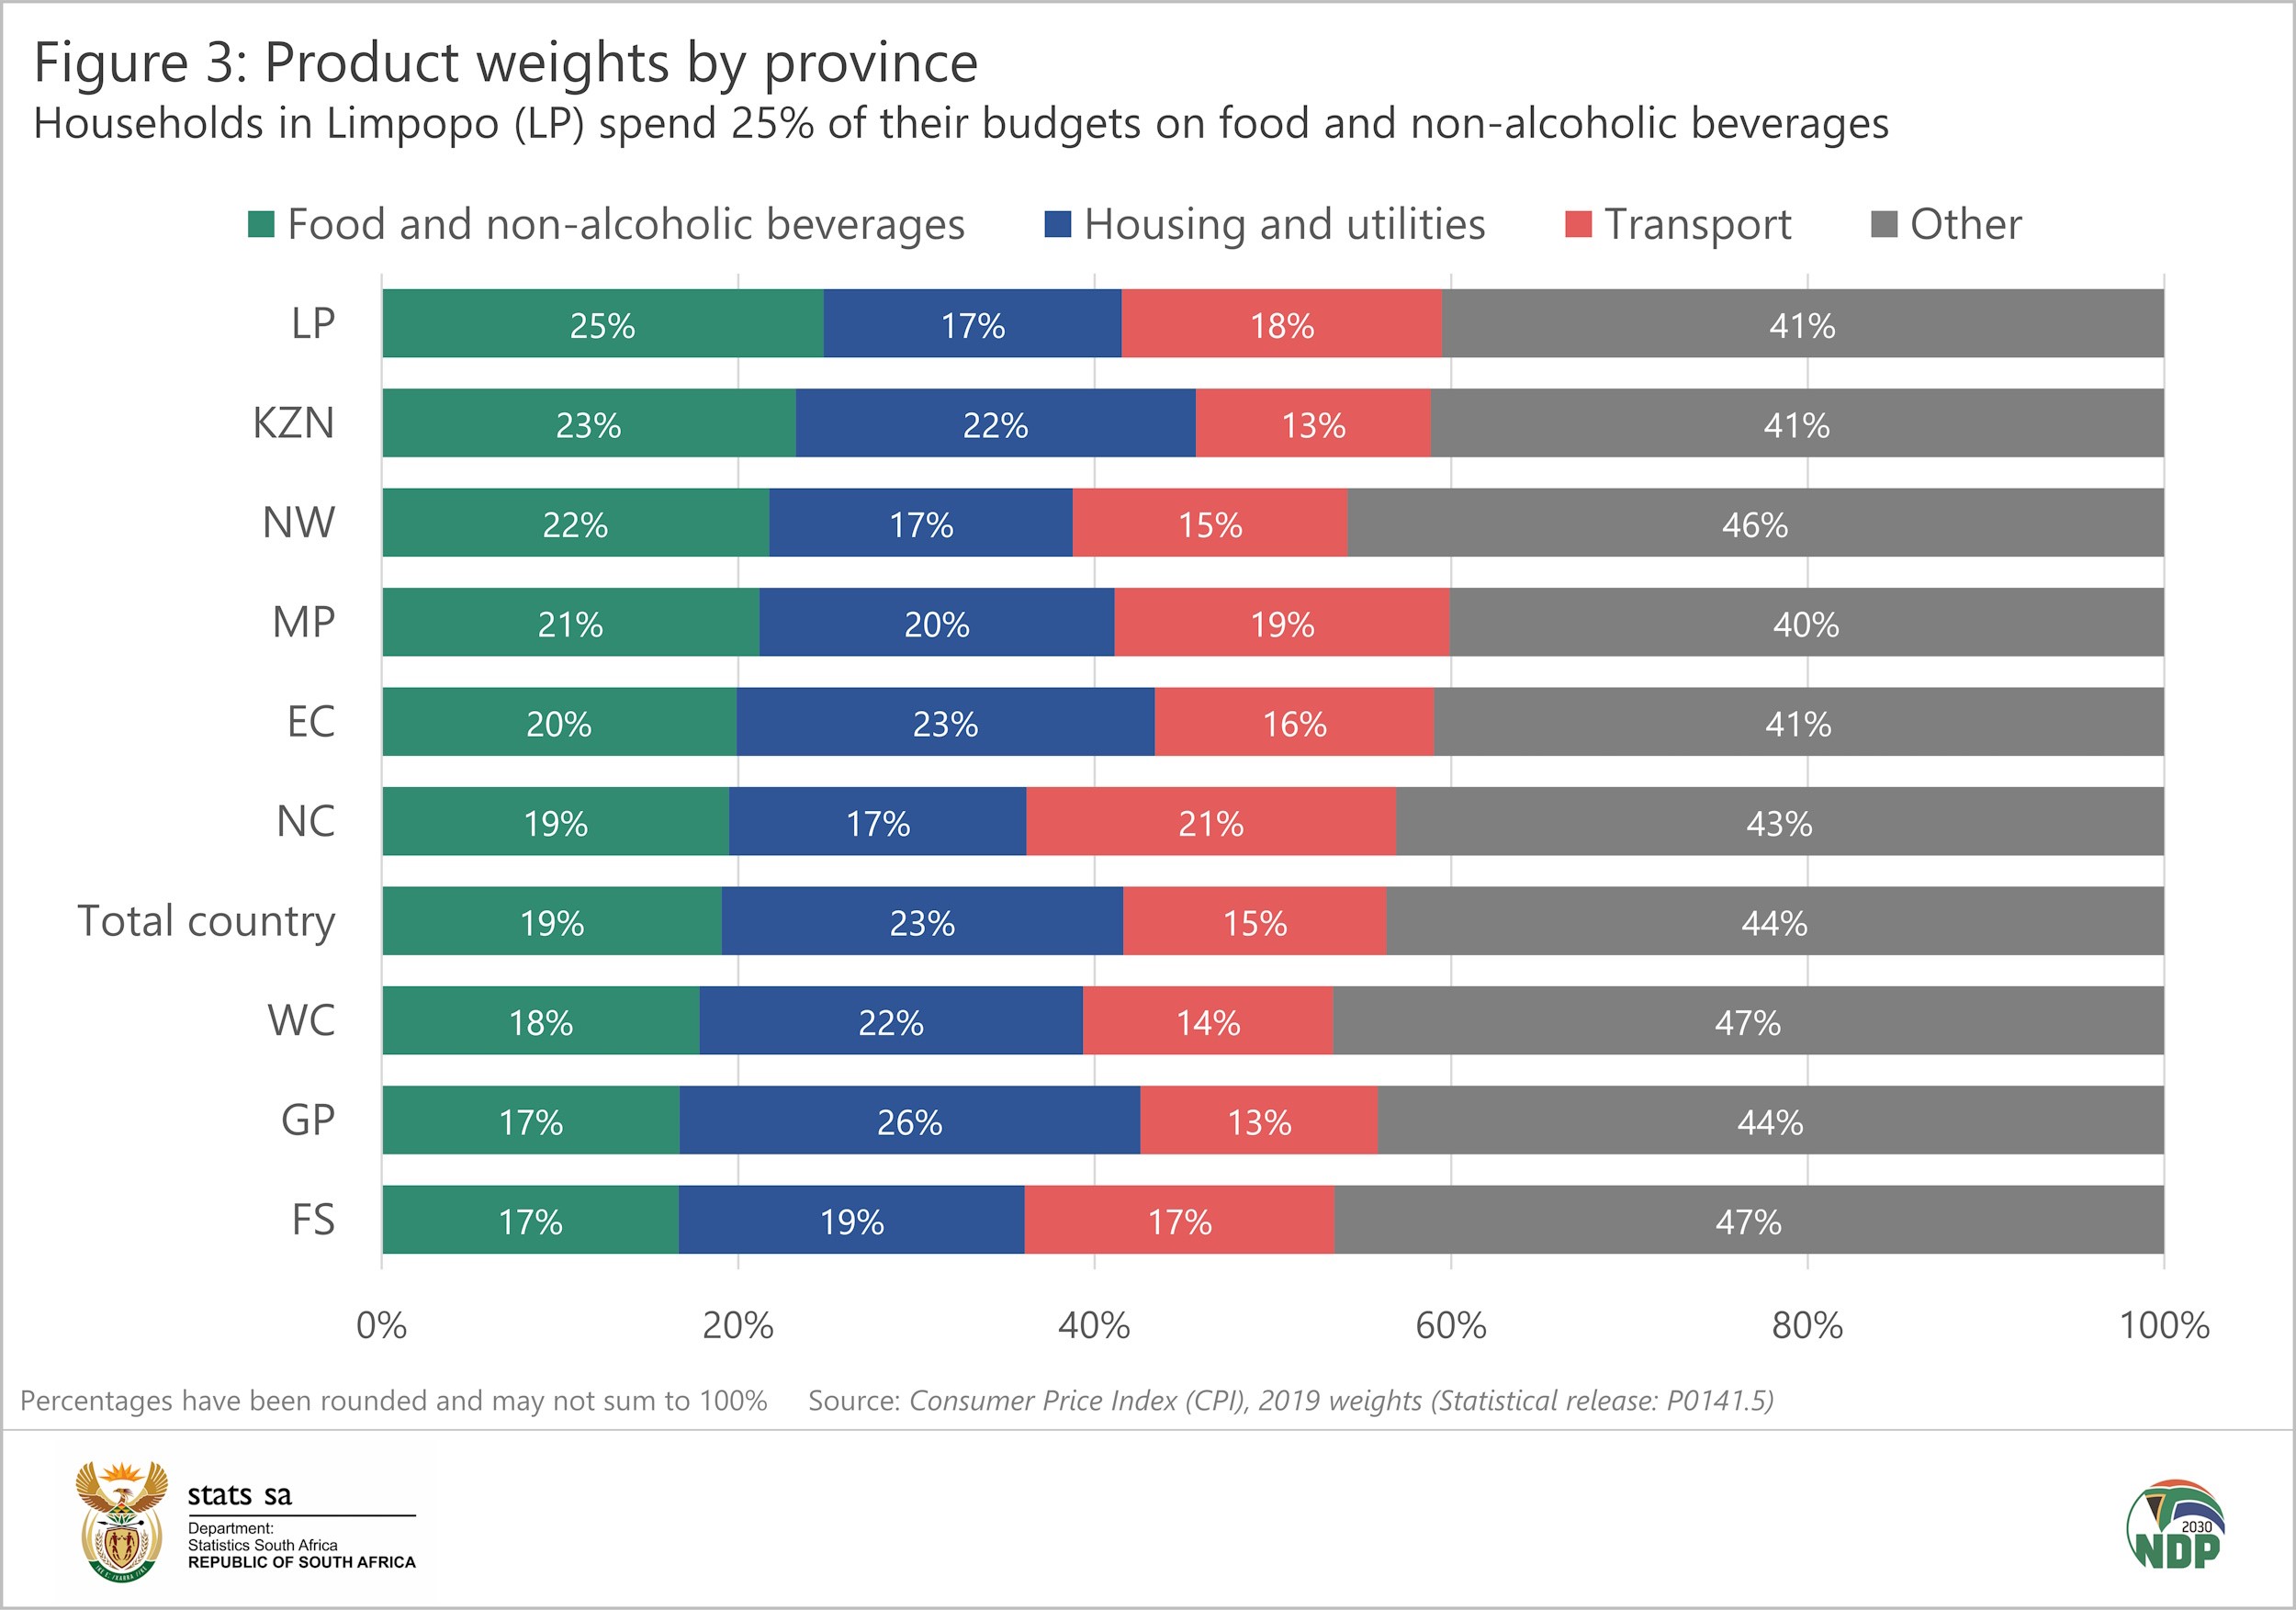
Geography matters. Households in Limpopo spend a fourth of their budgets on food and NAB (Figure 3), while the vast distances across Northern Cape have made transport the biggest spending item in that province. In Gauteng, R26 of every R100 of household expenditure goes to housing and utilities.
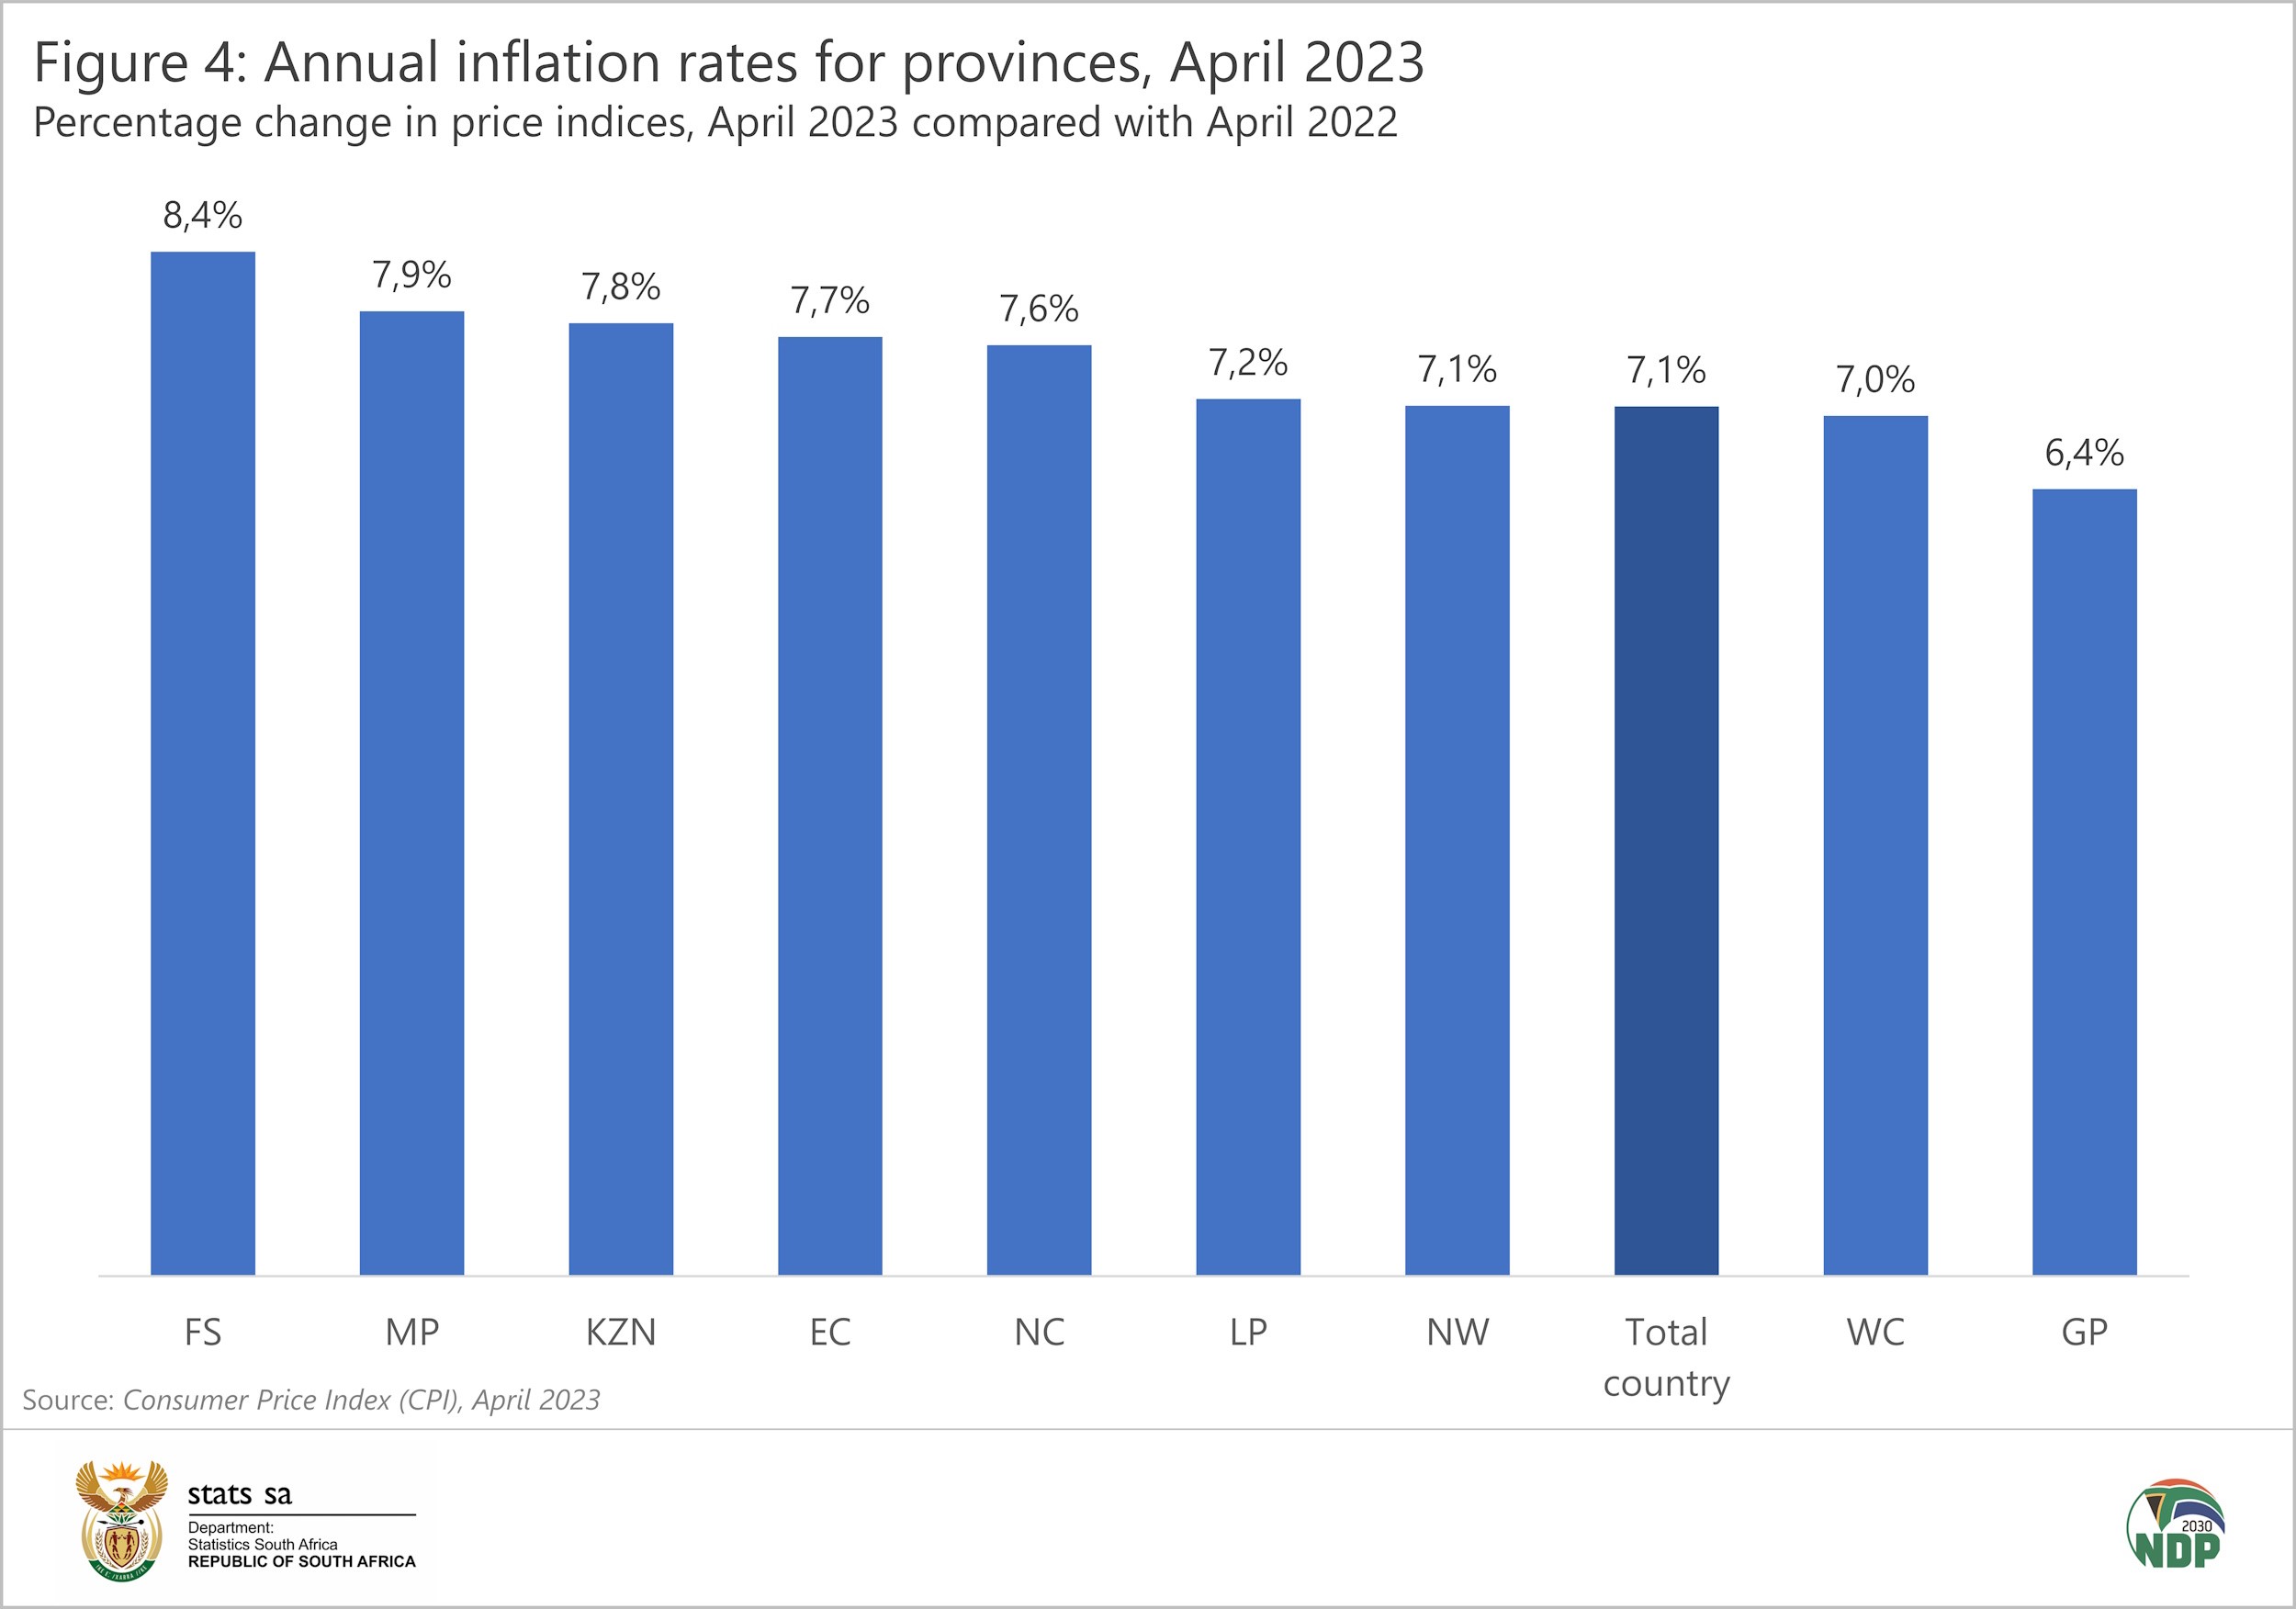
Free State and Mpumalanga recorded the highest annual inflation rates in April 2023 (Figure 4),4 followed by KwaZulu-Natal and Eastern Cape. In fact, Free State has recorded the highest rate since September 2022.
The predominantly urban provinces of Western Cape and Gauteng recorded the lowest rates in April 2023.
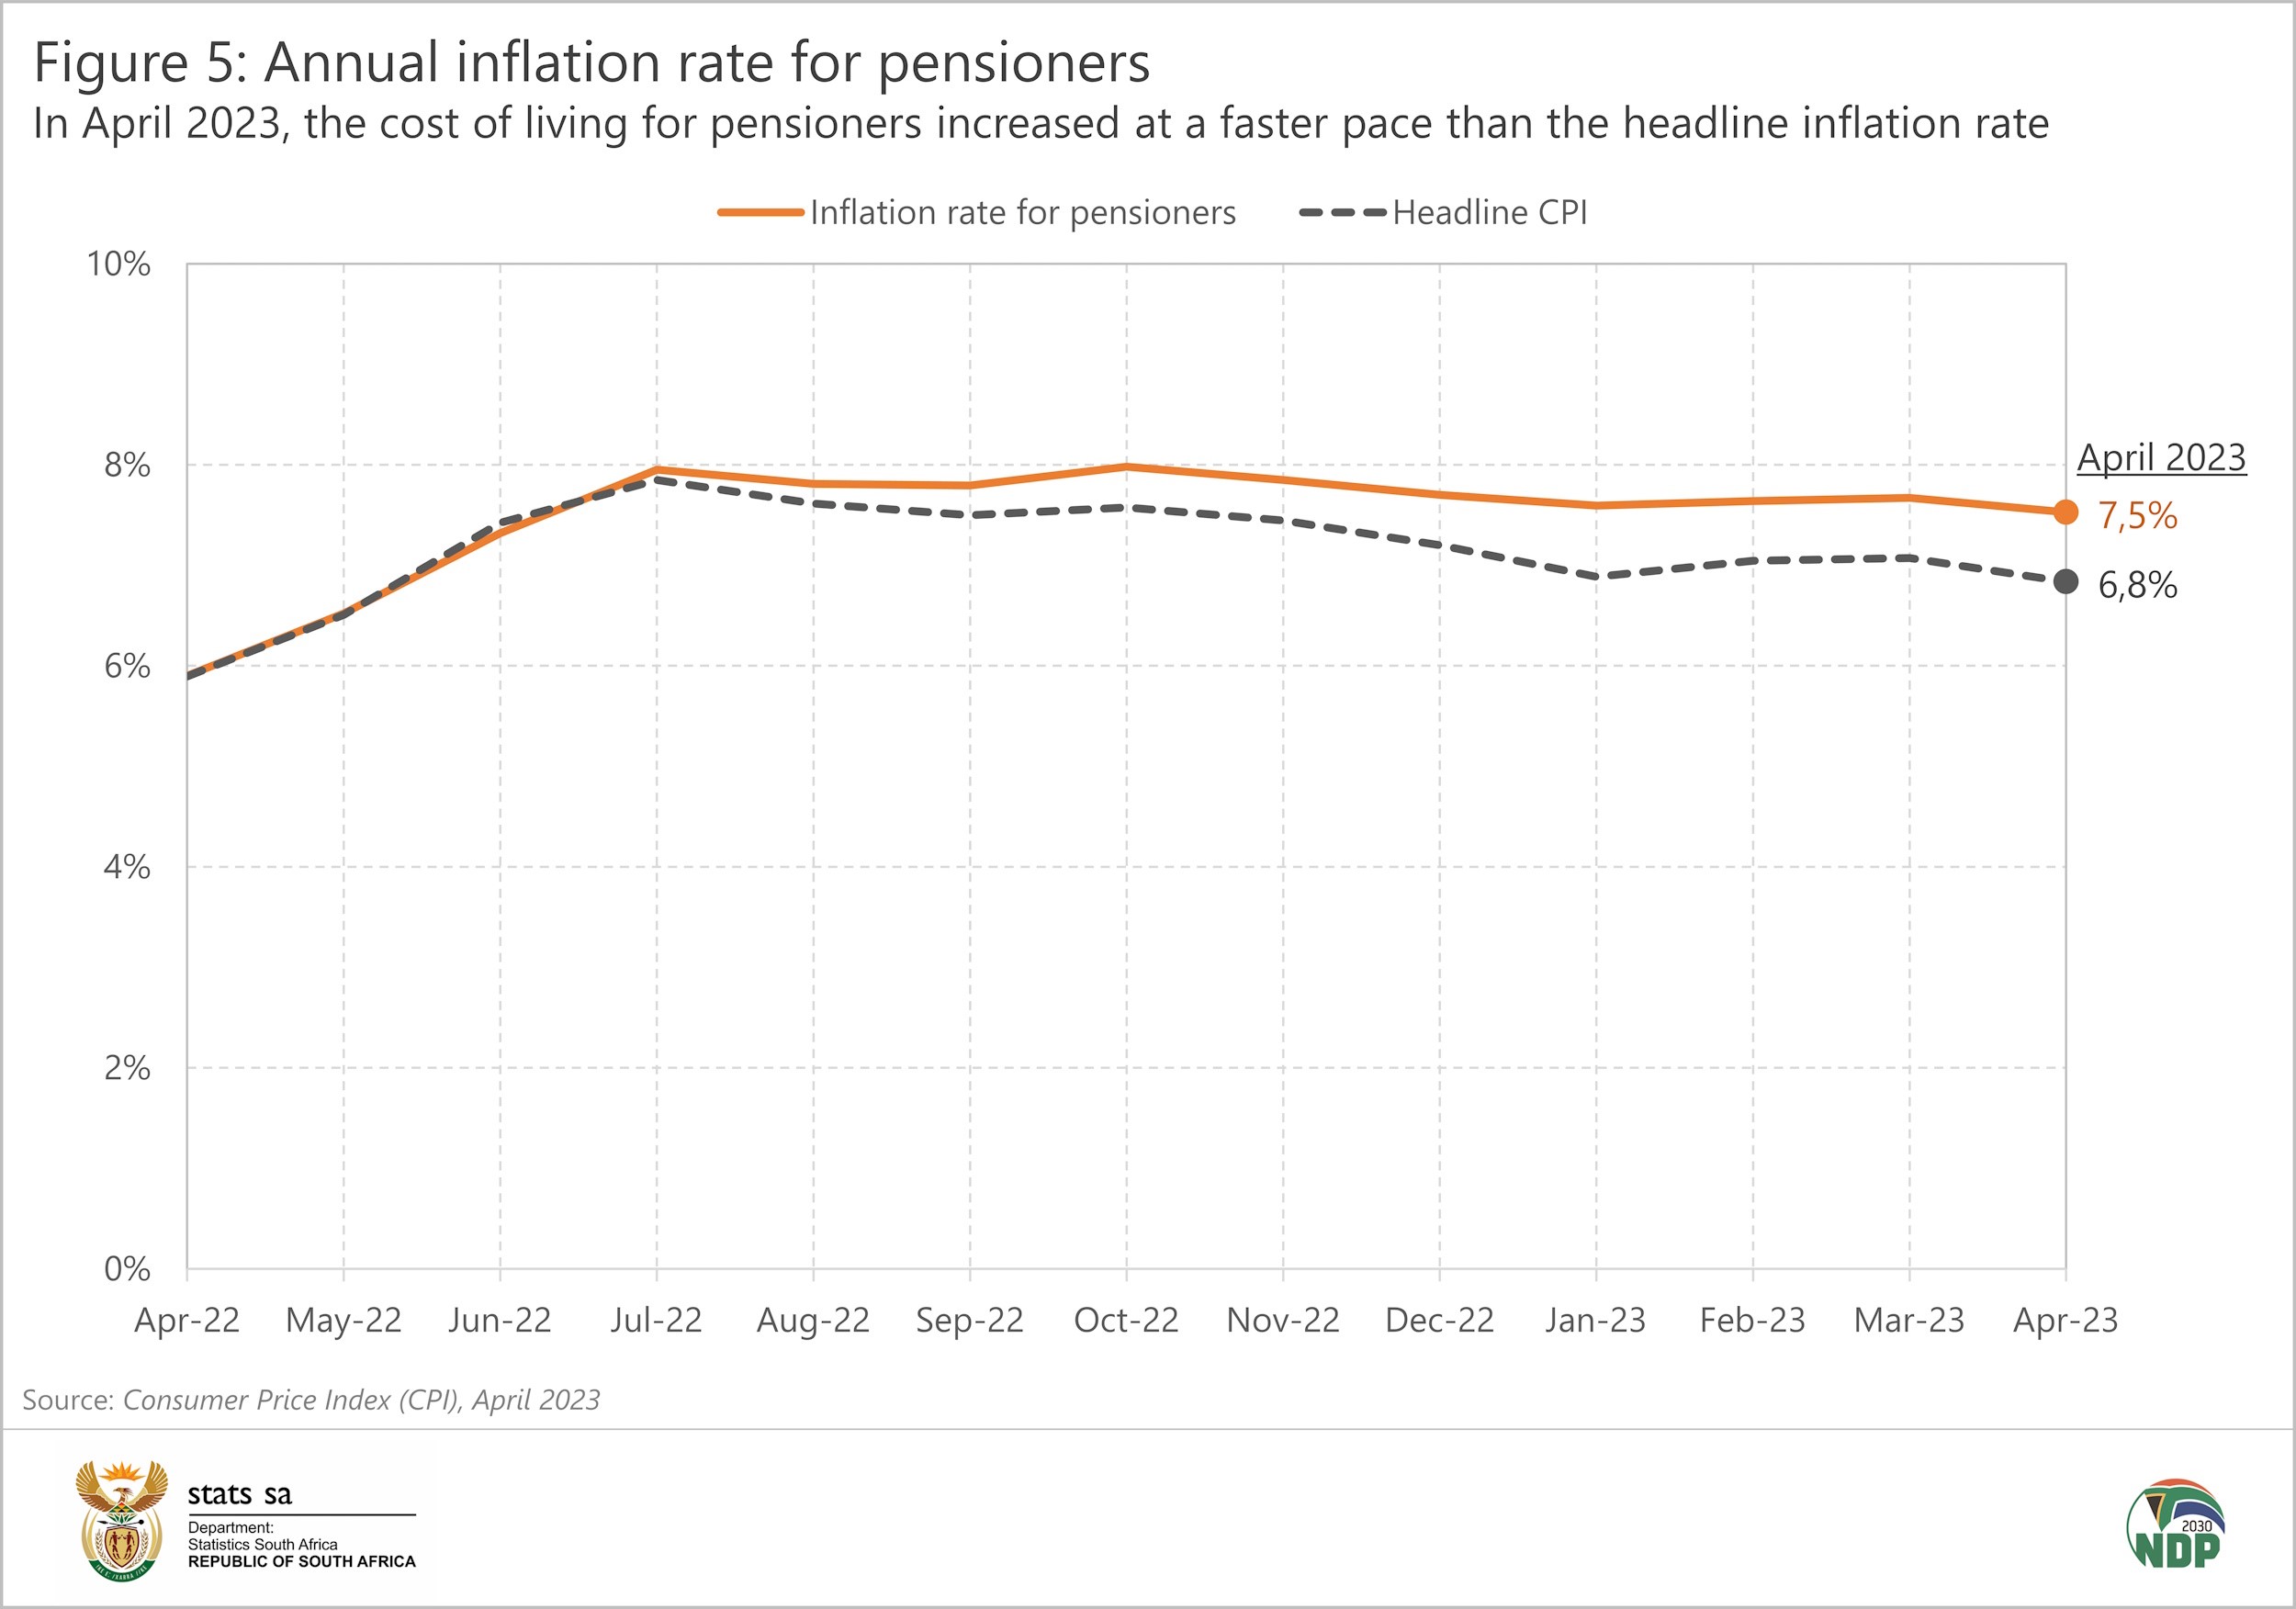
The cost of living for pensioners is above general inflation
Stats SA publishes an inflation rate for pensioners too. Since July 2022, the annual rate for pensioners has exceeded the headline rate (Figure 5). In the 12 months to April 2023, the cost of living for pensioners increased by 7,5%, higher than the 6,8% reading for general inflation.
For more information on the range of consumer price indices published by Stats SA, download the latest Consumer Price Index (CPI) statistical release here.
1 Read more on the inflation basket here.
2 Stats SA computes monthly price indices for expenditure deciles, with decile 1 (lowest expenditure) accounting for 0,48% of the CPI, and decile 10 (highest expenditure) accounting for 48,71% of the CPI. Inflation data for all deciles are published in Table A of the CPI statistical release.
3 Stats SA, Consumer Price Index (CPI), 2019 weights (download here).
4 Stats SA, Consumer Price Index (CPI), Additional tables, April 2023 (download here).
Similar articles are available on the Stats SA website and can be accessed here.
For a monthly overview of economic indicators and infographics, catch the latest edition of the Stats Biz newsletter here.