
Stats SA’s new property price index: Cape Town has become more expensive
Anecdotes about steep property price rises in the City of Cape Town are not without merit. Stats SA’s new residential property price index (RPPI) compares how housing prices have increased since 2010 across the eight metropolitan municipalities and nine provinces.
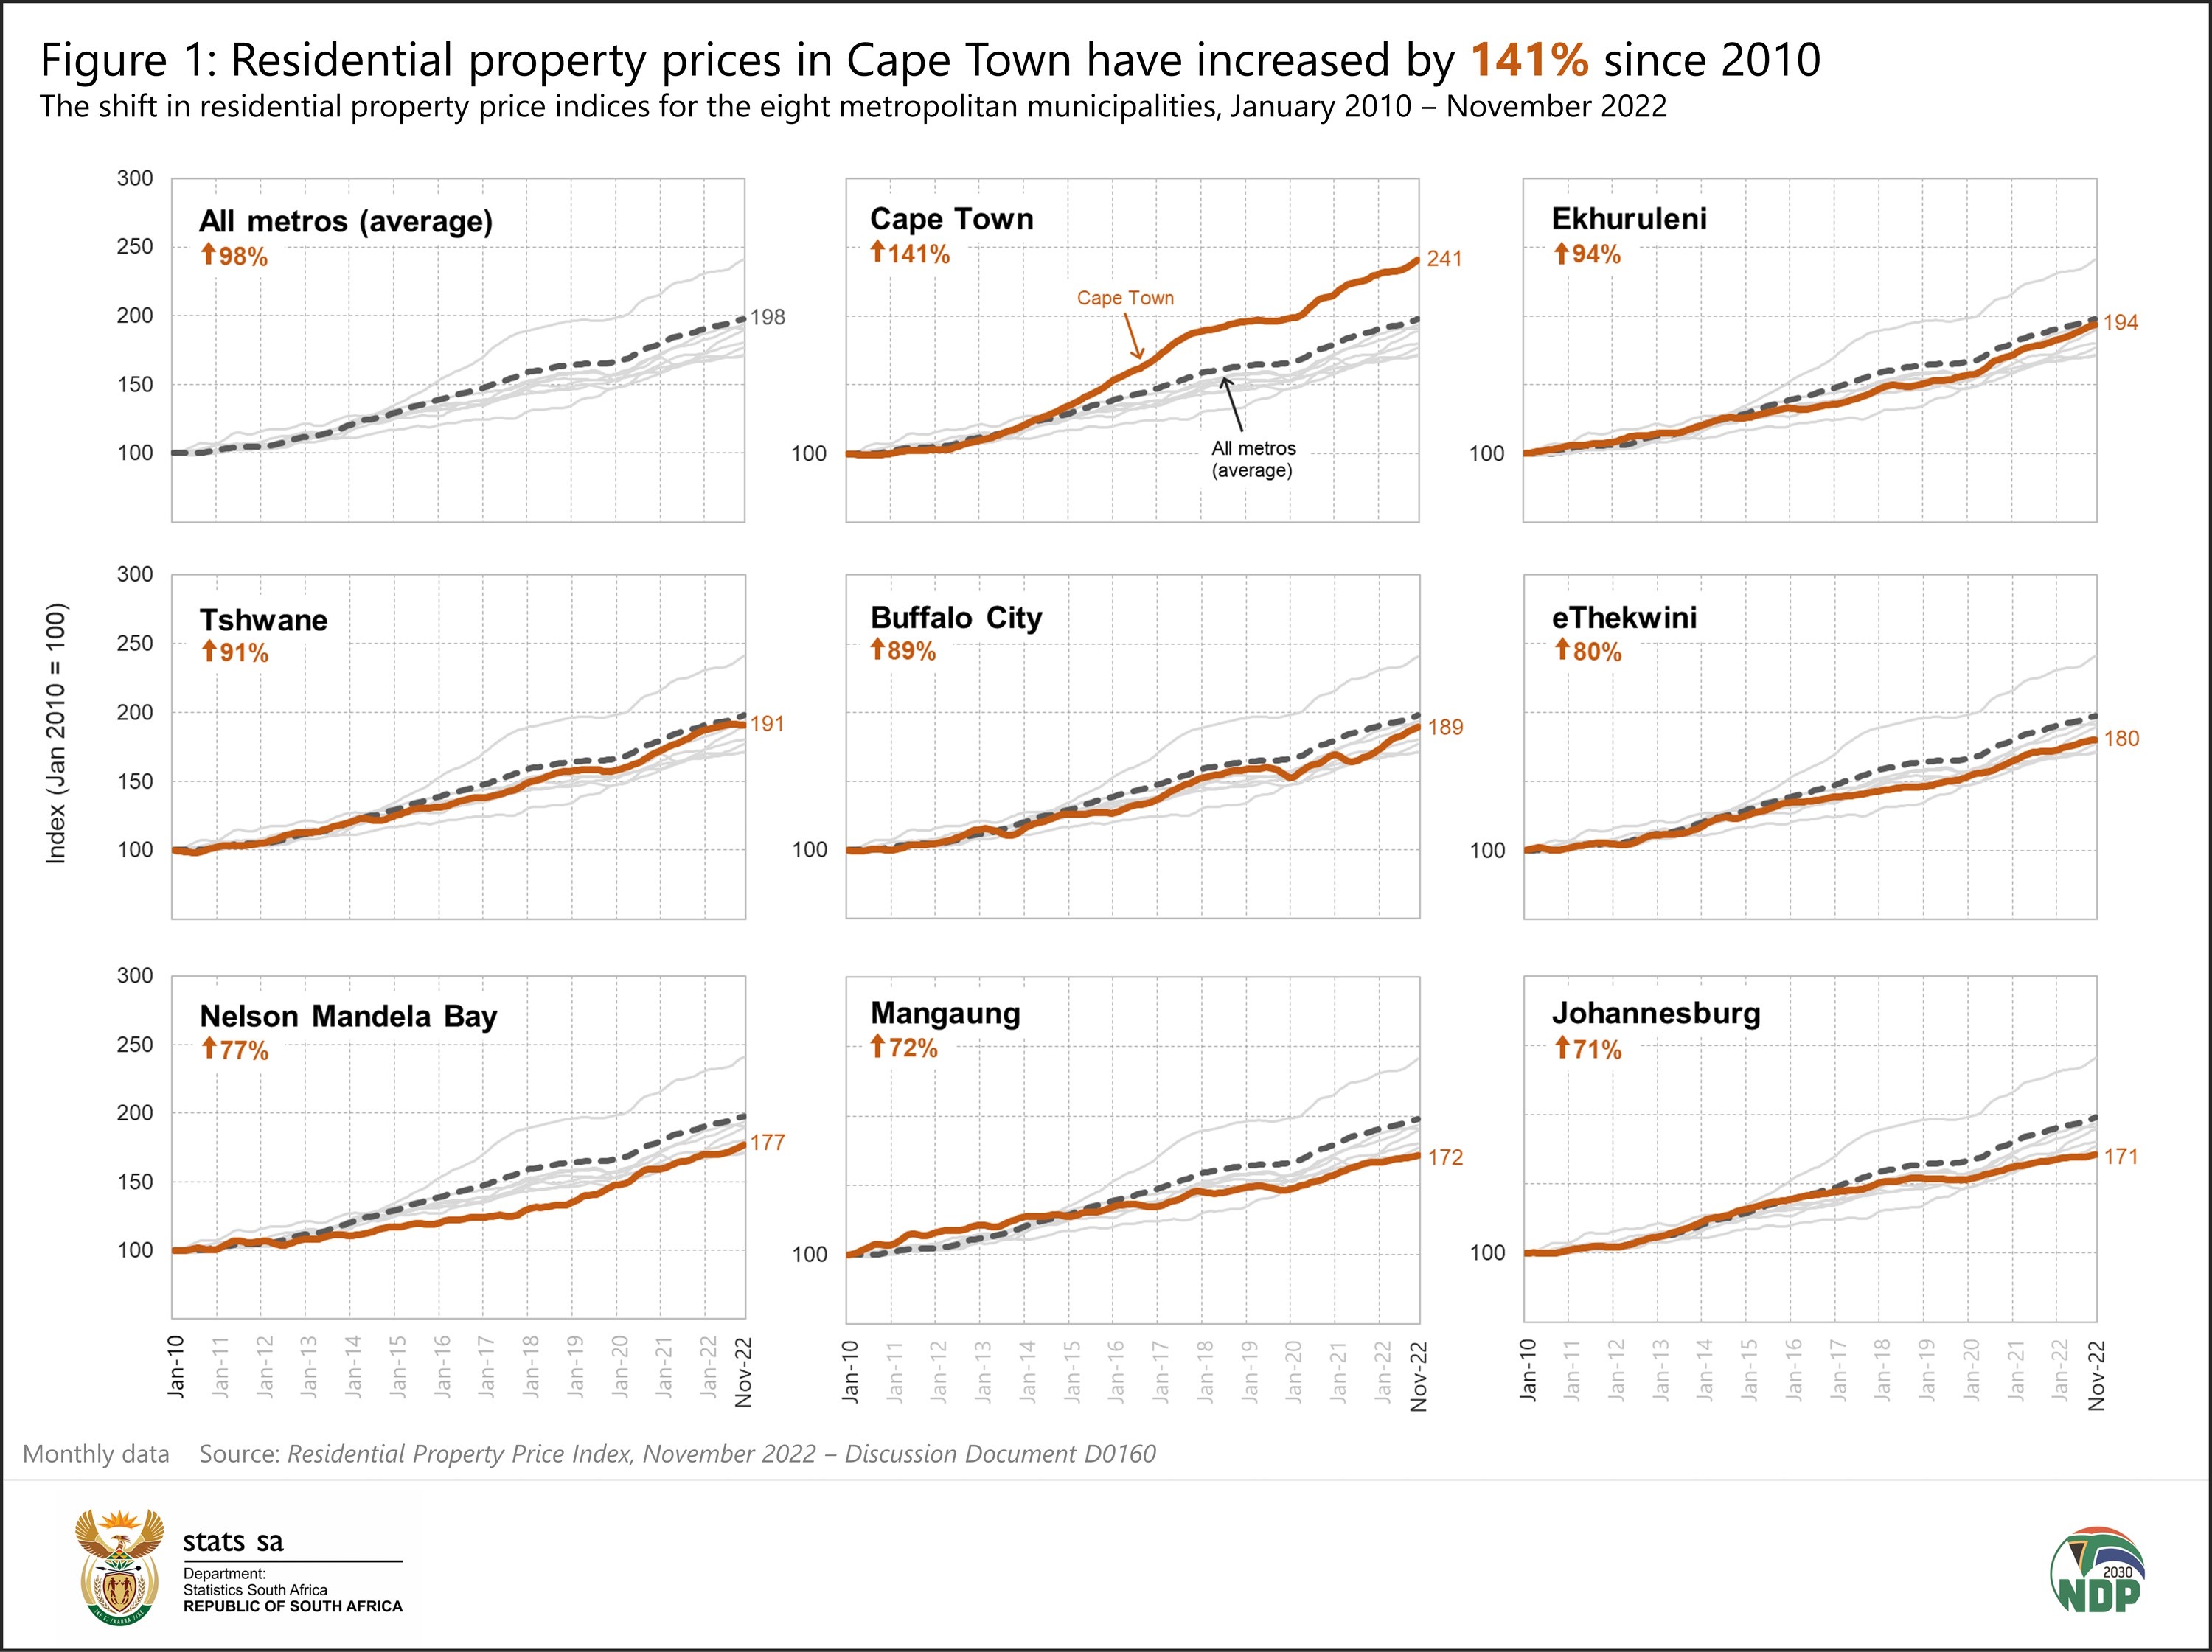
Since 2010, residential property prices have grown by 141% in the City of Cape Town, outstripping other metropolitan municipalities (Figure 1). Since August 2014, price increases in Cape Town were consistently higher than other metros. After remaining relatively flat in 2018 and 2019, prices surged further. The price index for the City of Johannesburg, on the other hand, recorded the slowest increase over this period, with residential property prices rising on average by 71%.1
Measuring changes in property prices
Figure 1 is based on the new set of RPPIs published by Stats SA. Measuring changes in residential property prices are becoming increasingly important on a global scale, with various countries using the RPPI in measures of economic growth, inflation targeting, and estimates of wealth. Noting a data gap in South Africa, Stats SA partnered with the South African Reserve Bank (SARB) in 2018 to begin the process of creating a local version of the index.
The RPPI measures the change in prices for houses, townhouses and flats that are purchased by private individuals. Stats SA calculates the index from records of property transactions registered with the Deeds Office. Both new and existing properties are included in the index. The 2022 indices are weighted according to the value of sales in 2020, and will be updated annually.
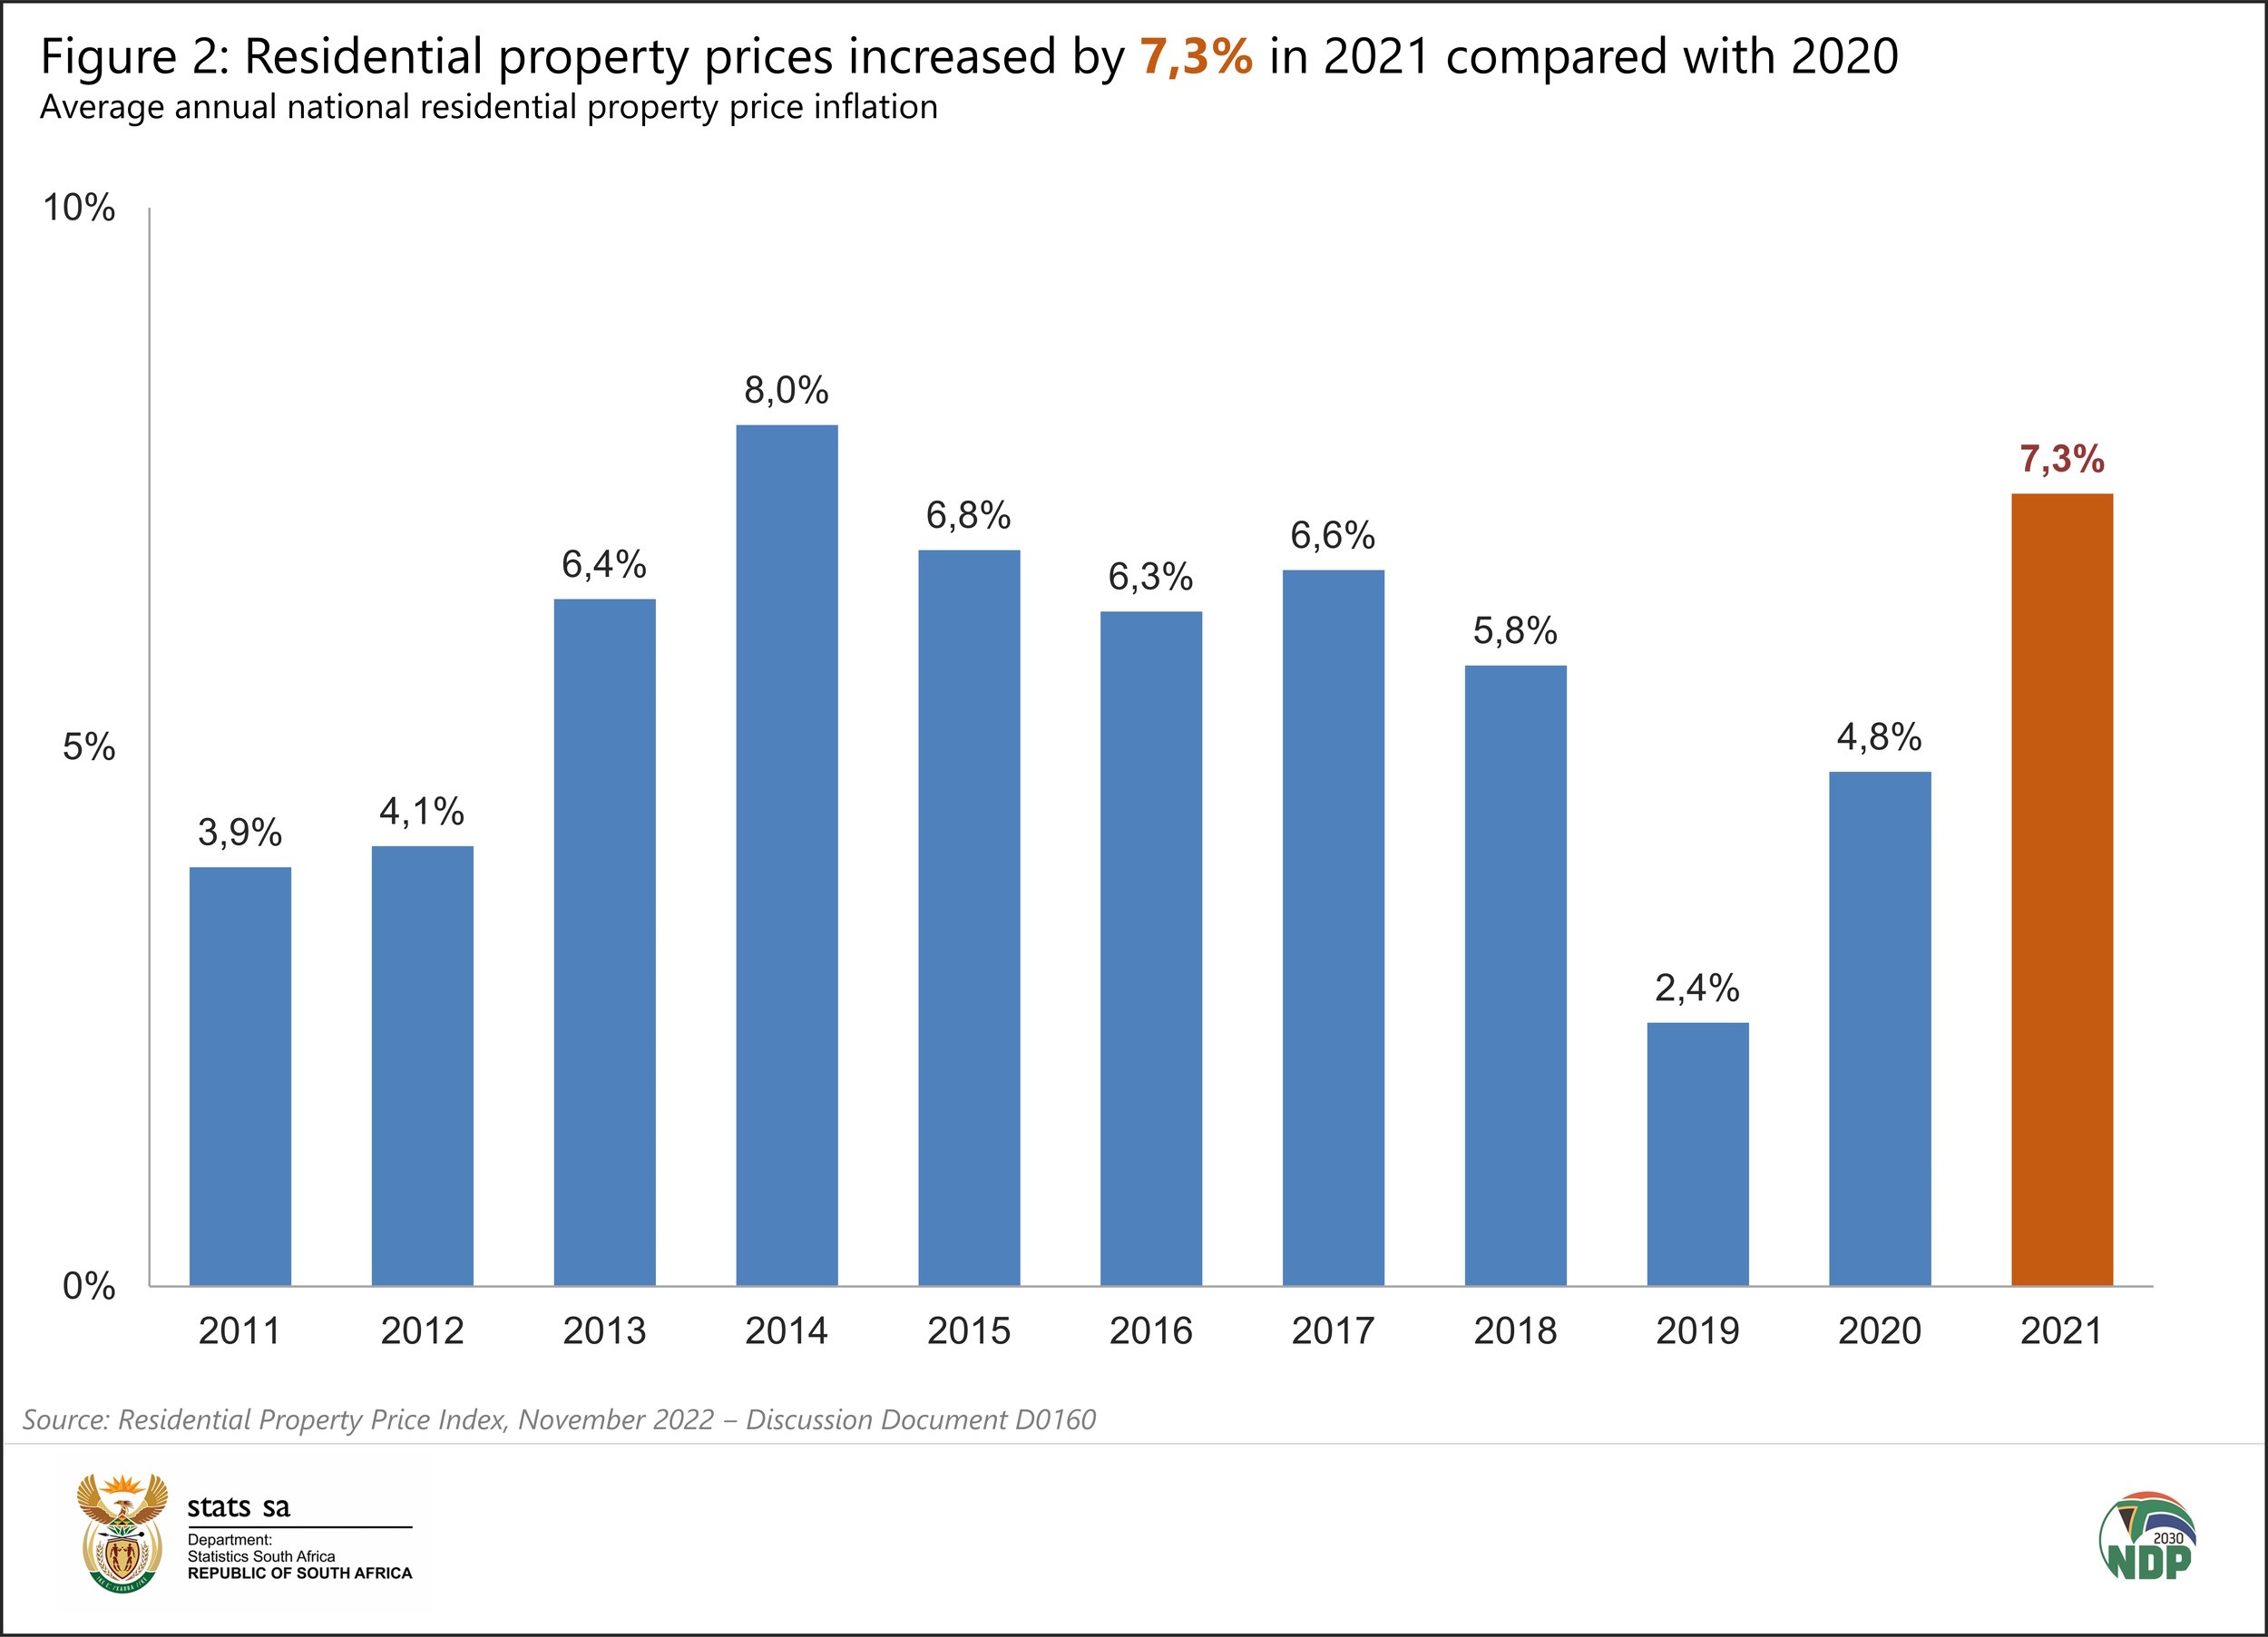
Figure 2 illustrates average annual residential property price inflation for the country as a whole. Residential property prices increased by 7,3% in 2021 compared with 2020. Residential property inflation hit a high of 8,0% in 2014 and slid to a low of 2,4% in 2019.
RPPI for November 2022
Nationally, residential property prices increased by 5,8% in the 12 months to November 2022, according to the latest RPPI statistical release. Prices increased by 7,4% in Western Cape and by 3,6% in Gauteng over this period. The City of Cape Town and Ekurhuleni were the main contributors to the annual inflation rate for all metropolitan areas in November.
We would like your feedback
The RPPI discussion documents, available here for download, are labeled experimental in nature with the purpose of inviting comment on the methodology, the range of data provided, and the way the figures are presented. An associated methodology document, outlining the nuts and bolts of how the RPPI is calculated, is available here. The data will be published on a monthly basis within five months of the reference period.
If you would like to comment on the RPPI, please contact Matlhatsi Mogalanyane at Matlhatsir@statssa.gov.za or Patrick Kelly at patrickke@statssa.gov.za.
1 The RPPI measures the rate at which prices change. It does not describe differences in the levels of prices.
Similar articles are available on the Stats SA website and can be accessed here.
For a monthly overview of economic indicators and infographics, catch the latest edition of the Stats Biz newsletter here.