
Safeguarding every drop: Profiling South Africa’s Strategic Water Source Areas
Water outages across the country have focussed attention on water as a vital resource. South Africa is a semi-arid country, with only a few natural source areas for water. These areas, referred to as Strategic Water Source Areas (SWSAs), provide much of the water that flows from our taps. SWSAs can be thought of as ecological infrastructure and are as important as built infrastructure for water such as dams.
Our nation’s “water factories”
SWSAs are areas of the country that provide large volumes of water per unit area. They provide either surface water or groundwater (or both), making them vitally important assets for ensuring water security. Covering only 8% of national land area, the water from SWSAs feed our rivers and dams, supporting half of the nation’s population, two thirds of economic activity, 70% of irrigated agriculture and more than 90% of urban consumers.
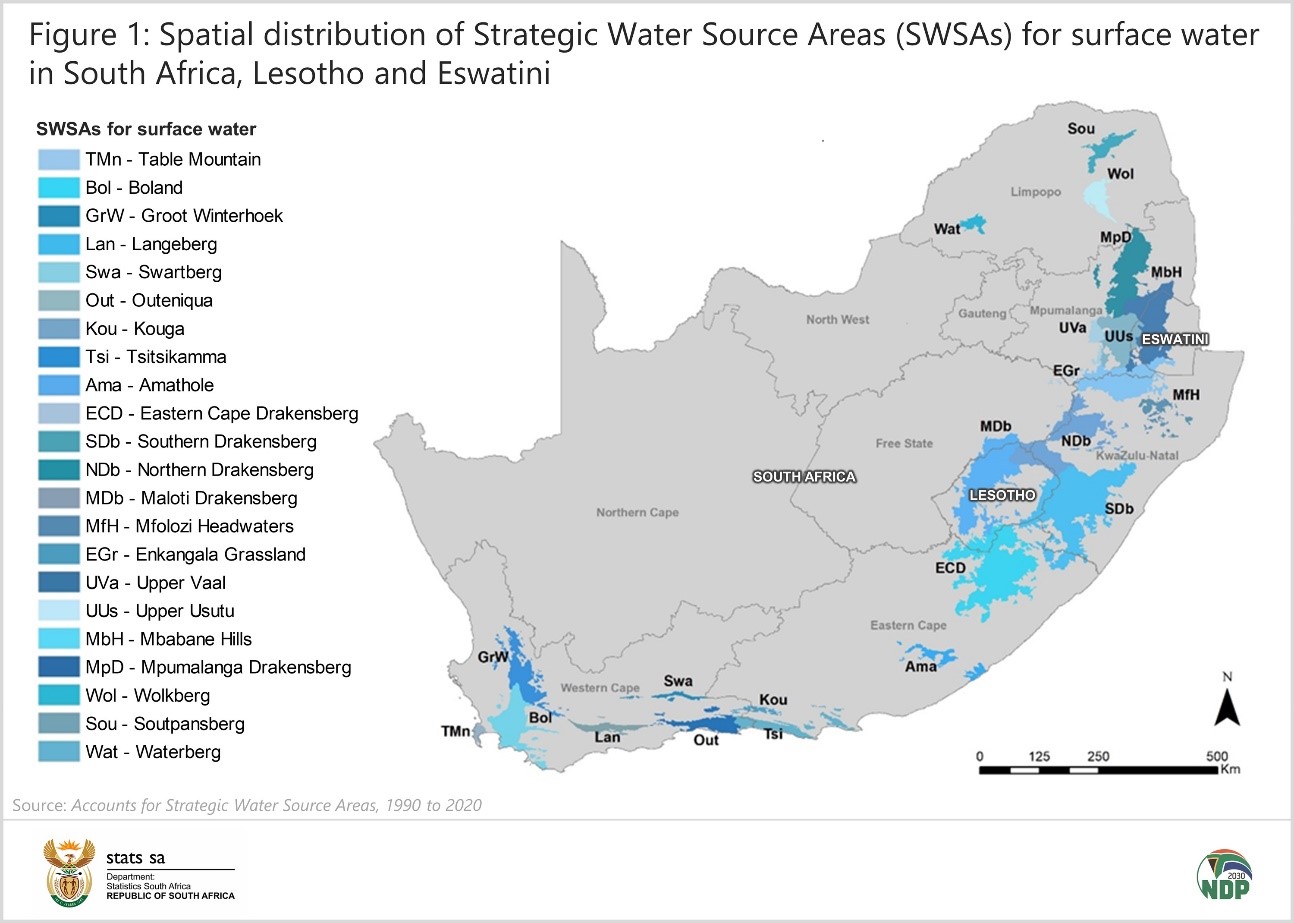
The recently released discussion document, Accounts for Strategic Water Source Areas, 1990 to 2020, provides a wealth of data on South Africa’s 22 SWSAs. These areas are found mainly in the eastern and south-western parts of the country, many of them located along the escarpment (Figure 1). Seven SWSAs are transboundary (four shared with Lesotho and three with Eswatini). The discussion document focusses on the SWSAs (and parts of transboundary SWSAs) that fall within South Africa.
SWSAs vary greatly in size. The largest is Southern Drakensberg SWSA in the east, covering 20 137 km2. This is slightly smaller than the country of Slovenia. Almost 92% of Southern Drakensberg SWSA is situated in South Africa, with the rest occurring in Lesotho. The smallest is Table Mountain SWSA in the Western Cape, covering 473 km2.
Socio-economic activity within SWSAs can have a profound impact on the ecological condition of water-related ecosystems in these areas, such as rivers and wetlands and their associated catchments. Factors such as cultivation, urbanisation, erosion and pollution can affect both the quality and quantity of the water that these ecosystems provide. The key to sustaining the health of water-related ecosystems, and in turn SWSAs, is to ensure that these areas remain in a predominantly natural or semi-natural state. There is also a need to ensure that the use and management of land, rivers and wetlands in SWSAs does not compromise their ability to provide water.
A first for South Africa, the discussion document uses data on the location of SWSAs in tandem with other time series datasets covering a 30-year period. This provides valuable glimmers of insight into the state of SWSAs, particularly in the context of land cover and legal protection.
The well-being of our SWSAs
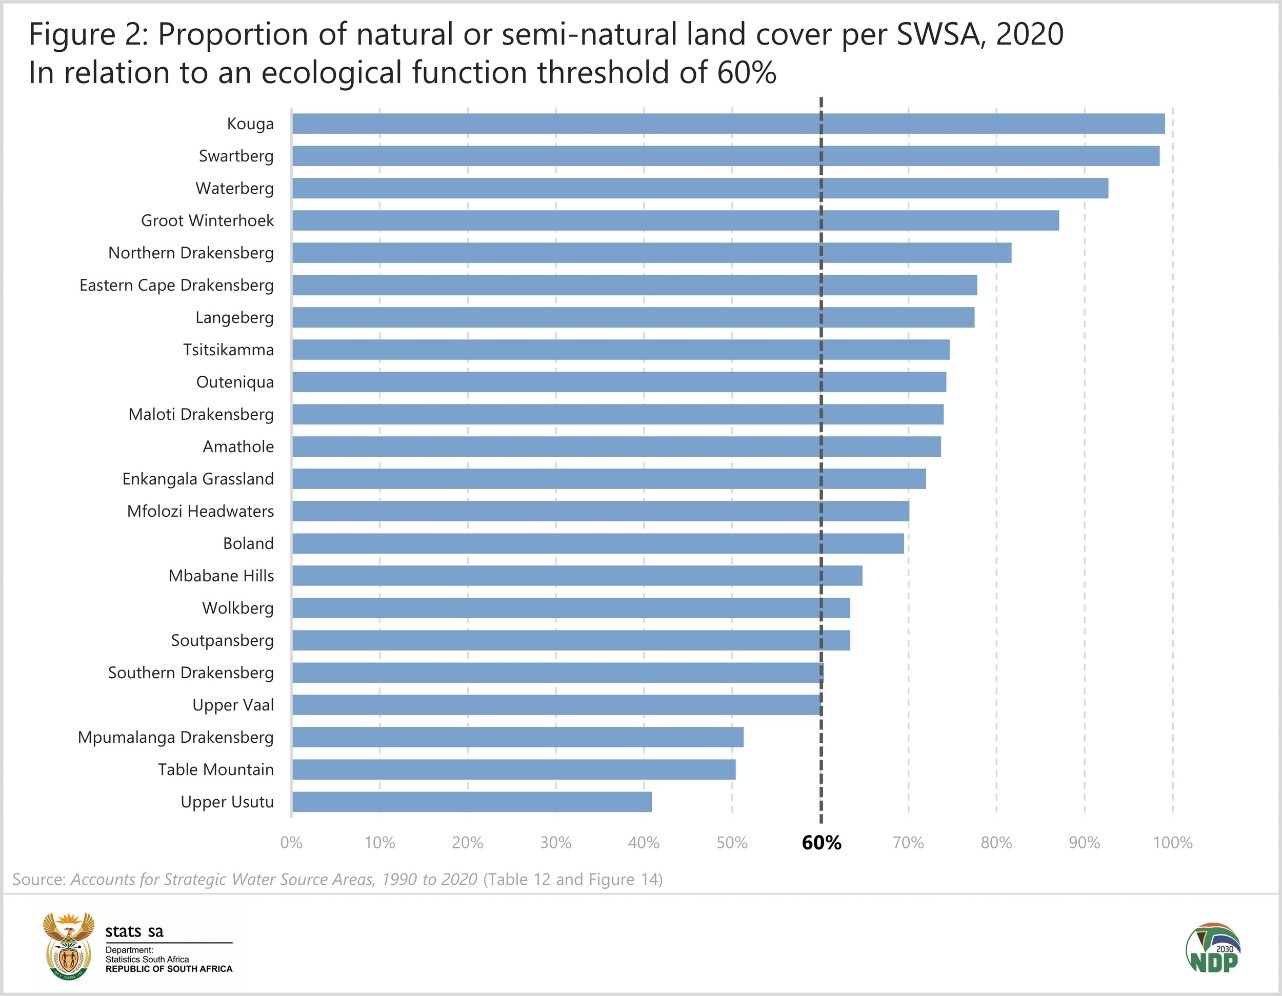
Ecosystems begin to take strain as natural land cover declines, usually as a result of conversion to intensive land uses such as built up or cultivated areas. As a rule of thumb, ecological functioning may begin to break down when natural land cover declines to a point where it covers less than 60% of a landscape or catchment.
An analysis of the SWSA data together with the South African National Land Cover dataset1 shows that natural or semi-natural land cover has declined below 60% in three SWSAs: Upper Usutu (40,9%), Table Mountain (50,4%) and Mpumalanga Drakensberg (51,3%), suggesting that ecosystems in these SWSAs are under pressure. Figure 2 shows that a further five SWSAs find themselves close to the threshold: Upper Vaal (60,1%), Southern Drakensberg (60,4%), Soutpansberg (63,4%), Wolkberg (63,4%) and Mbabane Hills (64,8%), putting their ecological integrity at risk.
Additional land cover information is available for each SWSA, such as the extent of mining, timber plantations, commercial field crops, subsistence crops, orchards and vines, waterbodies and urban settlements.
The extent of legal protection
South Africa has several protected area types that are legally recognised, including National Parks, Nature Reserves, Special Nature Reserves, Protected Environments, Mountain Catchment Areas, Forest Nature Reserves, Forest Wilderness Areas and World Heritage Sites.2 The South African Protected Areas Database, a spatial inventory of these areas, was used to track the proportion of each SWSA protected from 1990 to 2020.
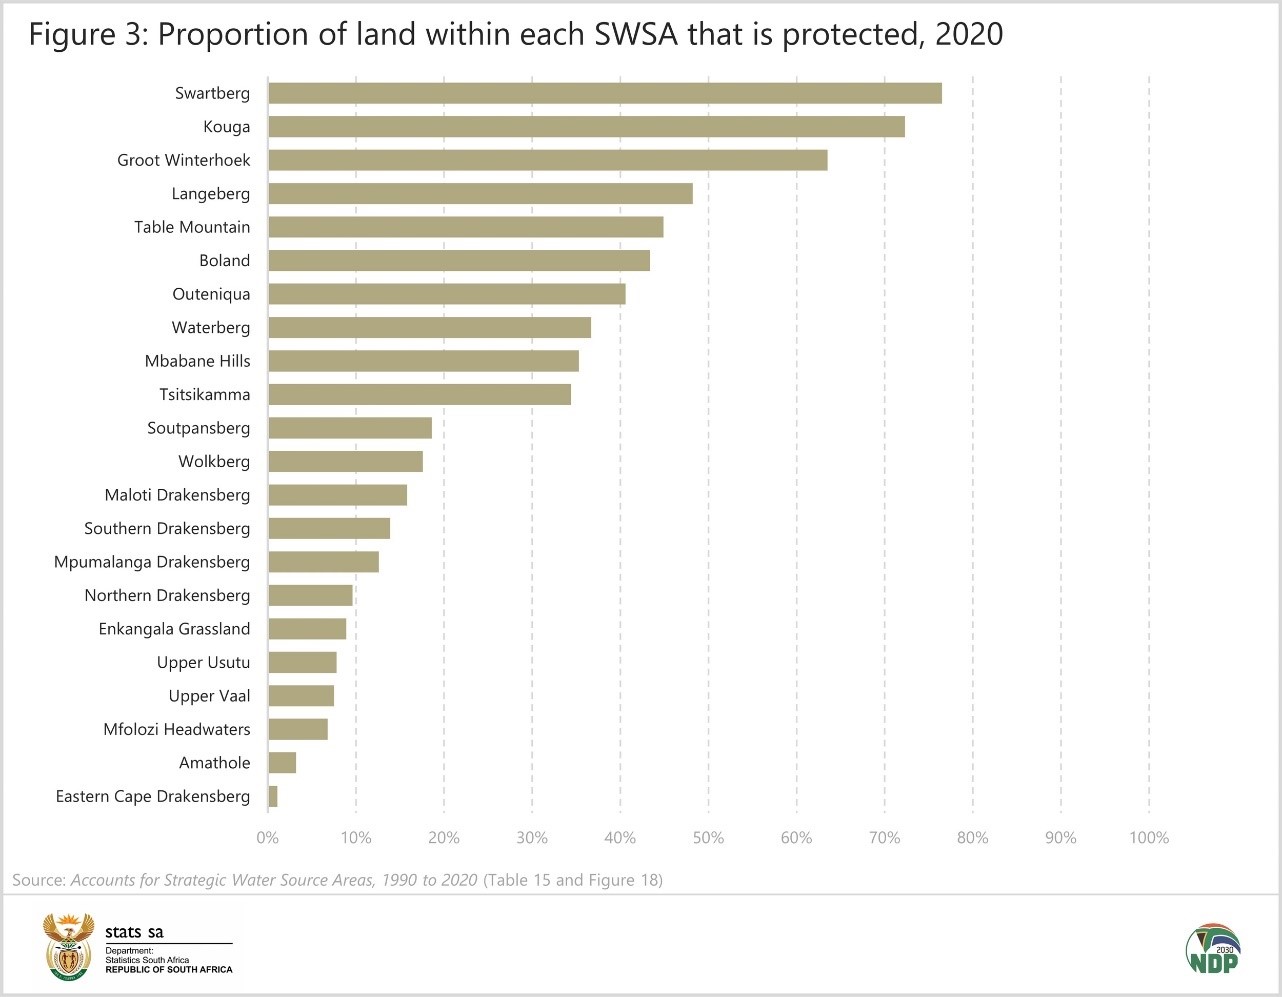
Overall, 18,9% of the land in SWSAs was protected in 2020, up from 13,9% in 1990. SWSAs that had the highest proportion protected in 2020 (Figure 3) were Swartberg (76,5%), Kouga (72,3%) and Groot Winterhoek (63,5%). These three SWSAs were also among the five SWSAs with the highest proportion of natural or semi-natural land cover. SWSAs with the lowest proportion of land that was protected were Eastern Cape Drakensberg (1,1%), Amathole (3,2%), Mfolozi Headwaters (6,8%), Upper Vaal (7,5%) and Upper Usutu (7,8%).
Securing our vital water sources
SWSAs provide life. Not only for the landscape of South Africa but also for its people and its economy. The discussion document provides detailed profiles of each of South Africa’s 22 SWSAs. These data enable us to make informed decisions towards their protection, management and restoration. Water is a resource that we cannot do without. Sustaining the ecological integrity of our SWSAs will help us meet our water needs. This will become all the more important as climate change impacts on the reliability and predictability of rainfall.
For more information, download the Accounts for Strategic Water Source Areas, 1990 to 2020 discussion document, and associated Excel data, here. This is the third discussion document published as part of the Natural Capital series. Natural Capital Accounting is jointly led by Stats SA and the South African National Biodiversity Institute (SANBI) in partnership with the Department of Forestry, Fisheries and the Environment (DFFE). More information on Natural Capital Accounting in South Africa is available here.
1 The South African Land Cover dataset was used to compile the Land and terrestrial ecosystem accounts, 1990 to 2014 discussion document, the first document published in the Natural Capital series. An overview of the data, as well as a link to the document, can be found here.
2 The South African Protected Areas Database was used to compile the Accounts for Protected Areas, 1900 to 2020 discussion document, the second document published in the Natural Capital series. More information can be found here.
Similar articles are available on the Stats SA website and can be accessed here.
For a monthly overview of economic indicators and infographics, catch the latest edition of the Stats Biz newsletter here.