
Marriages on the decline in South Africa
Marriage has usually been considered a legally and socially approved union that is regulated by laws, rules, customs and beliefs. However, global and local trends have seen marriages decreasing each year. Marriages are becoming less common, people are marrying later and unmarried couples are increasingly choosing to live together instead of tying the knot.
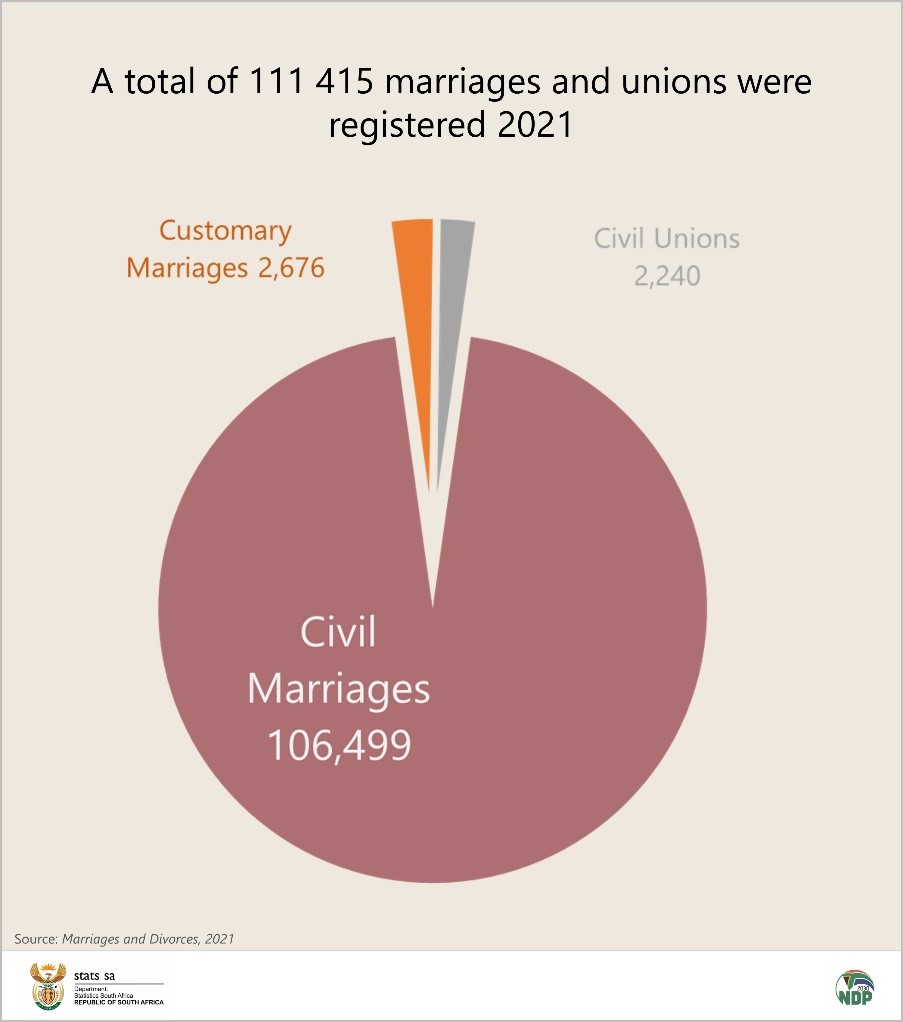
Information contained in Statistics South Africa’s latest release, Marriages and Divorces, 2021, states that in South Africa, 106 499 marriages took place in 2021 compared to 161 112 in 2012. Nearly a quarter (24,9%) of the civil marriages registered in 2021 were from Gauteng and the lowest was in Northern Cape with 3,0%.
While you may be tempted to believe that you have more chances of getting married if you live in Gauteng than in Northern Cape, this is not necessarily the case. While Gauteng has more than twelve times the population of the Northern Cape, the rate at which marriages occur is lower.

The General Marriage Rate (GMR) is the number of people who got married in that year divided by the population aged 15 years and above for every 100 000 population. Using this measure, you are more likely to be married in the Northern Cape at 347 marriages for every 100 000 persons than anywhere else in the country, followed by Free State at 323 then Western Cape at 300. You are far less likely to be married in Mpumalanga at a rate of 158 marriages for every 100 000 population.
In terms of Customary marriages, 2 676 customary marriages were registered at the Department of Home Affairs in 2021, compared to 1 585 in 2020. You are more likely to be married in Limpopo at 18 marriages for every 100 000 population, followed by Mpumalanga with 11, then Kwa-Zulu Natal at 9 marriages for every 100 000 population. The median age of bridegrooms in customary marriages was 36 years in 2021, while that of brides was 29 years in the same period.
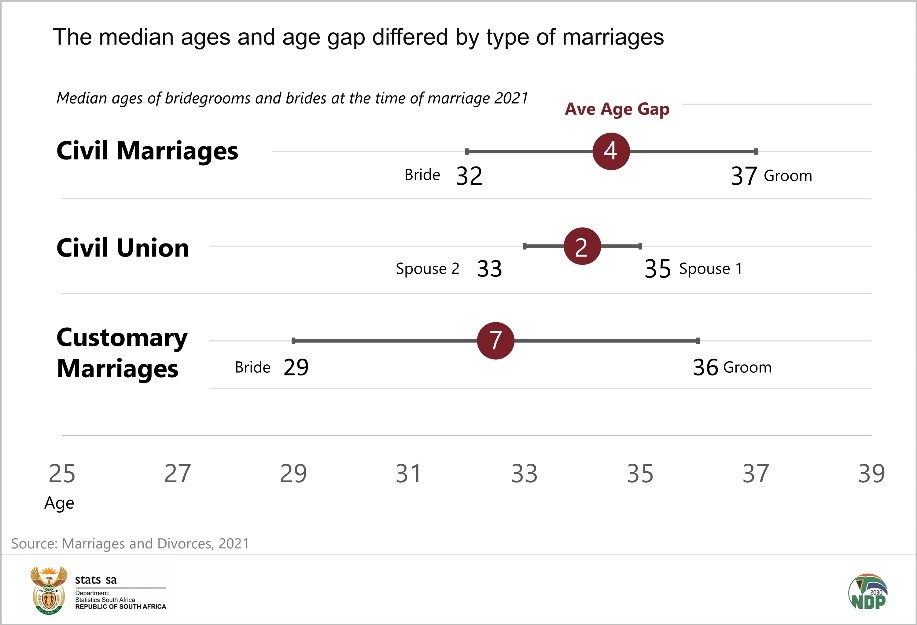
In contrast to customary marriages, the number of civil unions registered in South Africa increased by 52,3% in 2021.There were 2 240 marriages registered in 2021 compared to 1 471 in 2020. Using the GMR, you are more likely to be in a civil union in Gauteng and Western Cape at 10 marriages per 100 000 population than all other provinces that experience less than 3 civil union marriages per 100 000 population. Civil unions are almost non-existent in Limpopo. The median age of spouses-2 was 33 years in 2021 while the median age of spouses-1 was 35 years during the same period. Over the five-year period, the differences in the median ages of spouses-1 and spouses-2 has remained two years. A total of 111 415 marriages were registered in South Africa in 2021.
While marriages in SA decreased, divorces increased by 13,1% since 2020. 18 208 divorces were granted in 2021. The General Divorce Rate (GDR) is the number of people who are getting divorced in that year divided by the population aged 15 years and above for every 100 000 population.
Most divorces are experienced in the Western Cape with 54 divorces for every 100 000 population, followed by the Northern Cape at 50 marriages for every 100 000 population, then Free State at 47. The North West has the least GDR at 15 divorces for every 100 000 population. In general, the median age of male divorcees was higher than that of females, regardless of population group, at 45 years for males compared to 41 years for females. More females were affected by divorce at younger ages as compared to male divorcees. Most divorces were from marriages that lasted between zero and nine years, followed by those that lasted between ten and fourteen years. 17 345 children aged less than 18 years were affected by divorces that took place in 2021.
For more information, download the full report here.