
Financial statistics of provincial government
The Financial statistics of provincial government release reports that compensation of employees increased by R23 798 million from R193 669 million in 2010/2011 to R217 467 million in 2011/2012. This increase was mainly due to increased compensation payments by the KwaZulu-Natal, Gauteng and Eastern Cape provincial governments.
Figure 1: Compensation of employees by province: 2011-2012 (Rm, at current prices)
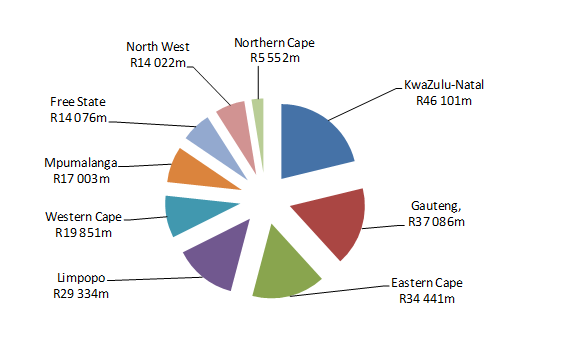
Figure 2 below reflects the compensation of salaries of provincial government employees over a five year period (2008-2012)
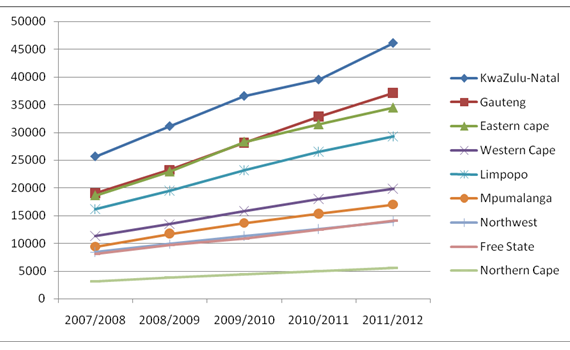
Figure 2: Compensation of employees by province: 2008-2012 (Rm, current prices)
The provincial government is one of the three spheres of government in South Africa (national, provincial, local), each of which plays an important role in ensuring delivery of various government obligations. For the latest provincial government publication, there were 121 reporting units (the number varies from time to time due to mergers, and/or the creation of new units).
The financial statistics of provincial government consist of the aggregated provincial government financial statistics of all nine provinces. This article identifies and explains some of the trends and patterns in provincial government finances.
Provincial governments are responsible for undertaking various functions, namely: general public services; economic affairs; environmental protection; housing and community amenities; public order and safety; health; recreation; culture and religion; education and social protection.
Increase in expenditure on goods and services
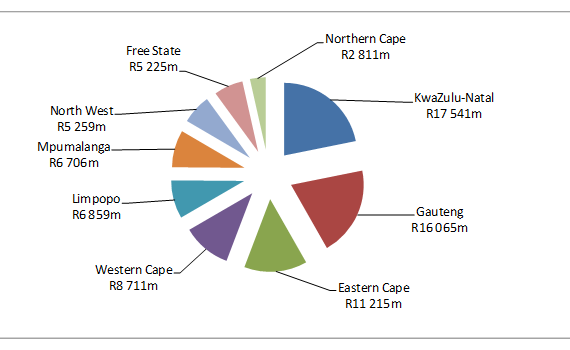
There was also an increase of R7 490 million in purchases of goods and services from R72 892 million in 2010/2011 to R80 382 million in 2011/2012. The increase was mainly due to increased payments by the KwaZulu-Natal, Gauteng and Eastern Cape provincial governments.
Figure 3: Purchases of goods and services by province: 2011-2012 (Rm, at current prices)
A longer term, 5 year, perspective on the purchases of good and service by the provincial governments is discernible from figure 4 below.
Figure 4: Purchases of goods and services by province: 2008 – 2012 (Rm, at current prices)
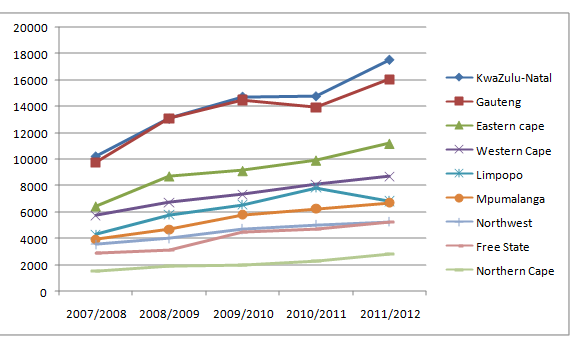
Expenditure on goods and services by the Gauteng provincial government decreased slightly during the fiscal year 2010/2011. The main reasons for the decrease were less spending on consultants, contractors and agency/outsourced services by the Gauteng Department of Health and Social Development and a reclassification of the Devolution of Rates and Taxes grant by the Gauteng Department of Infrastructure Development. In previous years the grant was classified as goods and services.
Expenditure on goods and services by the Limpopo provincial government decreased during the fiscal year ending 2011/2012. The main reasons for the decrease were less spending by the Department of Education on food and food supplies and a decrease in transfers to non-profit institutions (schools). Statistics SA classifies these transfers as goods and services.
Please click here to access the publication
Please click here to access the presentation
For more information on this publication please contact Francois Engelbrecht: