
Seasonally adjusting the components of retail trade
Retail trade statistics have a strong seasonal pattern. For instance, actual retail sales are usually much higher in November and December because of the effect of Black Friday and the festive season. Seasonal adjustment removes these effects based on historical patterns, which helps with the analysis of underlying trends.
Stats SA has published seasonally adjusted estimates for total retail trade for many years. We have now expanded this to include its components, namely general dealers (supermarkets) and other more specialised retailers in food & beverages, medical, clothing, furniture, appliances, hardware, etc.
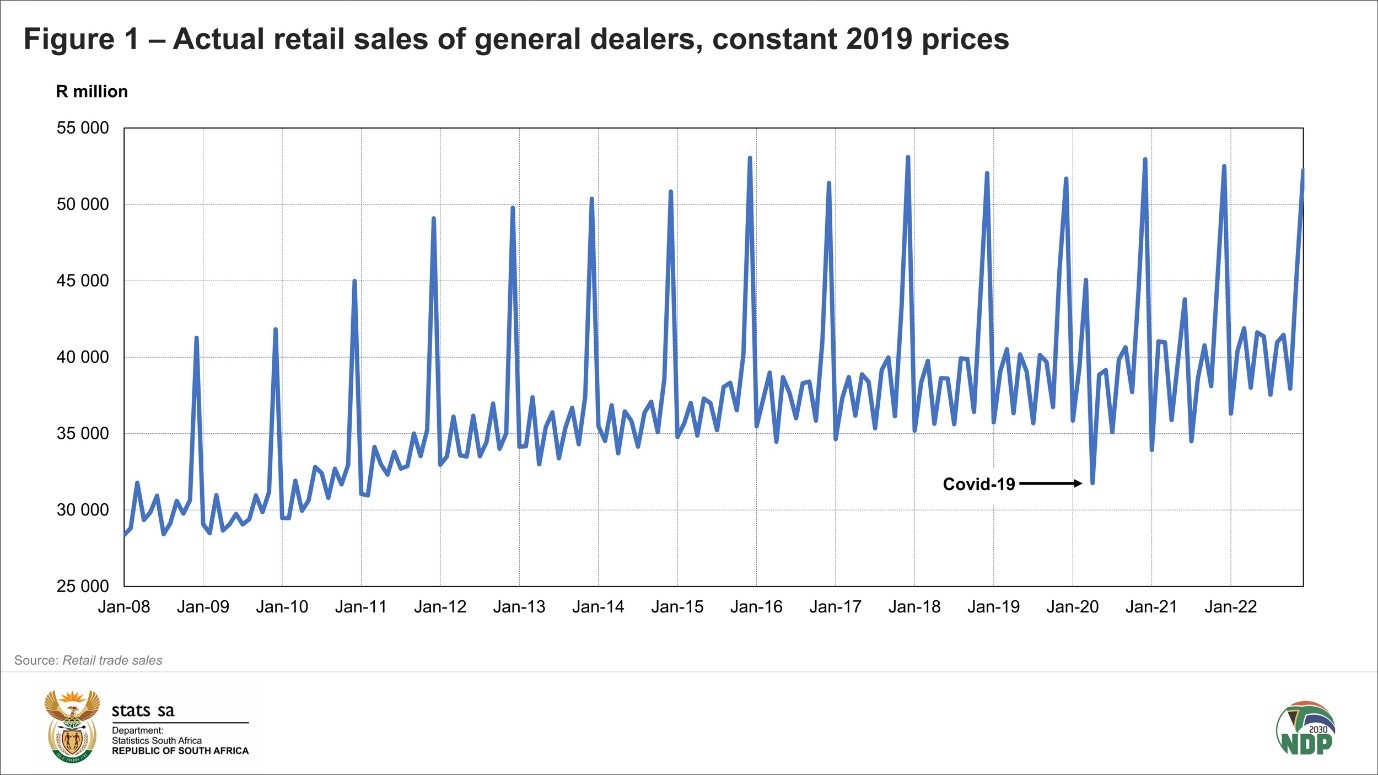
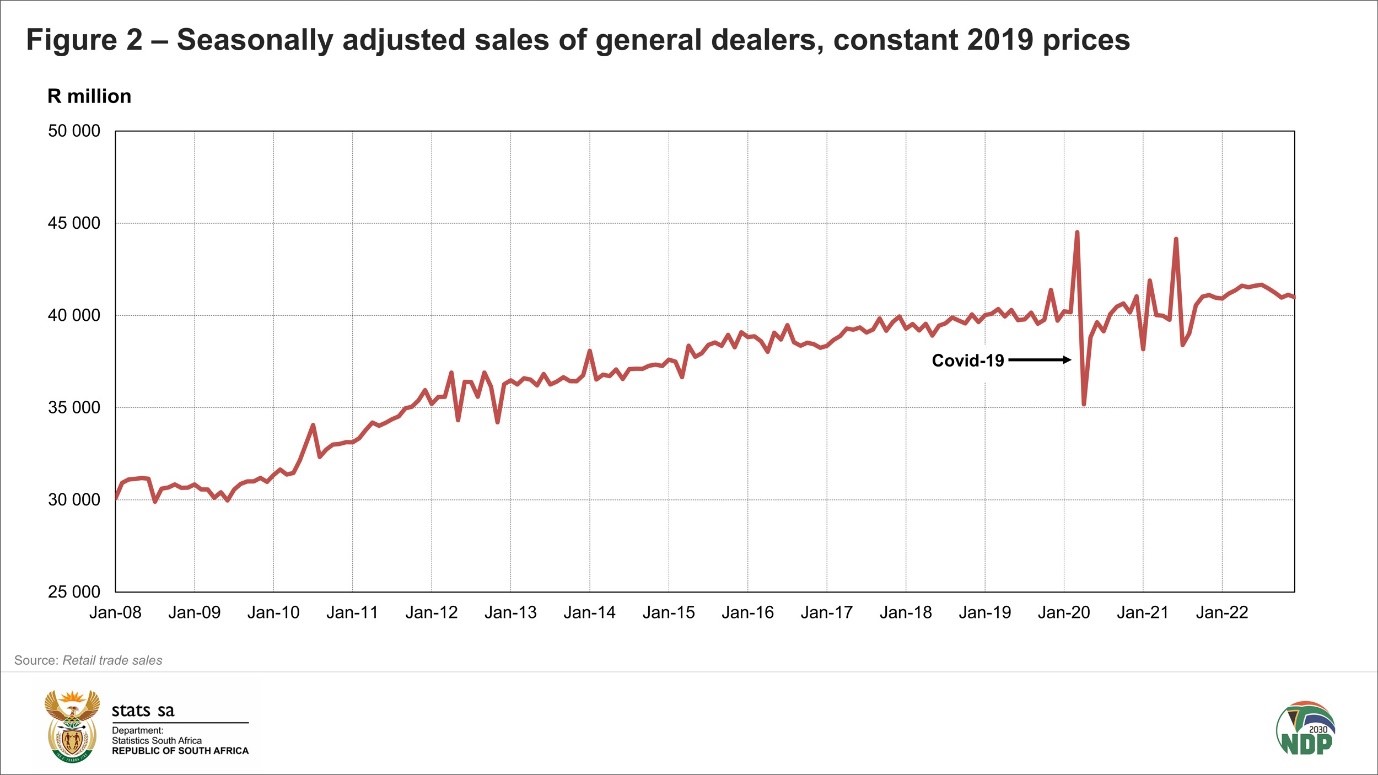
Figure 1 shows general dealers’ actual retail sales (at constant 2019 prices). The underlying trend is quite difficult to see because of the strong seasonal effects. The seasonally adjusted version is shown in Figure 2, in which the trend is much clearer. Also, the Covid-related spikes in 2020 are clearly visible – seasonal adjustment removes seasonal spikes only, not those which are caused by irregular events such as pandemics and natural disasters.
What has changed?
There are two effects that users should note. First, now that we have seasonally adjusted estimates for retail components, it will be easier to analyse and interpret month-on-month changes in total retail trade. This is because, without seasonally adjusting the components, we are not able to identify and analyse the specific types of retailer that impacted the movement in total sales the most. Second, we are able to calculate the seasonally adjusted total by adding up the seasonally adjusted components (known as indirect seasonal adjustment) instead of applying seasonal adjustment techniques directly to the total.
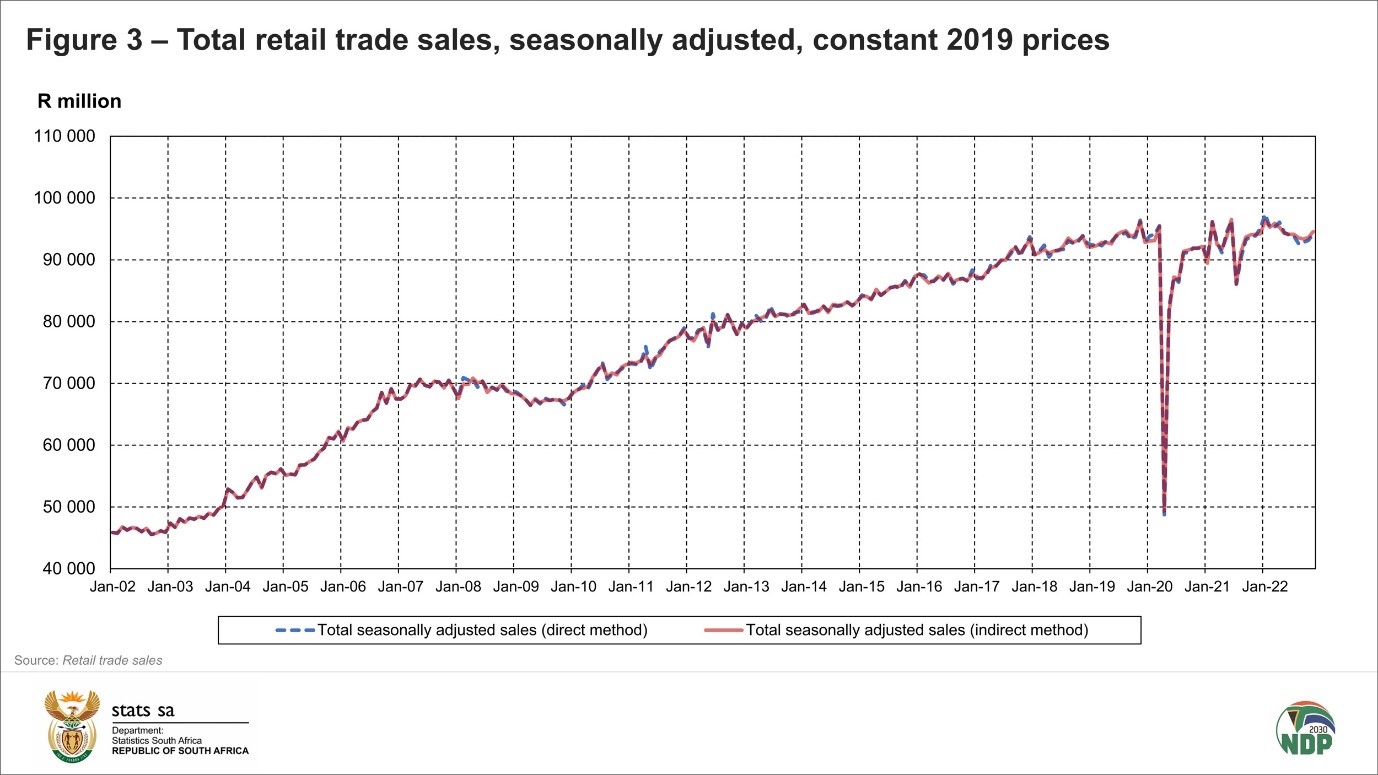
Are the results for the total very different when comparing direct and indirect seasonal adjustment? Both time series are shown in Figure 3. The differences are small. Generally, the indirect method gives slightly more accurate results, because the seasonality of each component is modelled individually, with these nuances feeding through to the total when everything is summed.
The modelling
Stats SA uses the X-12 ARIMA seasonal adjustment program developed by the United States Census Bureau to estimate trend, seasonal and irregular components as well as length-of-month or length-of-quarter, trading day, leap year and Easter effects. By removing the seasonal effects, we can make more meaningful comparisons of economic conditions from period to period. The statistical release provides a link where users can access the methodology note for seasonal adjustment. It can also be accessed here.
The seasonally adjusted components in detail
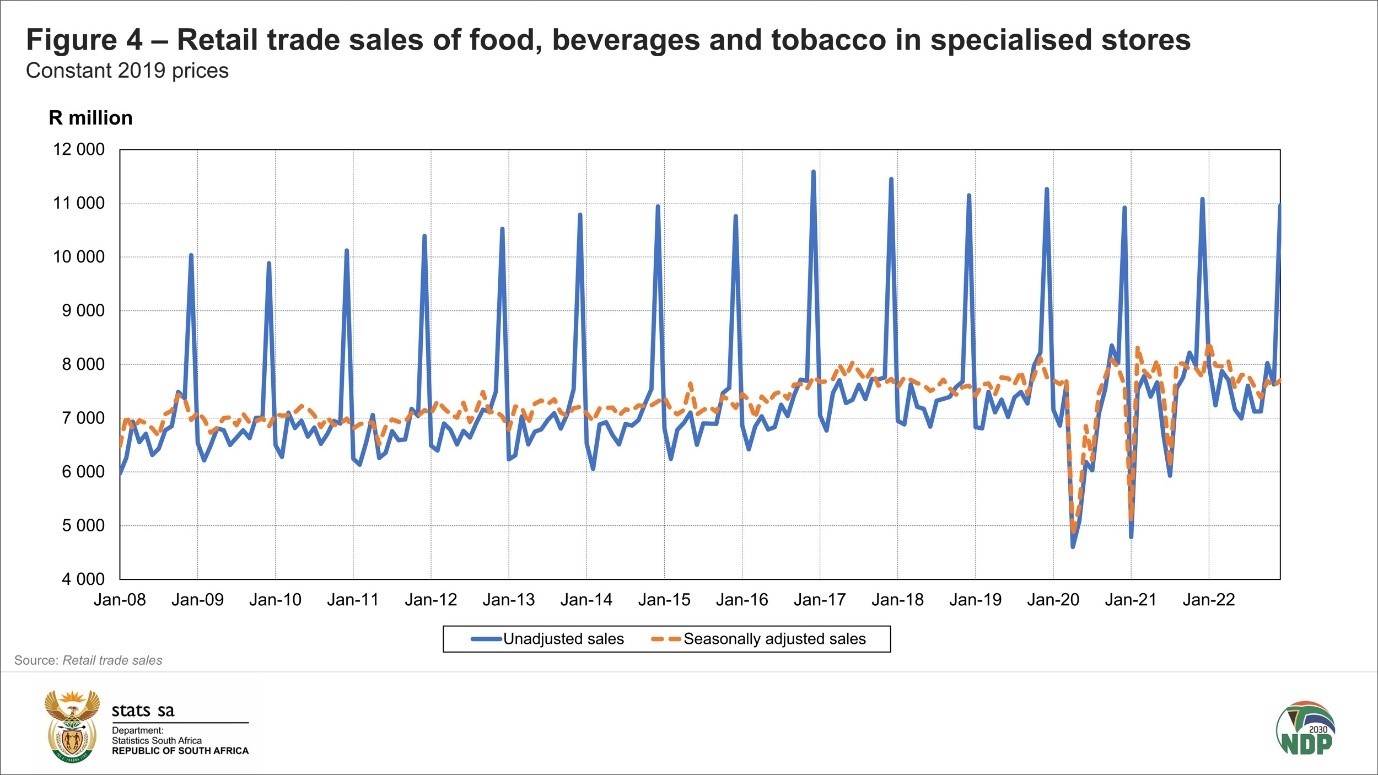
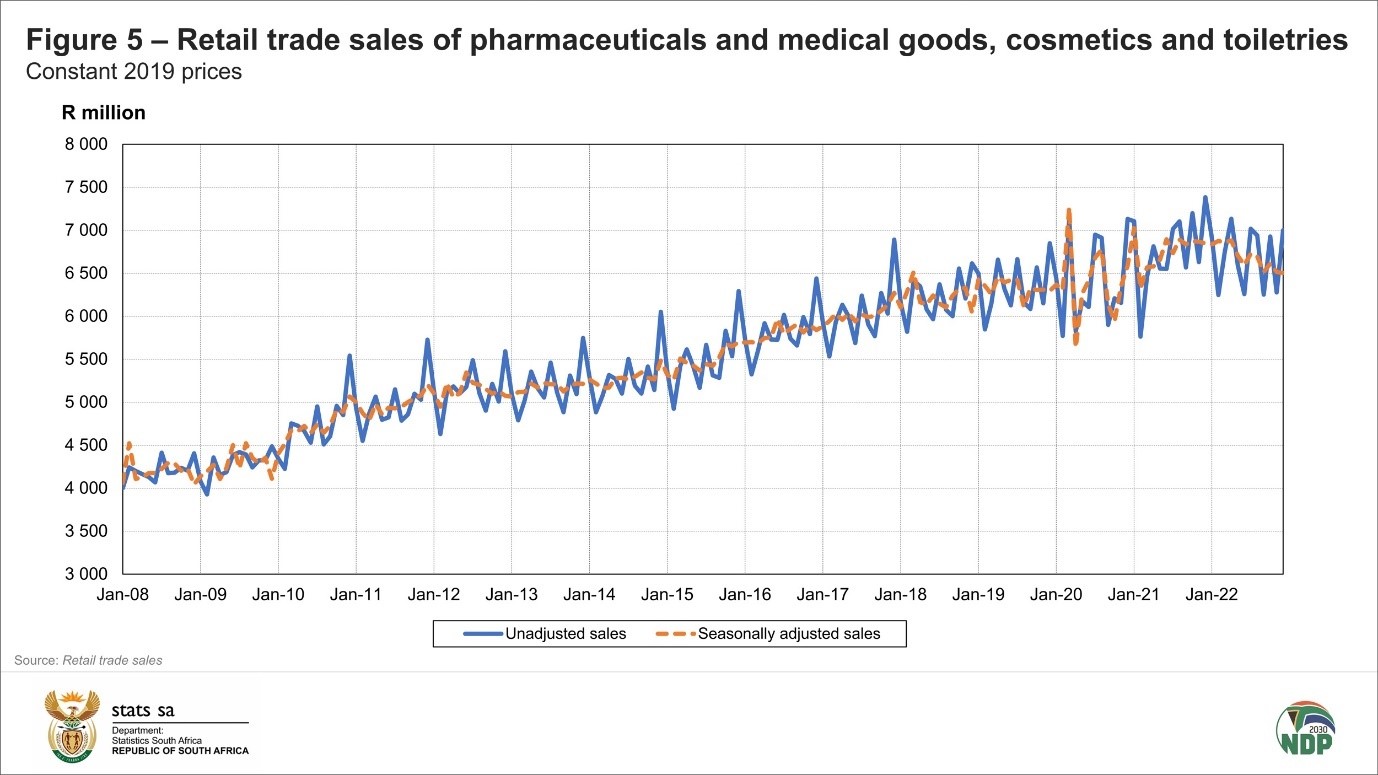
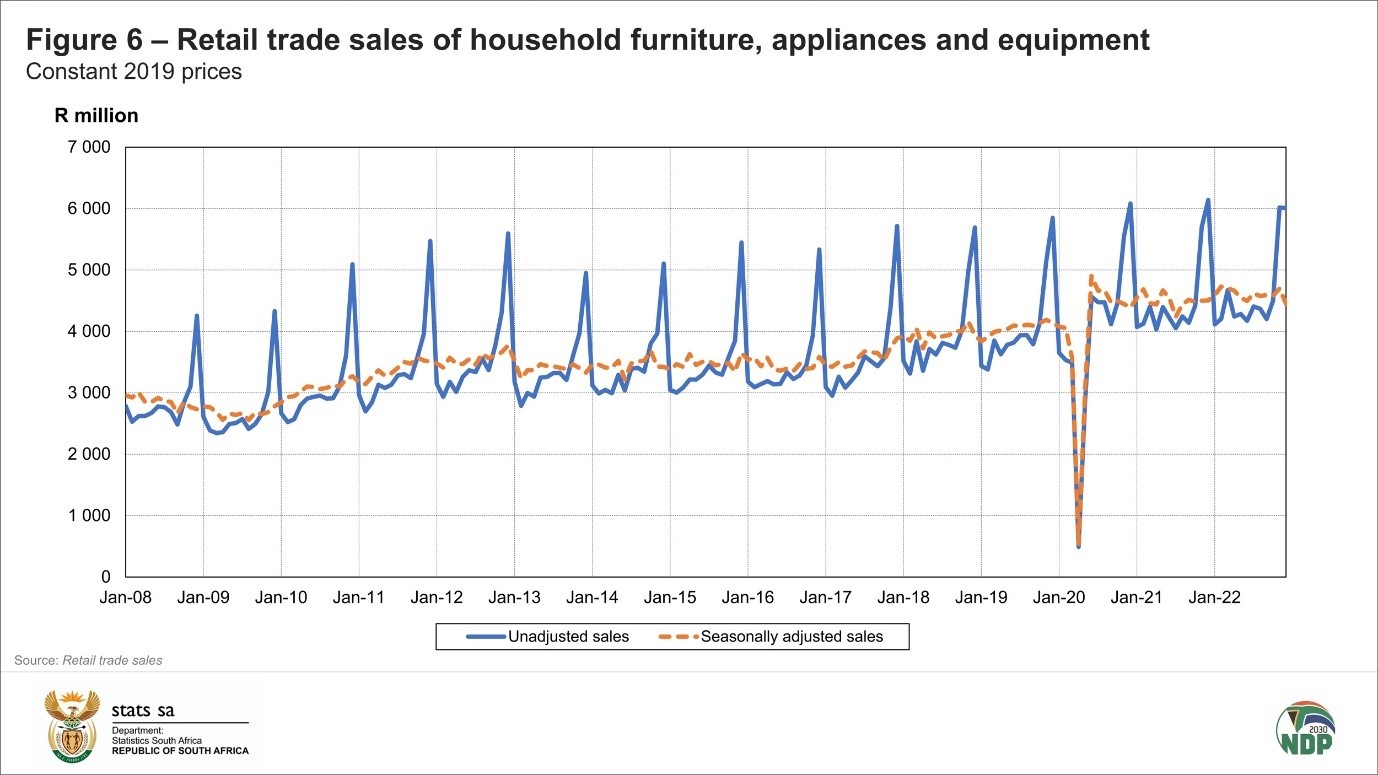
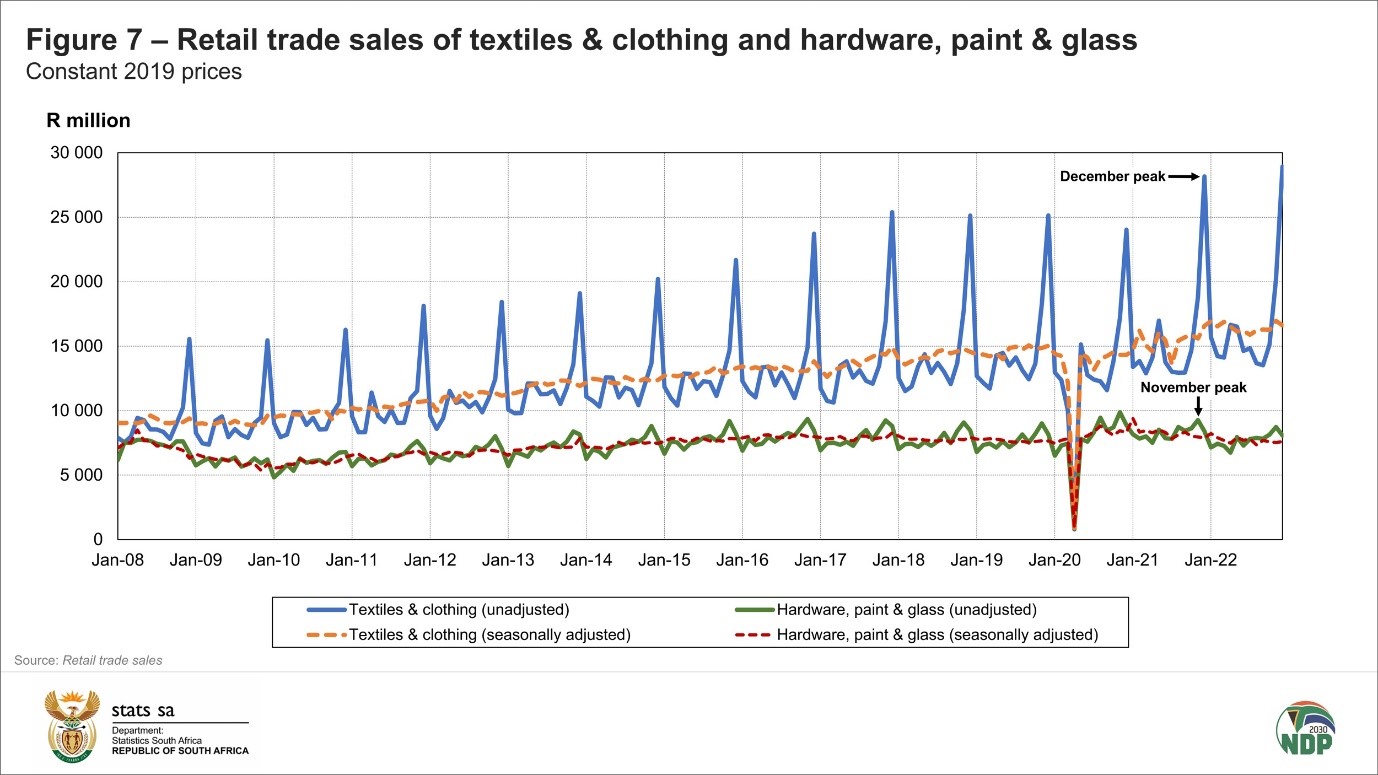
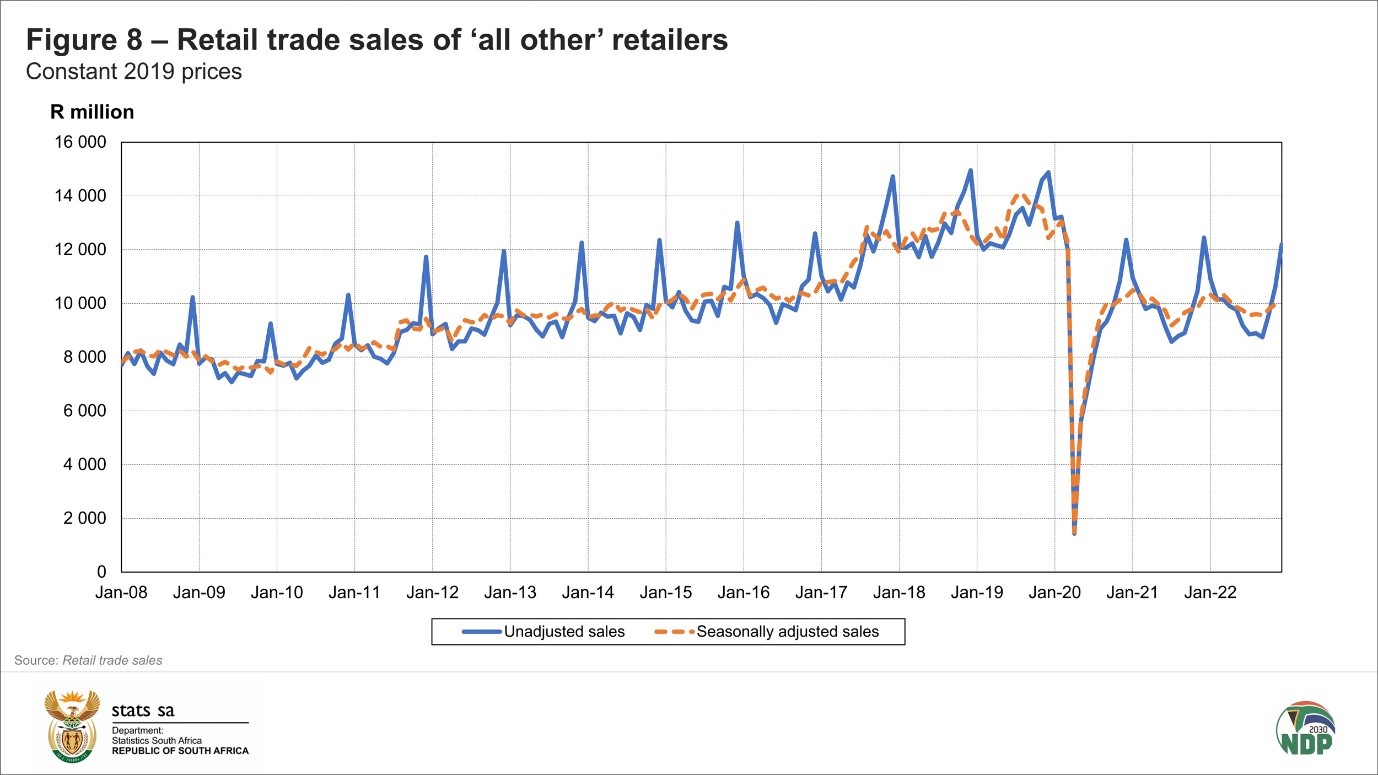
The comparison of actual and seasonally adjusted sales for general dealers is shown in Figures 1 and 2 above. What about the others? The charts below show the seasonal pattern of higher December sales in other types of retailers, namely food and beverages in specialised stores; pharmaceuticals and medical goods, cosmetics and toiletries; textiles, clothing, footwear and leather goods; household furniture, appliances and equipment; and ‘all other’ retailers. However, retailers dealing in hardware, paint, and glass experience their peak sales month in November, as most consumers are on vacation in December, with home improvement projects being the least of their concerns. This November-December contrast is shown in Figure 7.
For more information, download the latest retail trade sales statistical release and Excel data including the detailed seasonally adjusted data here.
Similar articles are available on the Stats SA website and can be accessed here.
For a monthly overview of economic indicators and infographics, catch the latest edition of the Stats Biz newsletter here.