
Inflation cools to 6,9%
Annual consumer inflation slowed for the third consecutive month, decreasing to 6,9% in January from 7,2% in December. A notable fall in the price of fuel was the biggest factor behind the dip in the headline rate. Food inflation, on the other hand, continues to accelerate.
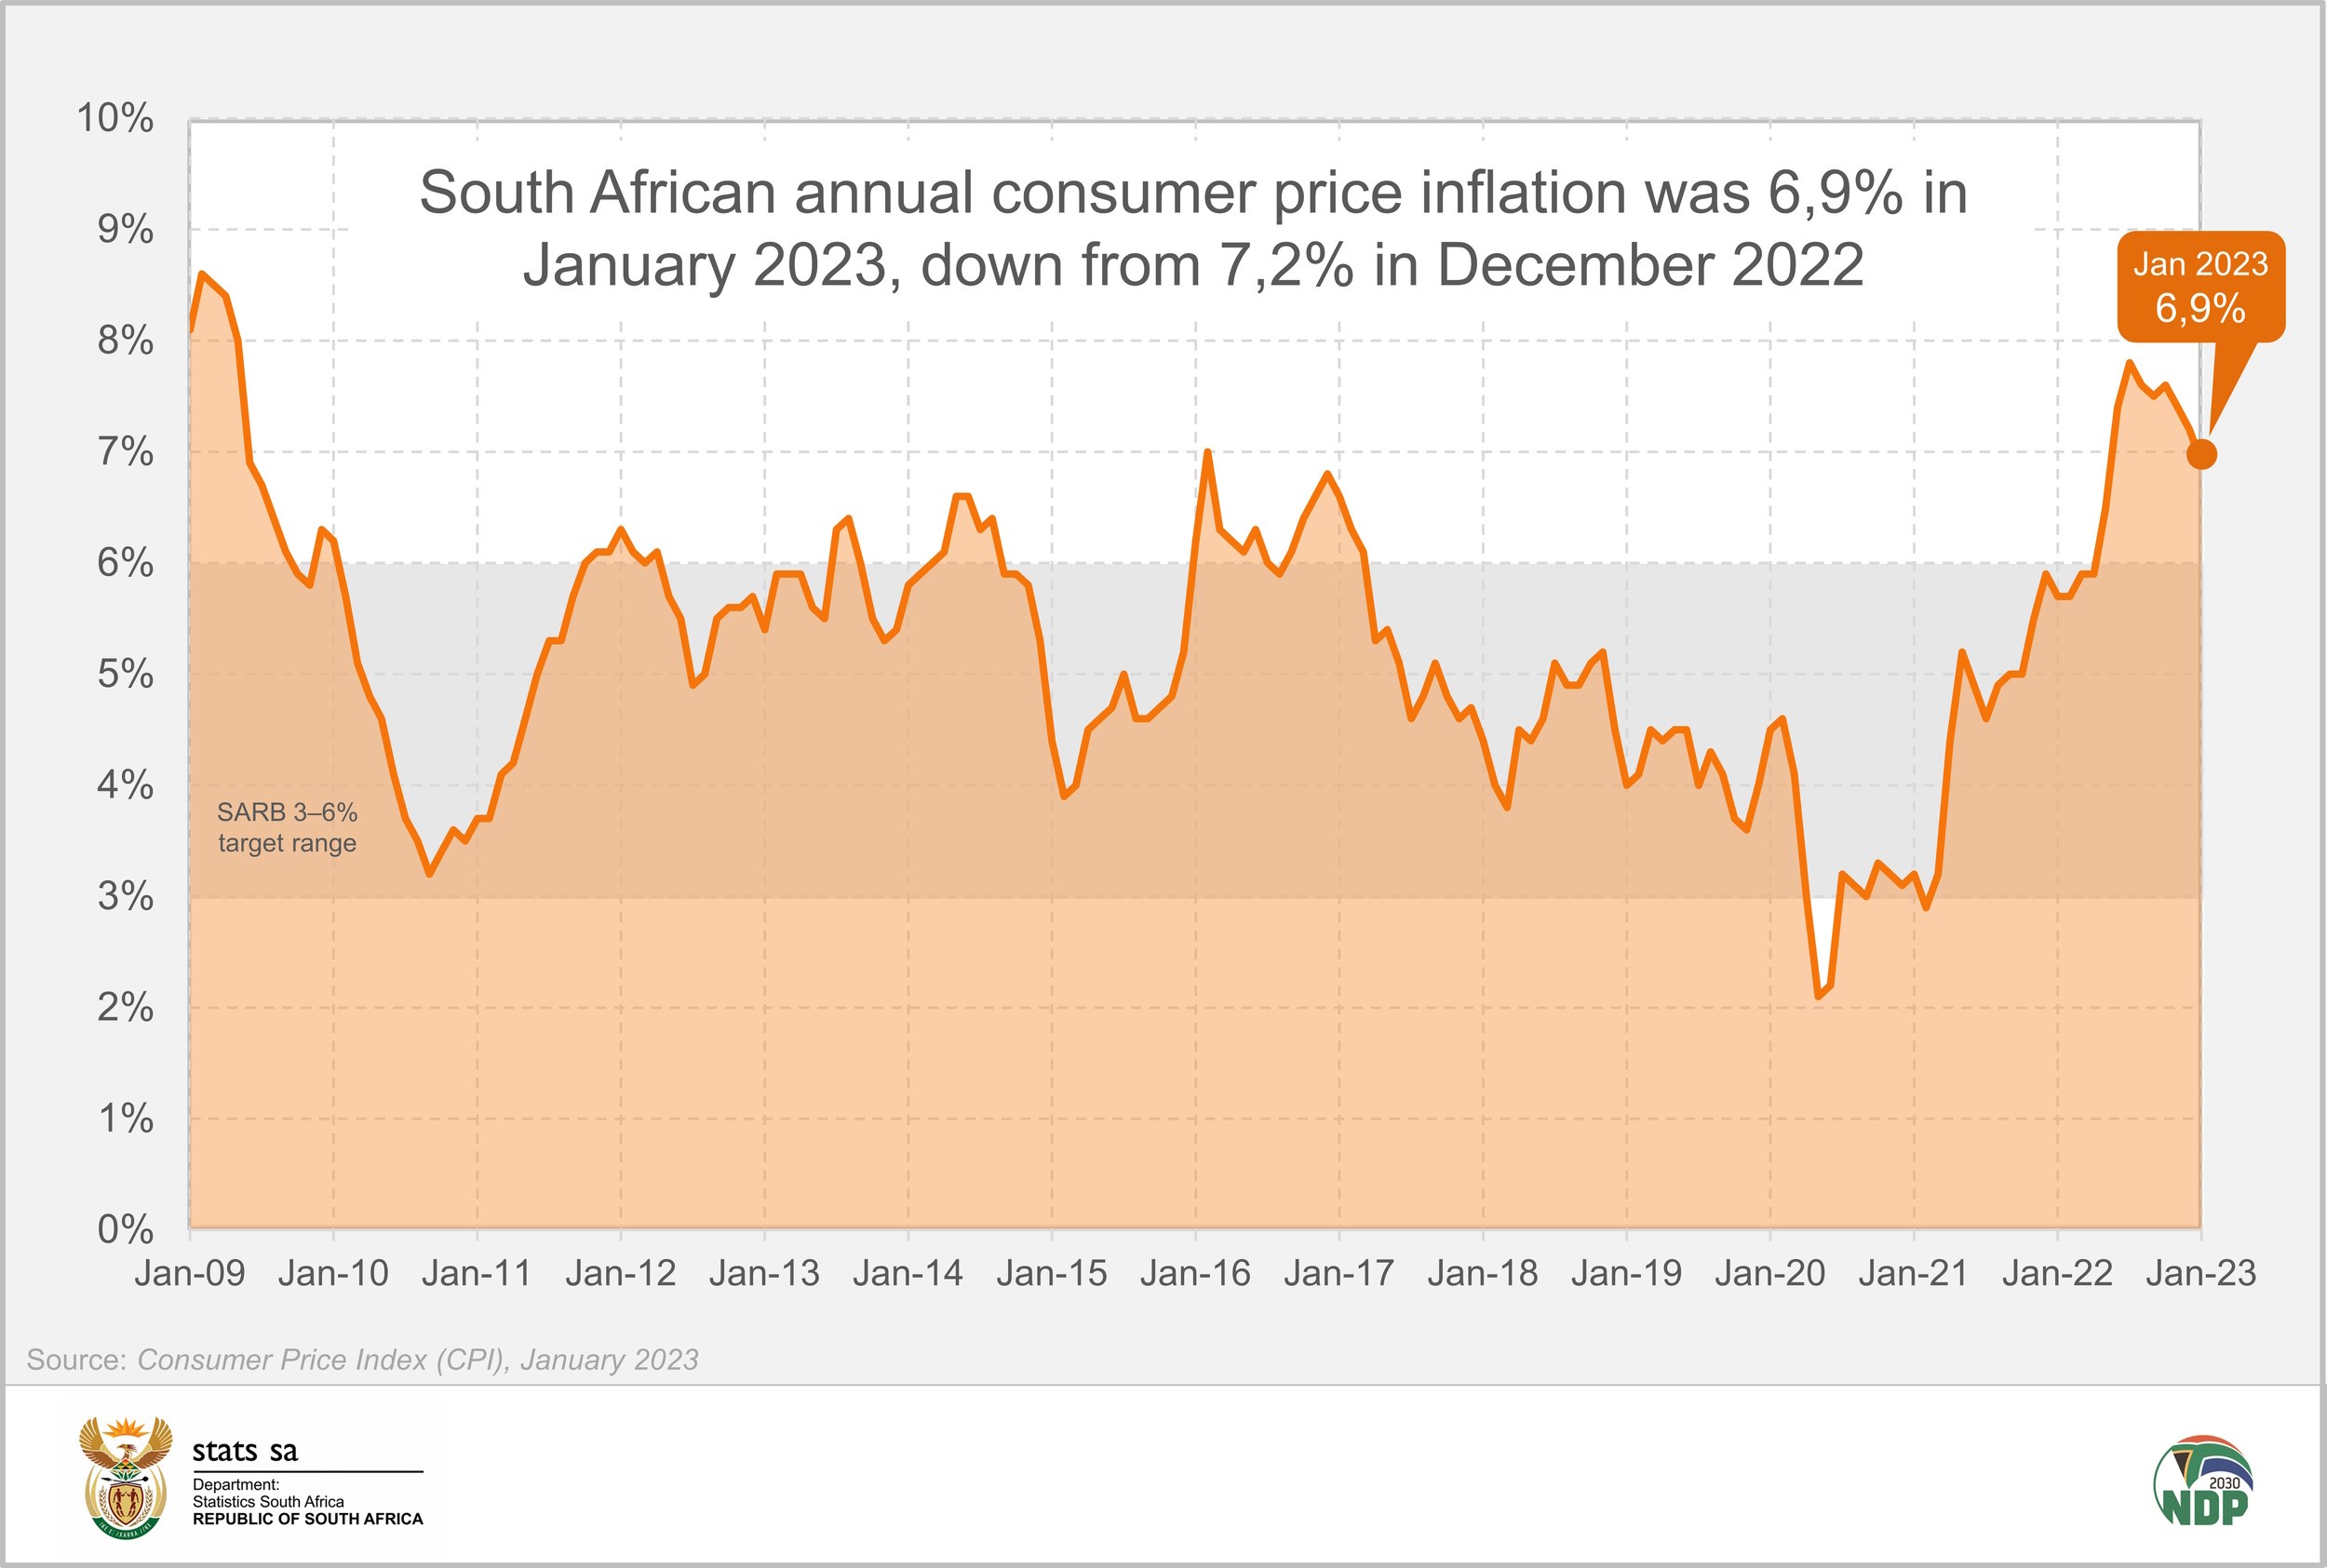
The consumer price index (CPI) declined by 0,1% between December and January.
Fuel prices continue to ease
The fuel price index declined by 10,5% between December and January, dragging its annual rate down to 13,1% from 22,8% in December. A litre of 95-octane petrol (inland) cost R21,40 in January, down from R23,46 recorded the month before.1
The price of petrol is now roughly at a level last seen in March 2022 (R21,60).
Food inflation continues to quicken
Food and non-alcoholic beverages (NAB) inflation continued to accelerate. The annual rate climbed to 13,4% in January, the highest reading since April 2009 when the rate was 13,6%.
Of all the product groups in the CPI basket, bread & cereals recorded the highest rate in January (21,8%). This was up from 20,6% in December and is the highest reading for this category since February 2009 (23,8%).
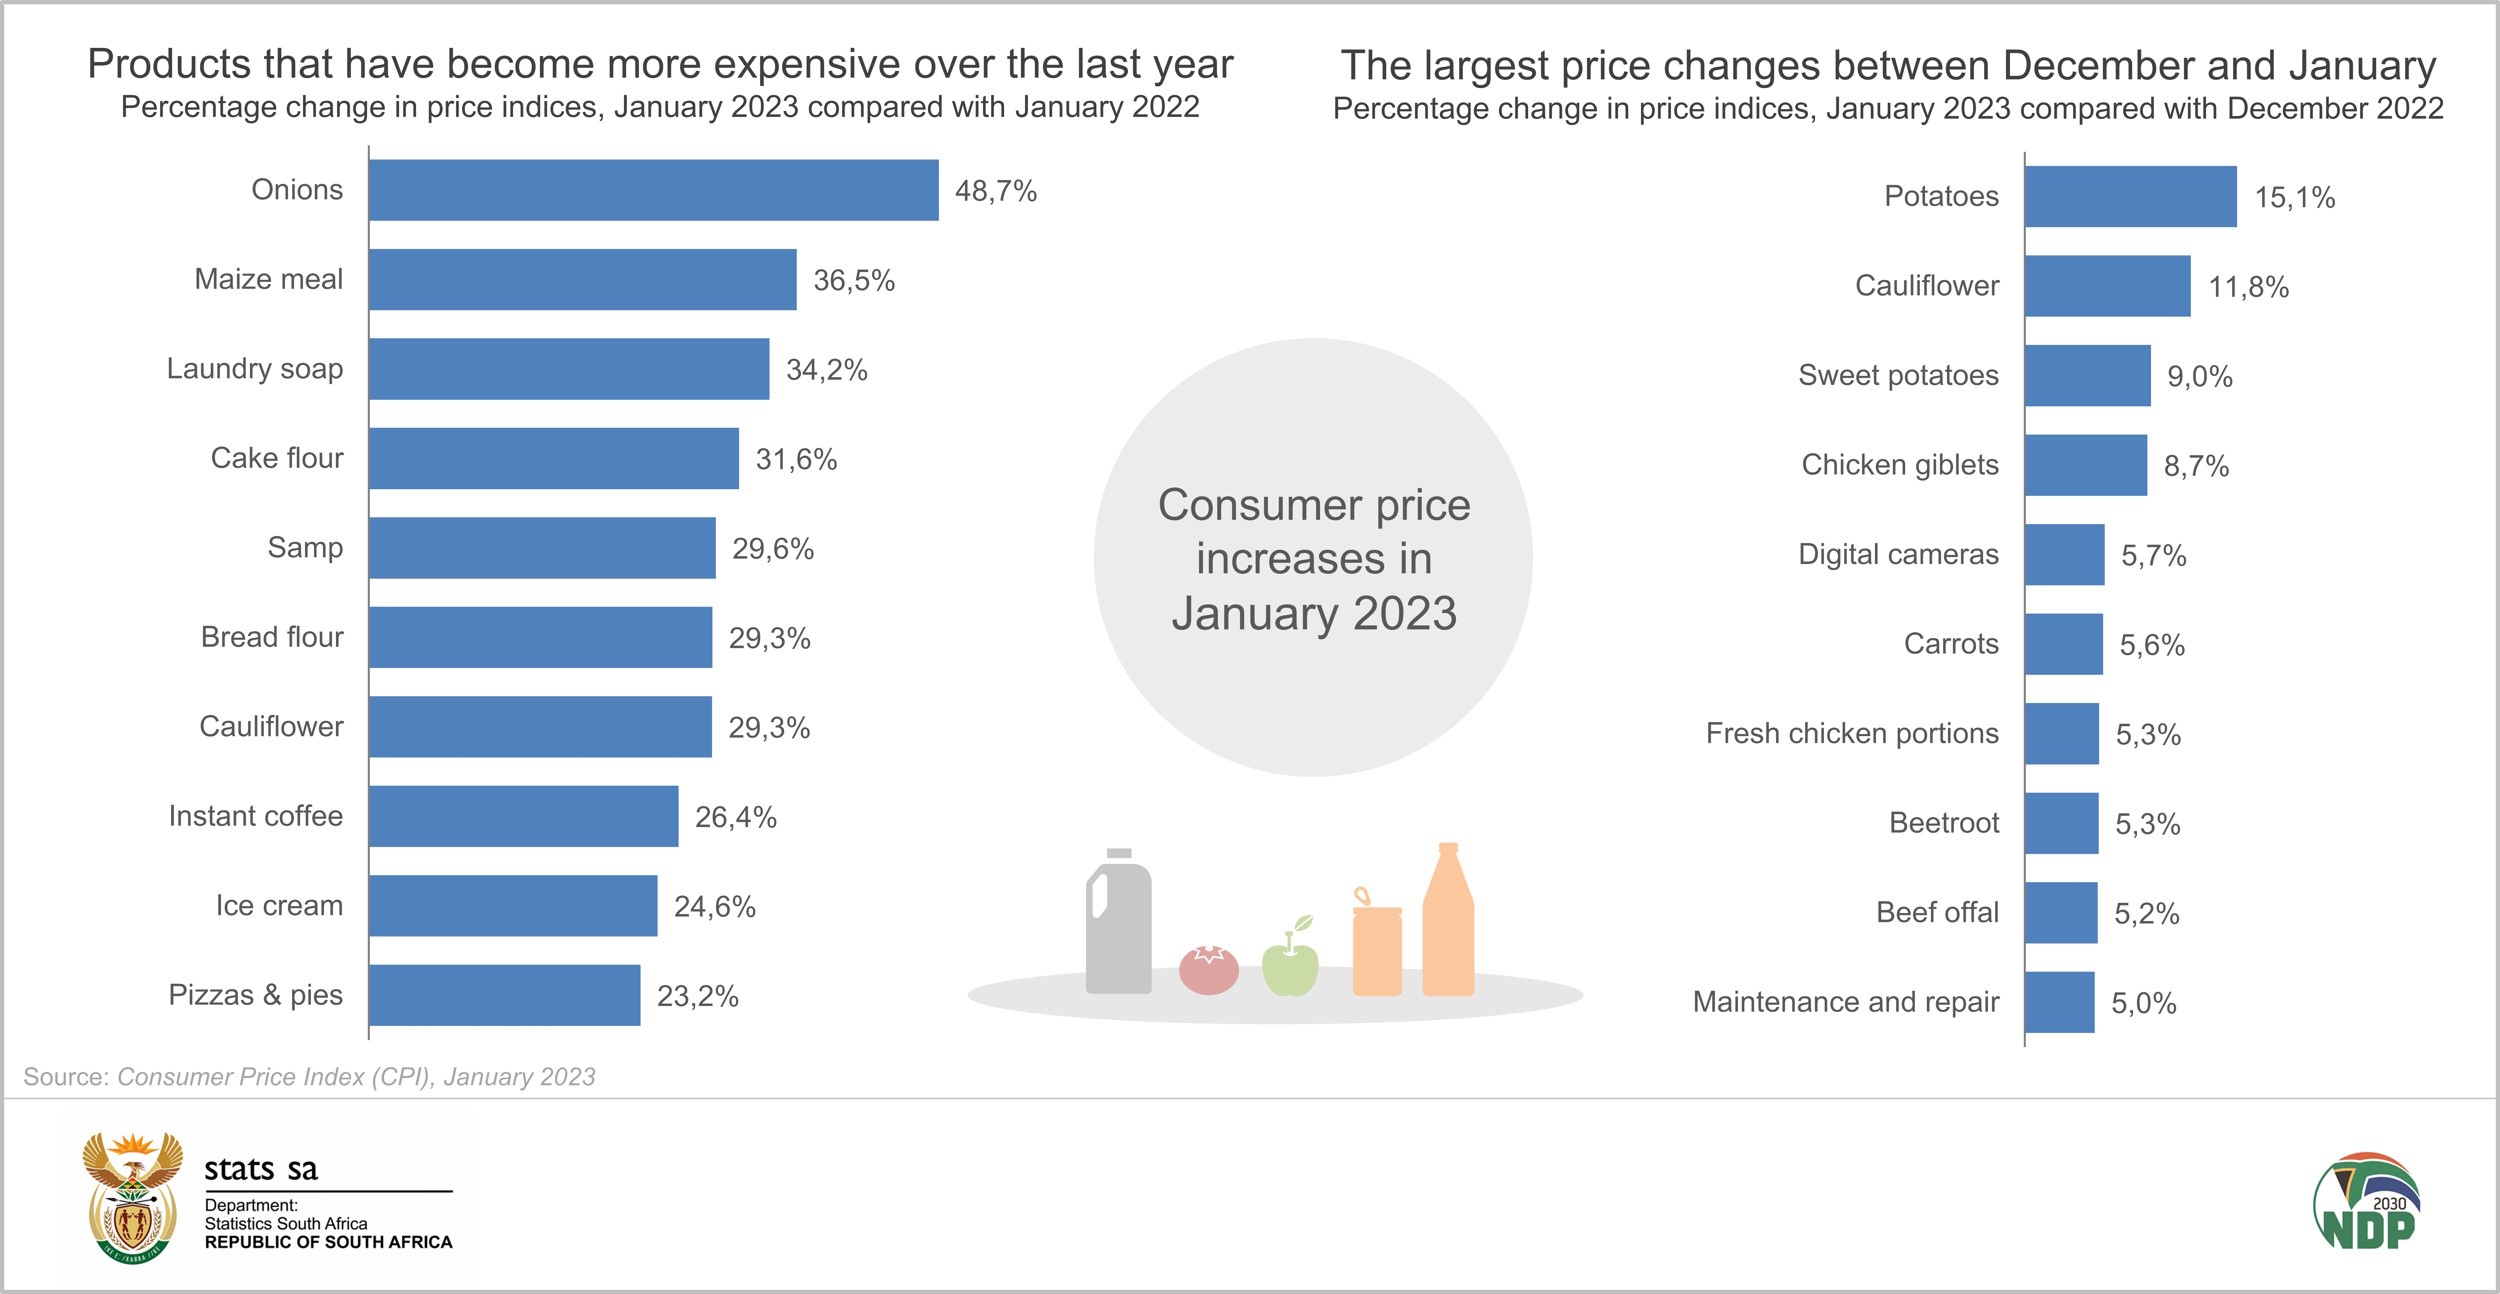
Bread & cereal products that recorded notable monthly increases in January include pastry products (pizzas and pies), which increased by 3,6%, maize (up 3,1%), and brown bread (up 1,3%).
Meat inflation increased to 11,2% in January from December’s 9,7%. Individually quick frozen (IQF) chicken portions, the highest weighted meat product, witnessed a monthly price increase of 2,7% between December and January. Other meat products that recorded significant monthly price increases include fresh chicken portions (up 5,3%), beef offal (up 5,2%), and stewing beef (up 3,6%). Bacon recorded an annual rate of 19,4%.
Annual fish inflation quickened to 13,0% from 10,4% in December. This is the highest annual inflation rate for fish since May 2009 when it was 14,2%.
The charts below show the products that recorded the largest percentage price increases in January. Five of the 10 largest monthly changes were vegetables, which as a group had the highest monthly change (5,1%) within food in January.
For more information, download the January 2023 CPI statistical release here.
1 Department of Mineral Resources and Energy. Petrol price archive (click here).
Similar articles are available on the Stats SA website and can be accessed here.
For a monthly overview of economic indicators and infographics, catch the latest edition of the Stats Biz newsletter here.