2022: A rocky road for product prices
Consumer inflation hit its highest level in 13 years during 2022. The average inflation rate for the year (6,9%) hides the differences in timing and extent of price increases for different product groups.
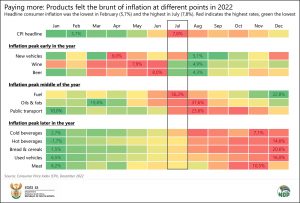
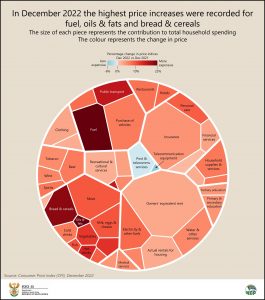
Transport and food & non-alcoholic beverages (NAB) had the biggest impact on overall inflation. Breaking the year down, the headline rate was mainly affected by transport in July, while other product groups had a greater impact later in the year.
Exploring the peaks and troughs
Headline inflation started the year at 5,7% in January and February. It later reached the 13-year high of 7,8% in July before subsiding to 7,2% in December. Products recorded their own peaks in different parts of the year. Wine, for example, registered its highest annual rate in May, cooling to its lowest reading in August. Hot beverages, on the other hand, started the year in deflationary territory, with its rate heating up to 14,6% in December.
Fuel peaked in July with headline inflation, and oils & fats peaked one month later. Inland 95-octane petrol – to the dismay of many motorists – reached an all-time high of R26,74 per litre during July.1 If you own a car with a 45-litre tank, a complete top-up would have set you back R1 203. This dwarfs the R783 you would’ve paid twelve months earlier, at R17,39 per litre.
The price of petrol eased after July, with 95-octane ending the year at R23,46 per litre. Diesel, on the other hand, reached its highest average price of R27,29 per litre in November.
The rise in oils & fats was mainly driven by a surge in the price of sunflower oil. Poor harvests in 2021 restricted global supply, a situation that was further worsened by the Russian invasion of Ukraine, the world’s two leading producers of sunflower oil. In April 2022, the crippling shortage forced major retailers Woolworths and Pick n Pay to impose buying limits on shoppers.2
At the till, a bottle of sunflower oil (750 ml) cost an average of R28,20 in August 2021, rising to an eye-watering R44,51 a year later. The annual price increase for oils & fats in August 2022 (37,6%) is the highest on record for this category since the current consumer price index (CPI) series began in 2008.
Used vehicle inflation glided upwards during 2022. According to BusinessDay, cash-strapped consumers opted to hold onto their vehicles for longer periods of time, restricting the availability of used cars in the market.3 Inflationary pressure was most evident in the second half of the year, with the annual rate reaching 16,0% in December. Price increases for new vehicles, on the other hand, were less intense, with its rate reaching its peak (6,0%) in April.
Bread & cereals saw sustained inflation throughout the year, with global grain supplies disrupted by the war in Ukraine. The annual rate ended the year at 20,6%, with important products such maize meal, brown bread, white bread, and cereals recording double-digit inflation.
Cooler at the end of the year, but pressure remains
After peaking in July, headline inflation eased to 7,2% in December. The most influential product groups during the year – transport (especially fuel) and food & NAB products – continue to register high rates of inflation compared with other items in the basket.
Only time will tell what price dynamics await consumers in 2023. Stats SA will publish inflation data for January on 15 February at 10h00, so watch this space!
For more information, download the latest Consumer Price Index (CPI) statistical release and associated Excel files here.
1 Department of Mineral Resources and Energy. Petrol price archive (click here).
2 Business Insider South Africa, Woolworths and Pick n Pay have started rationing sunflower oil (read here).
3 BusinessDay, Used-car inflation continues to surge ahead of new cars (read here).
Similar articles are available on the Stats SA website and can be accessed here.
For a monthly overview of economic indicators and infographics, catch the latest edition of the Stats Biz newsletter here.


