
Government spending breaches R2 trillion
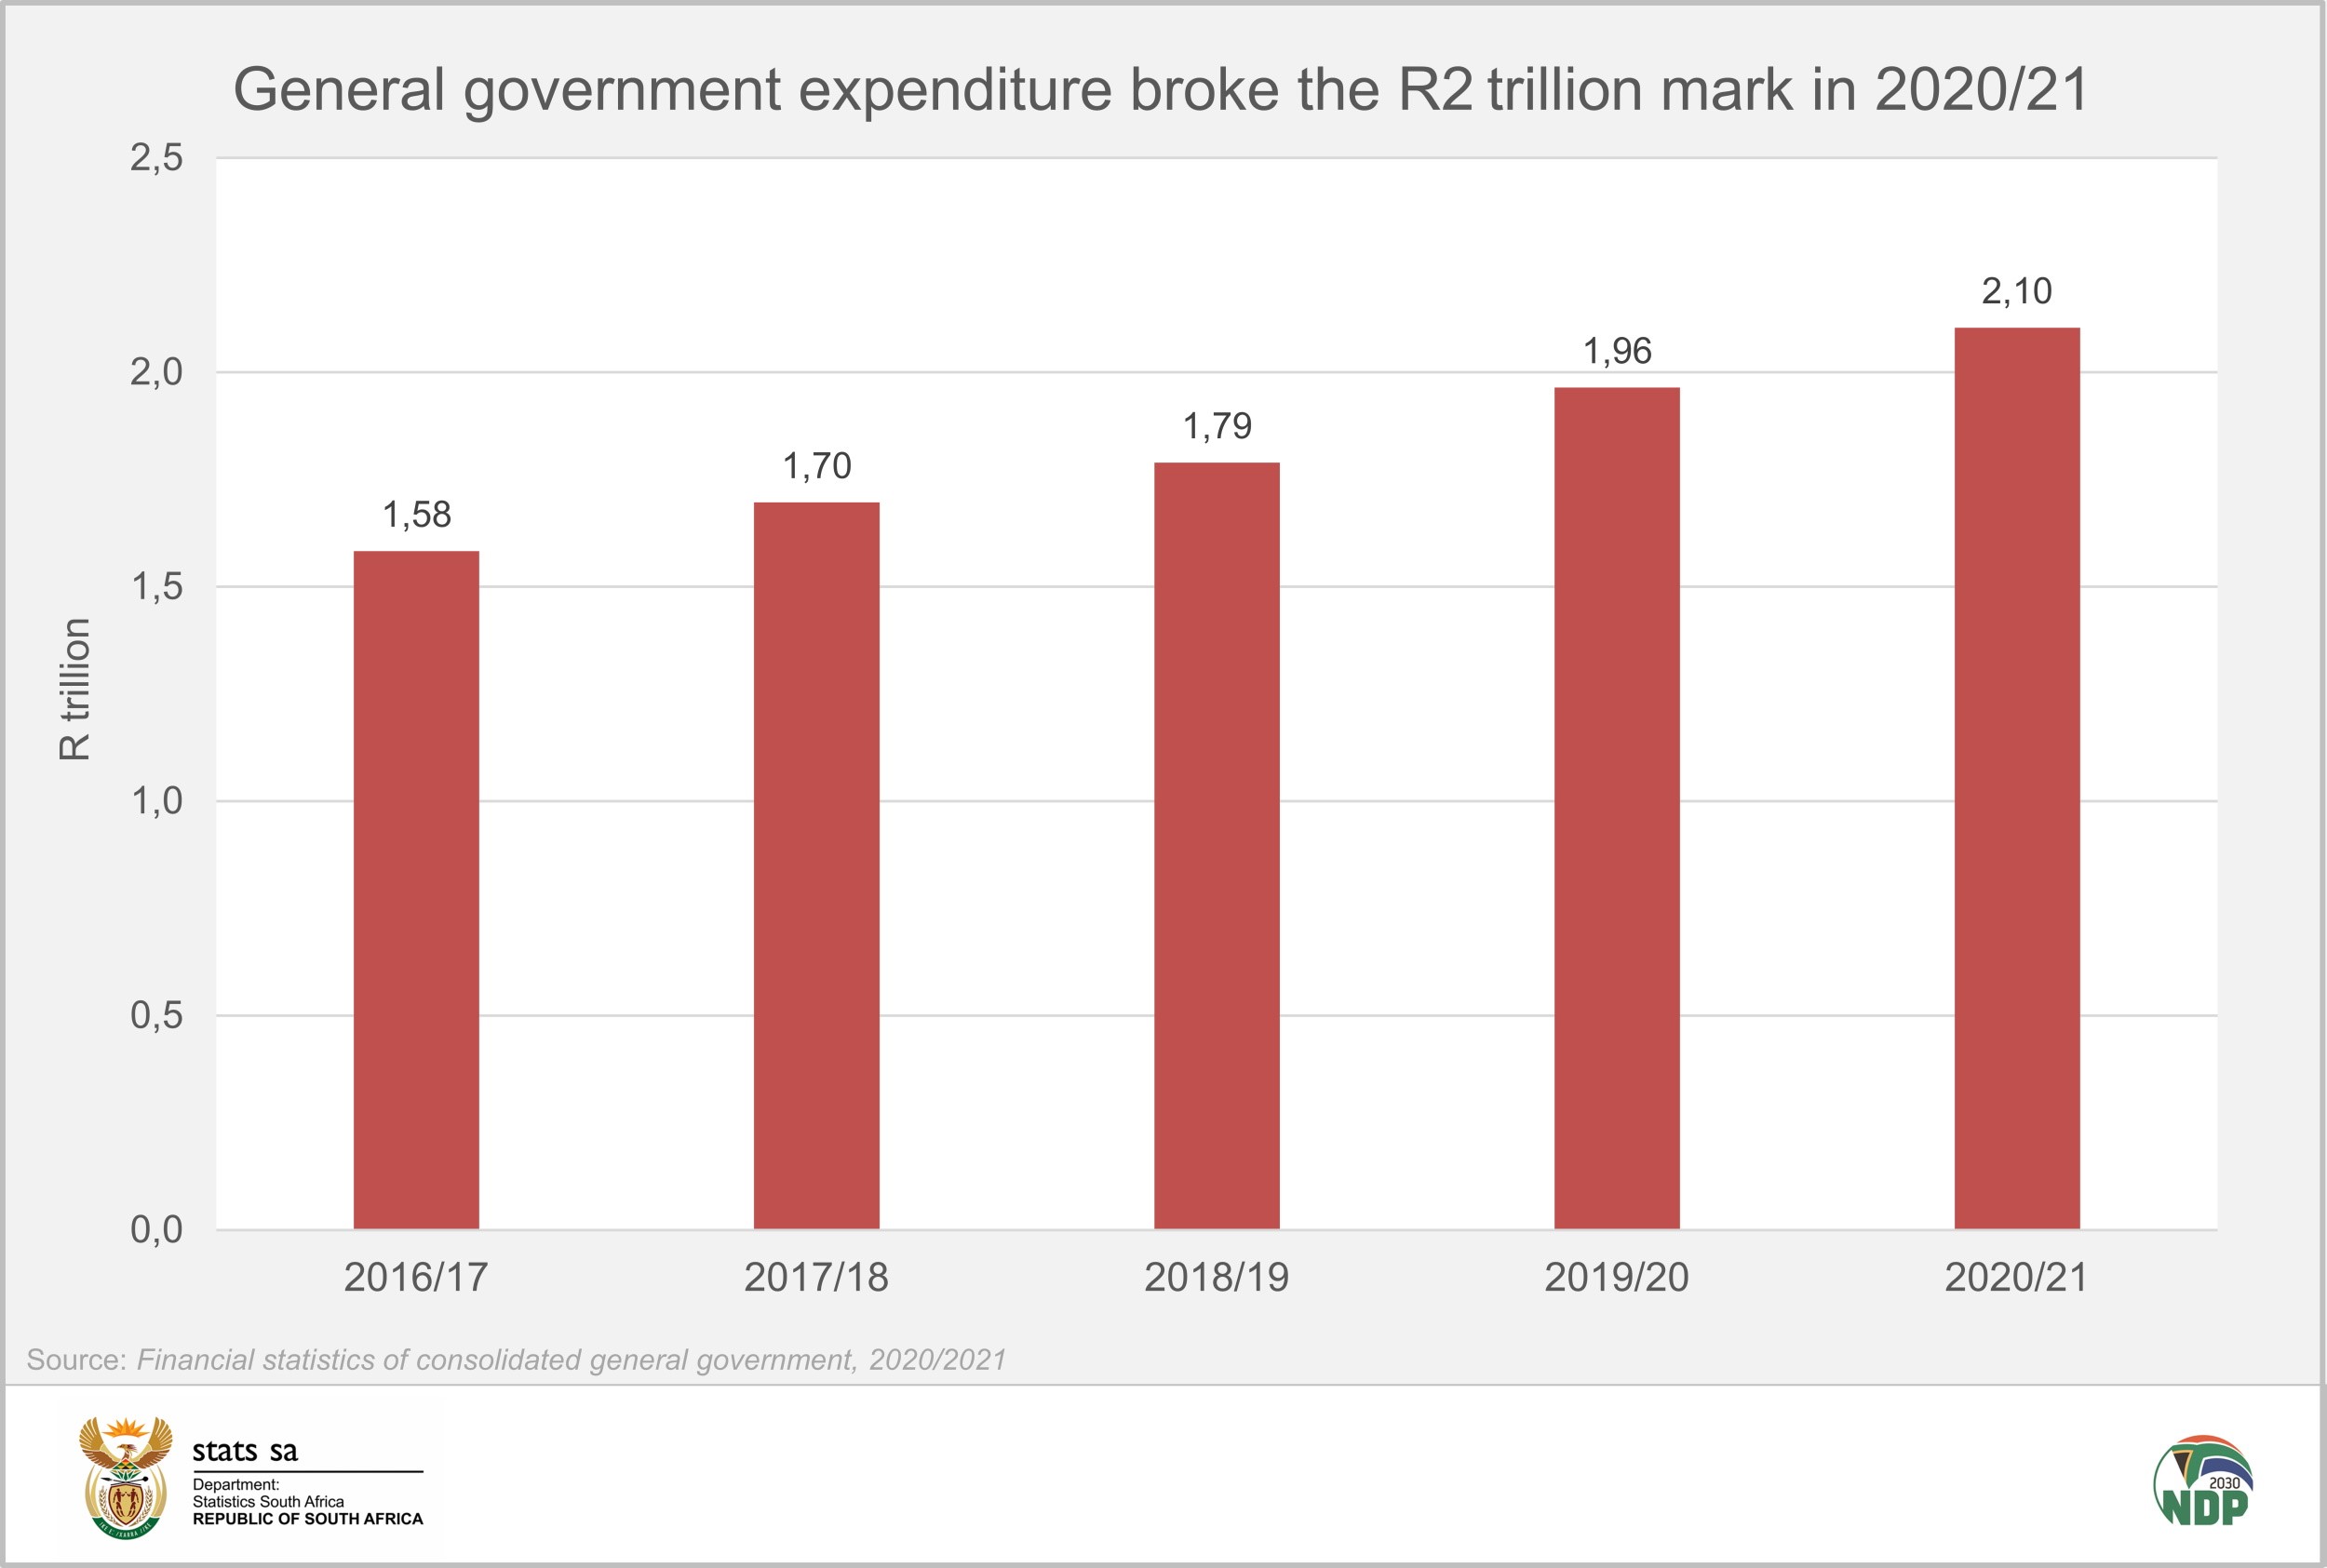
South African government spending broke the R2 trillion mark in the 2020/21 financial year. Large increases in expenditure were recorded for social protection, health, and general public services as the country battled the COVID-19 pandemic. At the same time, total revenue declined on the back of lower taxes received.
The Financial statistics of consolidated general government statistical release1 consolidates data from other surveys published during the year. The release covers 701 institutions that include national and provincial government departments, municipalities, extra-budgetary accounts and funds, and higher education institutions.
Lower tax collection drags revenue down
General government recorded a decline in total revenue in 2020/21, mainly due to decreased tax collection. Total tax revenue dropped by R109 billion (-7,4%) from R1,47 trillion in 2019/20 to R1,36 trillion in 2020/21. Tax revenue was down across the board, with the largest decreases recorded by individual tax (down R41 billion), excise tax (down R22 billion), value-added tax (down R16 billion) and business tax (down R13 billion). Other taxes recorded a decrease of R17 billion.
The decline in taxes paid by businesses was mainly due to lower economic activity as a result of the pandemic and subsequent lockdowns. The decline in excise taxes was mainly associated with the lockdown bans on the sale of alcohol and tobacco.
Social protection spending jumps during the pandemic
As revenue came down, spending went up. Total expenditure increased by 7,1% (or R140 billion) between 2019/20 and 2020/21, from R1,96 trillion to R2,10 trillion.
Social protection, general public services and health were the biggest factors behind the increase.
Spending on social protection rose by R84 billion, from R286 billion to R370 billion. Social protection involves government intervention that is intended to mitigate the impact of social risks on households and individuals.2 This includes the payment and administration of sickness and disability, family and children, old age and unemployment grants.
To minimise the socio-economic impact of the pandemic, government rolled out the following COVID-19 projects. These projects contributed to the R84 billion increase:
- The Social Relief of Distress (SRD) grant. This was mainly paid to unemployed households that were not receiving any other grant or form of income. The SRD grant also catered for additional payments to other grant beneficiaries.
- COVID-19 Temporary Employee/Employer Relief Scheme (COVID-19 TERS). The Unemployment Insurance Fund was mandated to manage this scheme. The aim of the scheme was to support workers who were at risk of retrenchment during the pandemic.3
The SRD grant had a notable effect on the number of households that had access to grants during the pandemic. According to Stats SA’s General Household Survey, the percentage of households receiving a grant (excluding the SRD grant) increased from 45,5% in 2019 to 48,9% in 2020. If we include the SRD grant in this analysis, the reading in 2020 increases to 52,4%.4
Health and general public services
The second biggest cost driver in 2020/21 was general public services, increasing by R35 billion. This was mainly due to a rise in interest payments on public debt (up by R28 billion) and an increase in payments to the Southern African Customs Union (up by R14 billion).5
Health expenditure increased by R26 billion, mainly due to increased COVID-19 spending on goods and services, compensation of employees (related to the appointment of additional health workers) and capital expenditure (related to the renovation of hospital buildings and development of other health related infrastructure).6
Exploring the 2020/21 expenditure pie
The graphic below illustrates how government spread the R2,10 trillion across various functions. General public services accounted for almost a quarter (R507 billion) of total expenditure, followed by education, social protection and health (click on the graphic to enlarge).
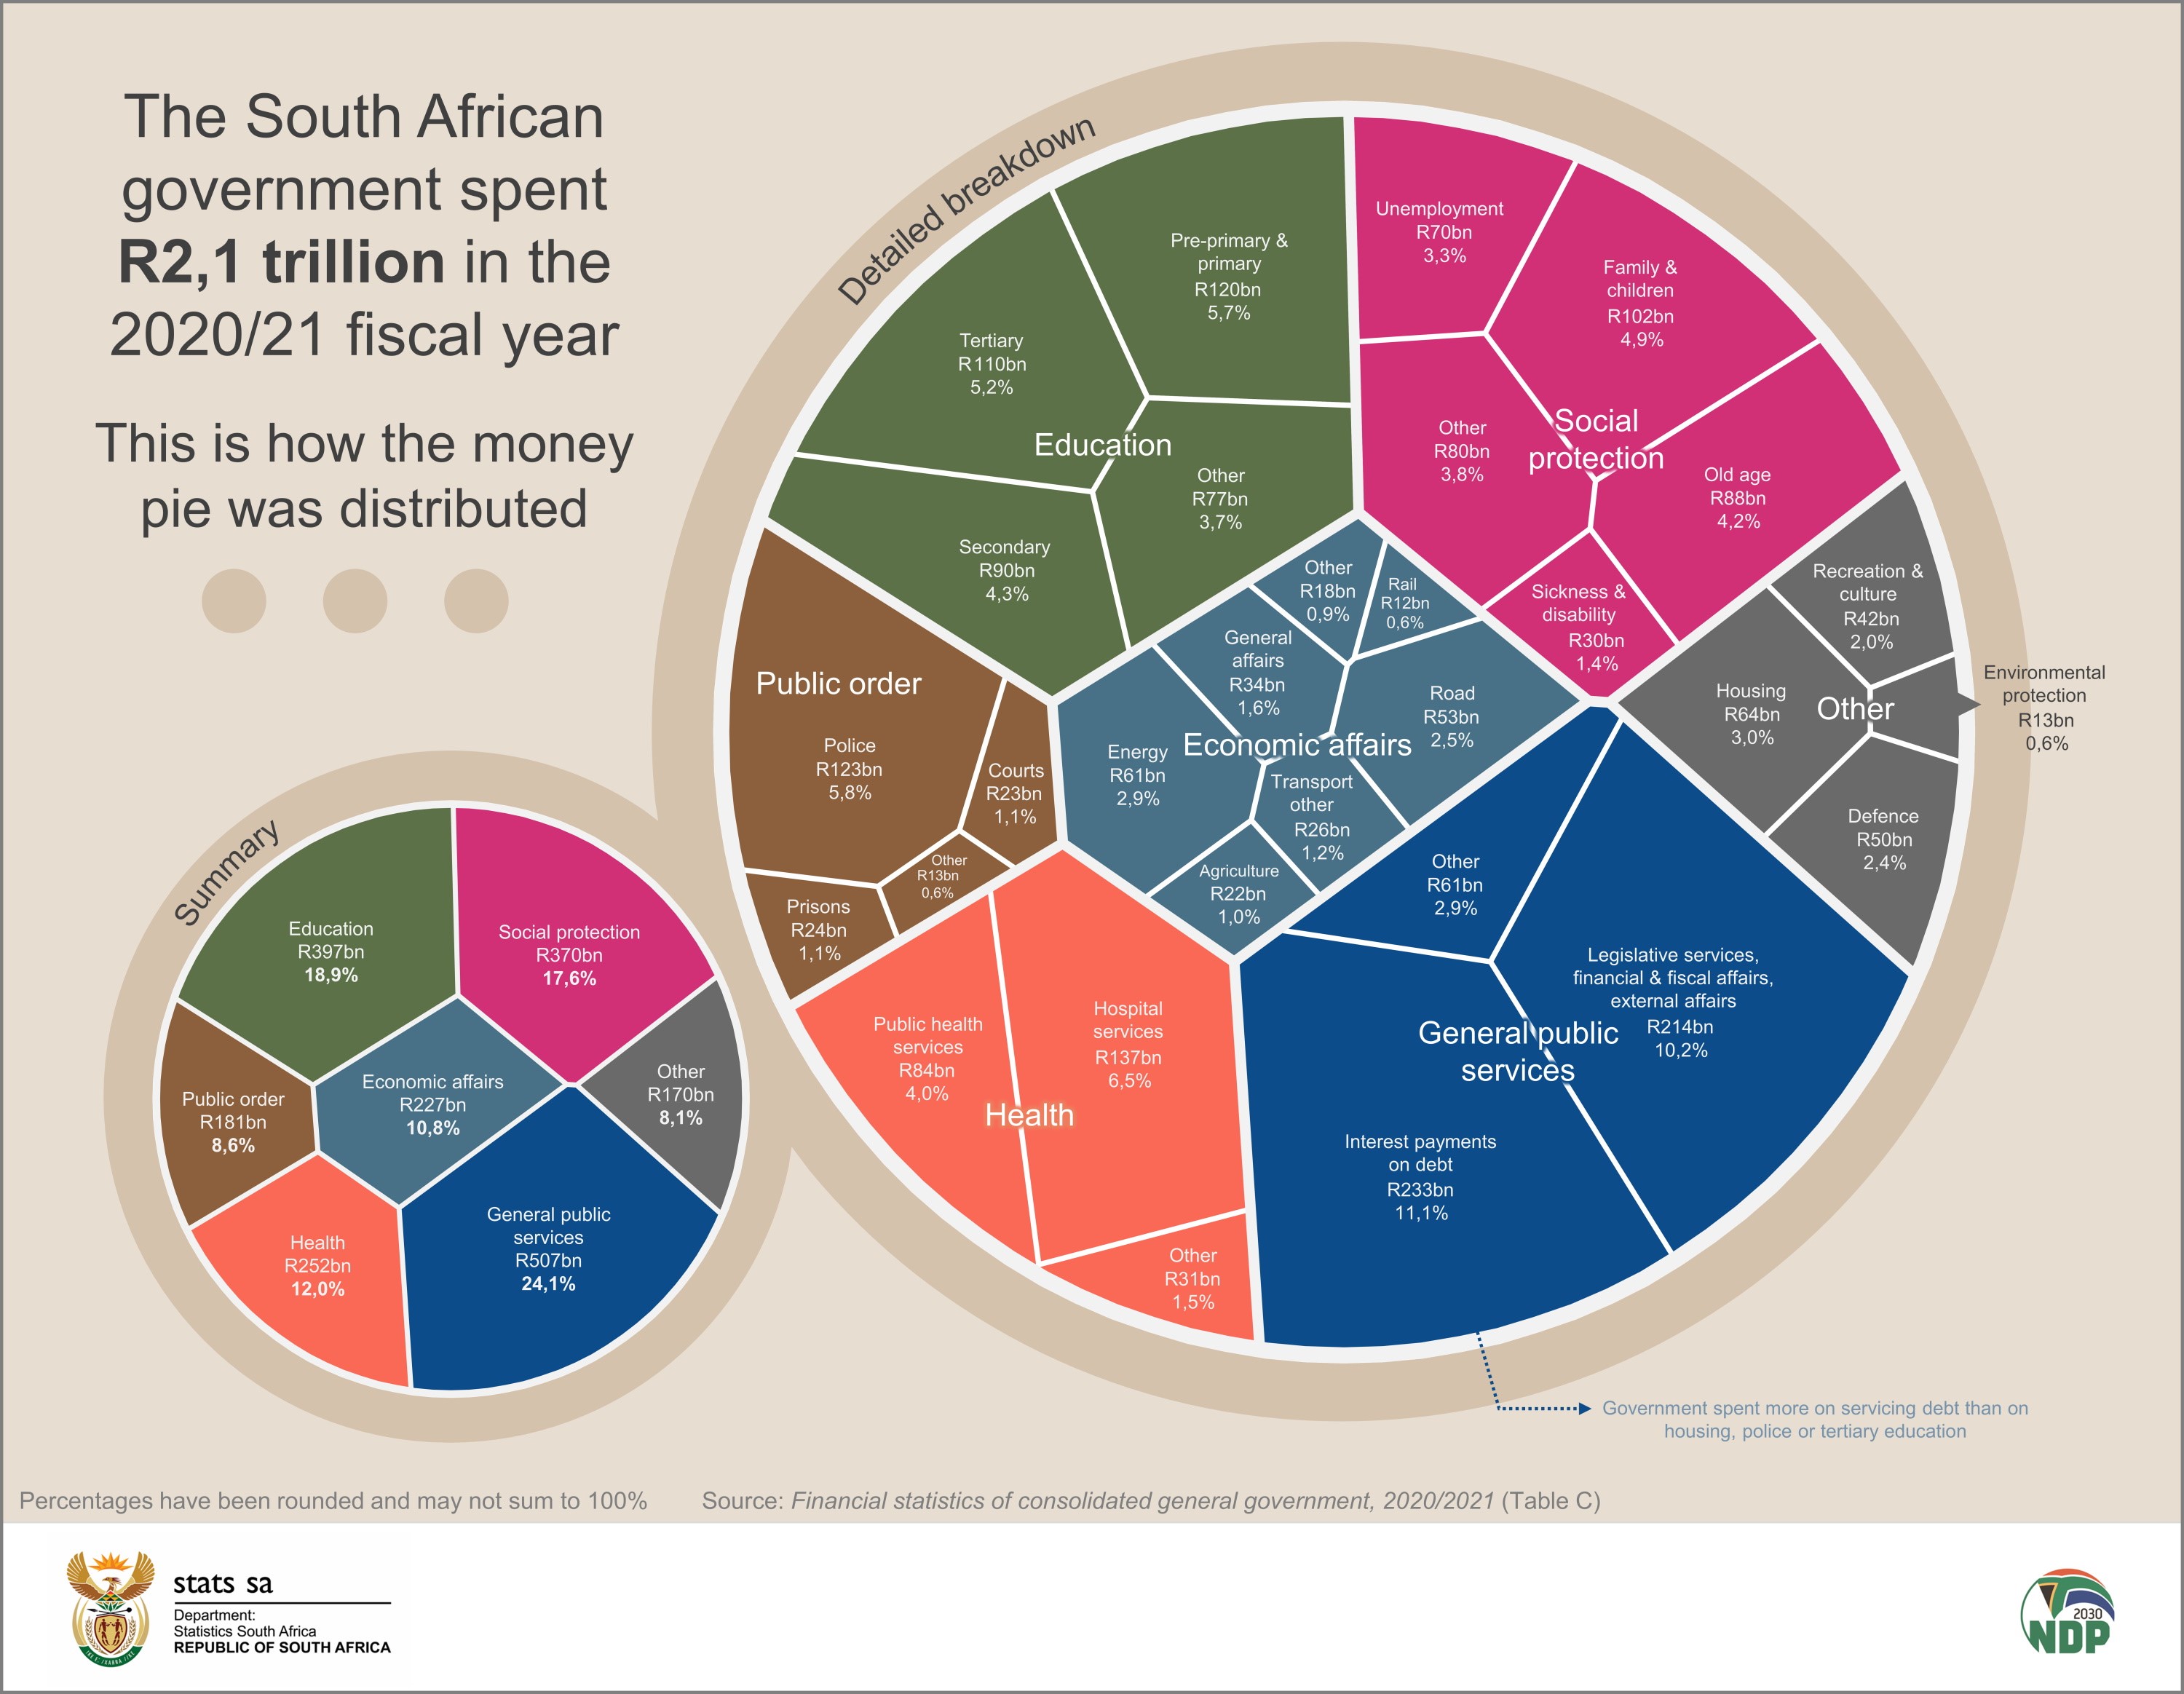
Breaking this down further, the biggest item in general public services was interest payments on debt. For every R100 of total expenditure, government used R11,10 to service its debt obligations.
The second biggest item in general public services was legislative services, financial & fiscal affairs and external affairs, accounting for 10,2% of total spending. This item covers costs mainly related to the administration of parliament, the provincial legislatures and mayoral offices, as well as payments to the Southern African Customs Union (SACU).
For more information, download the 2020/21 Financial statistics of consolidated general government statistical release and time series data here.
1 When interpreting these figures, note that the data published in the Financial statistics of consolidated general government statistical release (a) are adjusted for the reference period 1 April – 31 March and (b) in order to compare across all levels of government, data were converted from an accrual basis of recording to a cash basis of recording.
2 Government Finance Statistics Manual, 2014, pg 277 (download here).
3 Stats SA, Government finances: Social spending jumped in 2020/21 (read here).
4 Stats SA, General Household Survey, 2020, Figure 7.4 (download the release here).
5 For more information on the SACU, take a read of a 2020 article here.
6 Stats SA, Provincial government finances: the impact of COVID-19 (read here).
Similar articles are available on the Stats SA website and can be accessed here.
For a monthly overview of economic indicators and infographics, catch the latest edition of the Stats Biz newsletter here.