
Black Friday and shifts in consumer behaviour
With Black Friday upon us, South African consumers have begun scouting for the latest deals. Monthly retail trade sales data show how Black Friday has shifted shopping behaviour over time.
Consumers splurge during the festive season
The graphic below shows the distribution of retail trade sales by month, for the year 2019. If all months contributed equally to annual sales, the average would be 8,3% each month. A clear seasonal pattern stands out, with December the most active month for many retailers. If we consider the entire sector, December accounted for 11% of total annual sales in 2019 (click on the image to enlarge).1
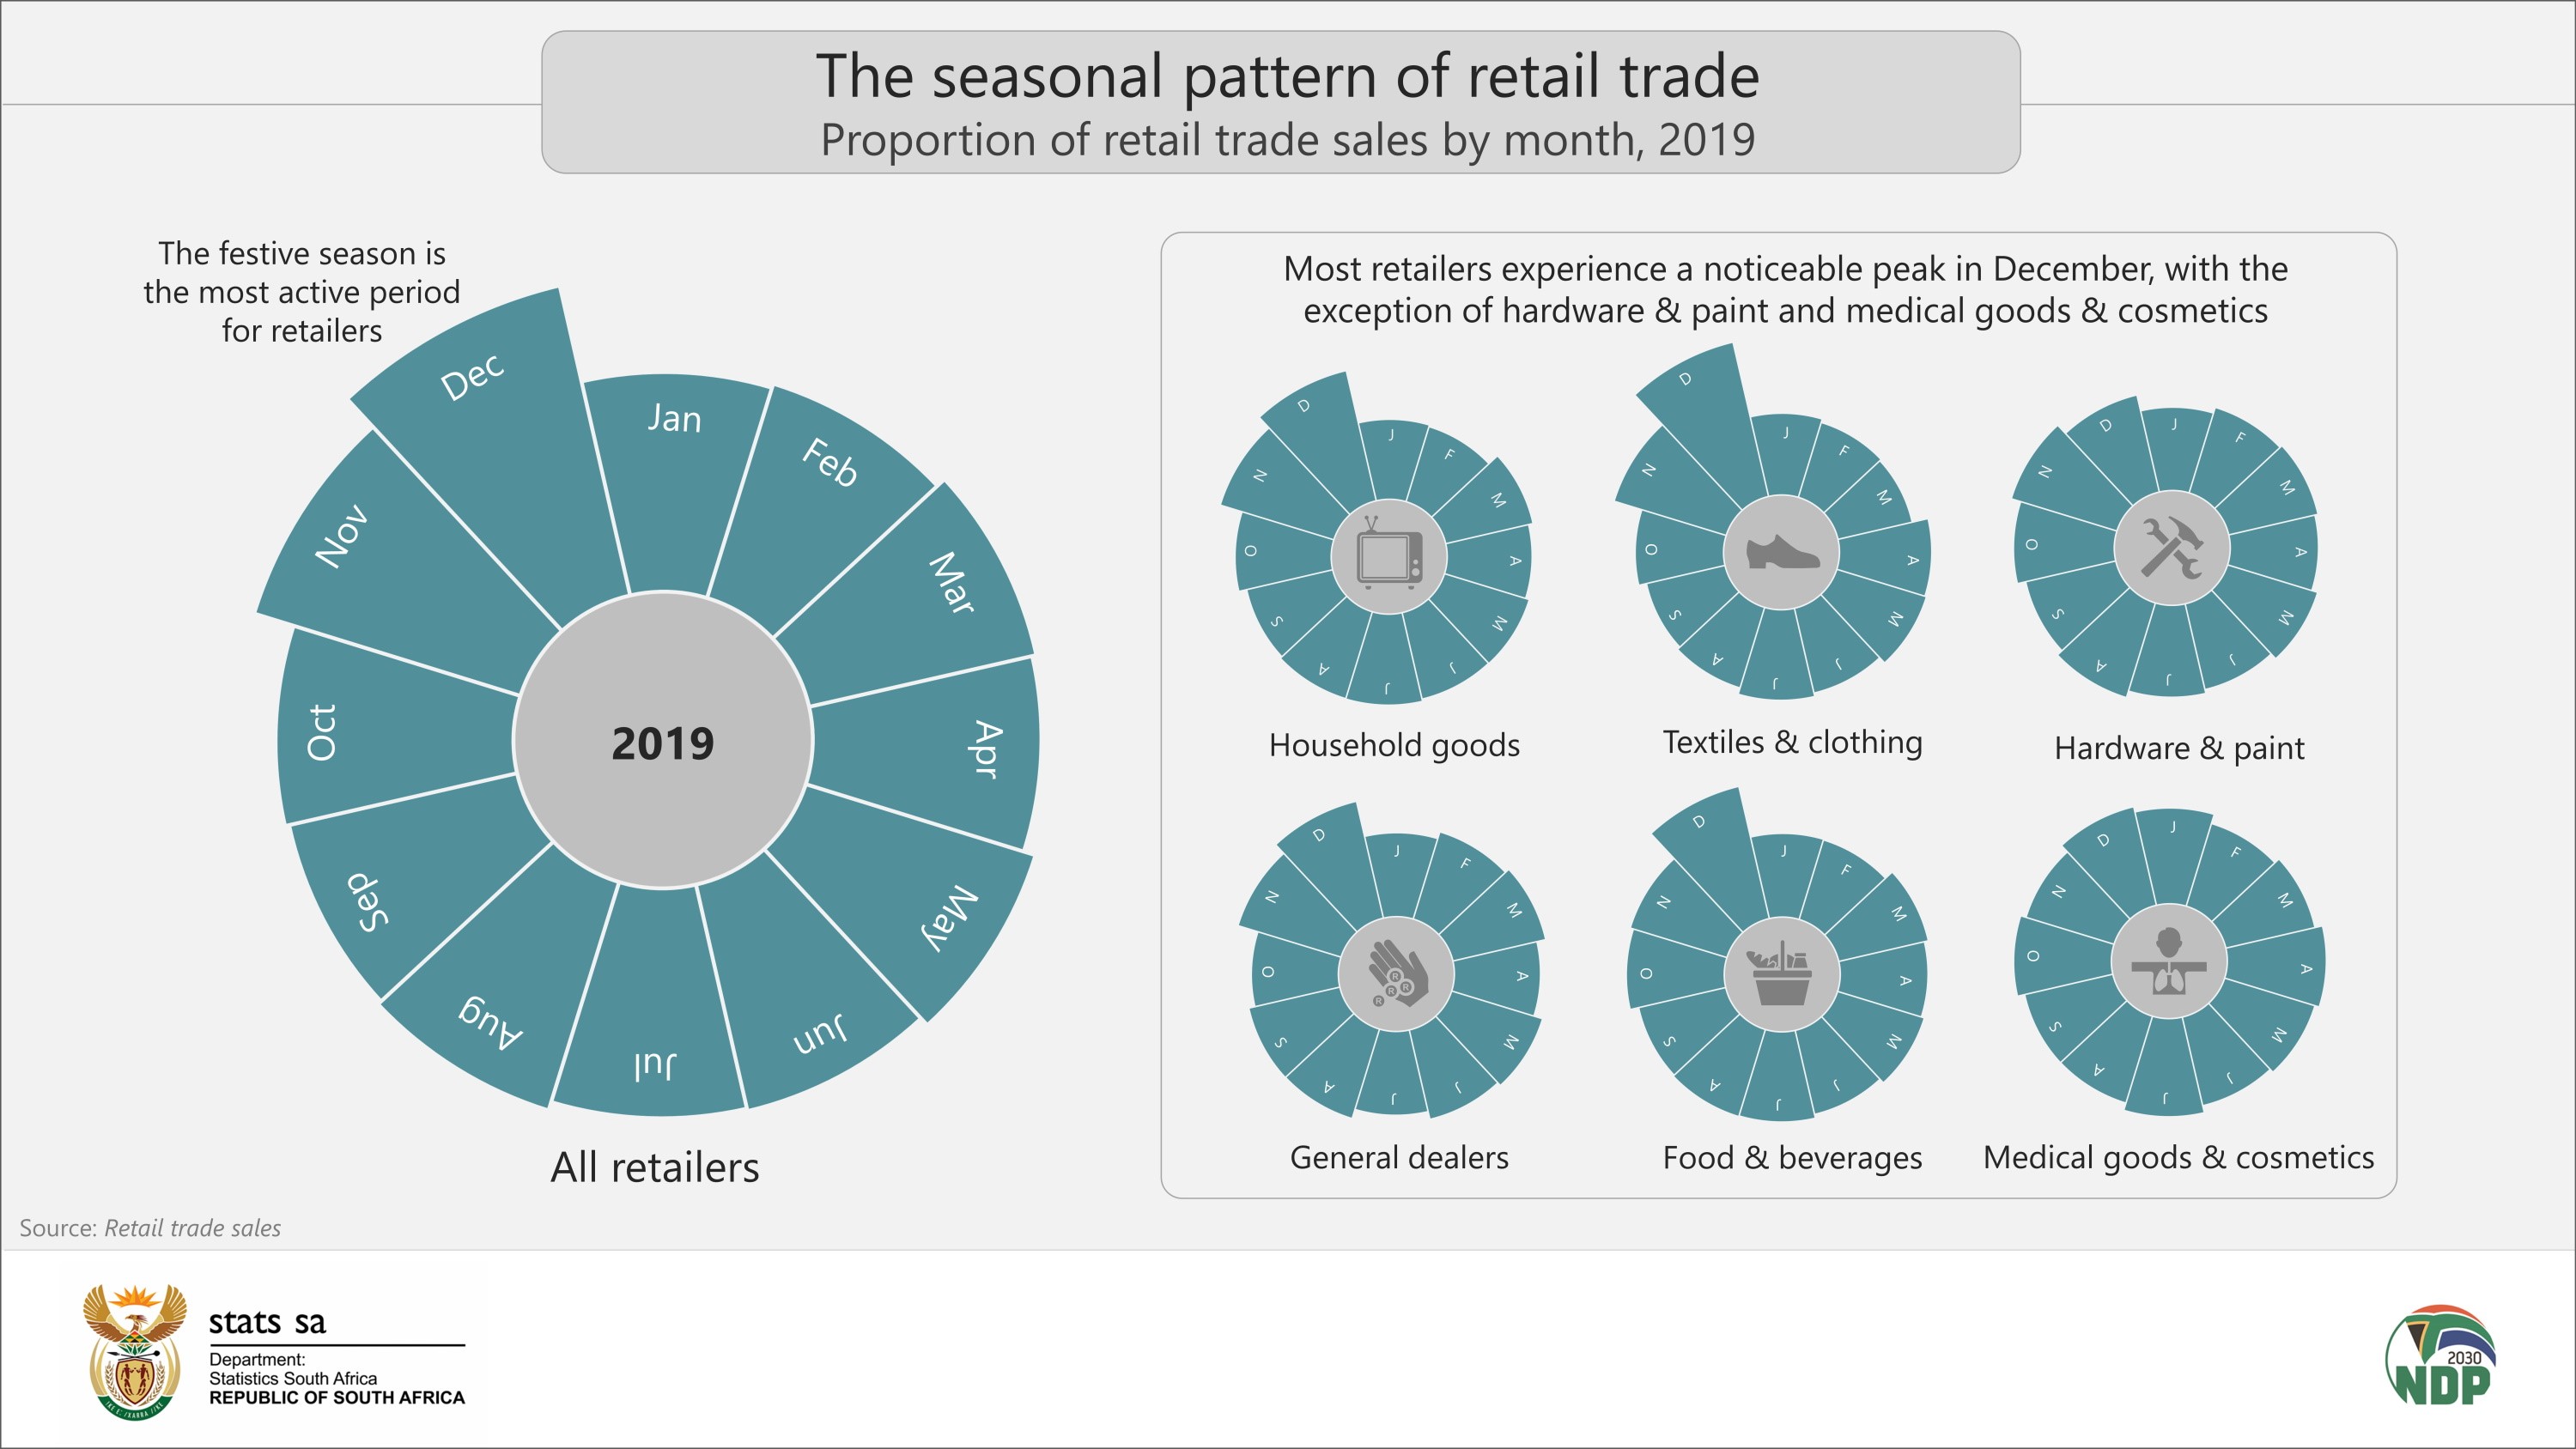
Hardware & paint (which also includes glass) is the clear oddball. It is the only retailer type that does not experience its busiest time in December, with sales peaking in November instead. This makes sense, as many consumers are likely away in December with home renovations the furthest thing from their minds!
Merchants specialising in medical goods & cosmetics experience a more equal distribution of sales across the year, with December, July, April and October their busiest months.
The rise of Black Friday
According to BusinessTech, Black Friday was first introduced in South Africa in 2012.2 If we take the 2019 charts above and superimpose them onto 2011 data, we can gain insight into how patterns have changed. The coloured slices in the charts below represent 2019 data with the black-bordered slices representing 2011. If the entire sector is considered, what is immediately clear is the rise in November’s contribution to annual sales, driven mainly by Black Friday. In 2011, November accounted for 8,8% of annual sales, rising to 9,6% in 2019. December, April, September and October lost noticeable ground over this period.
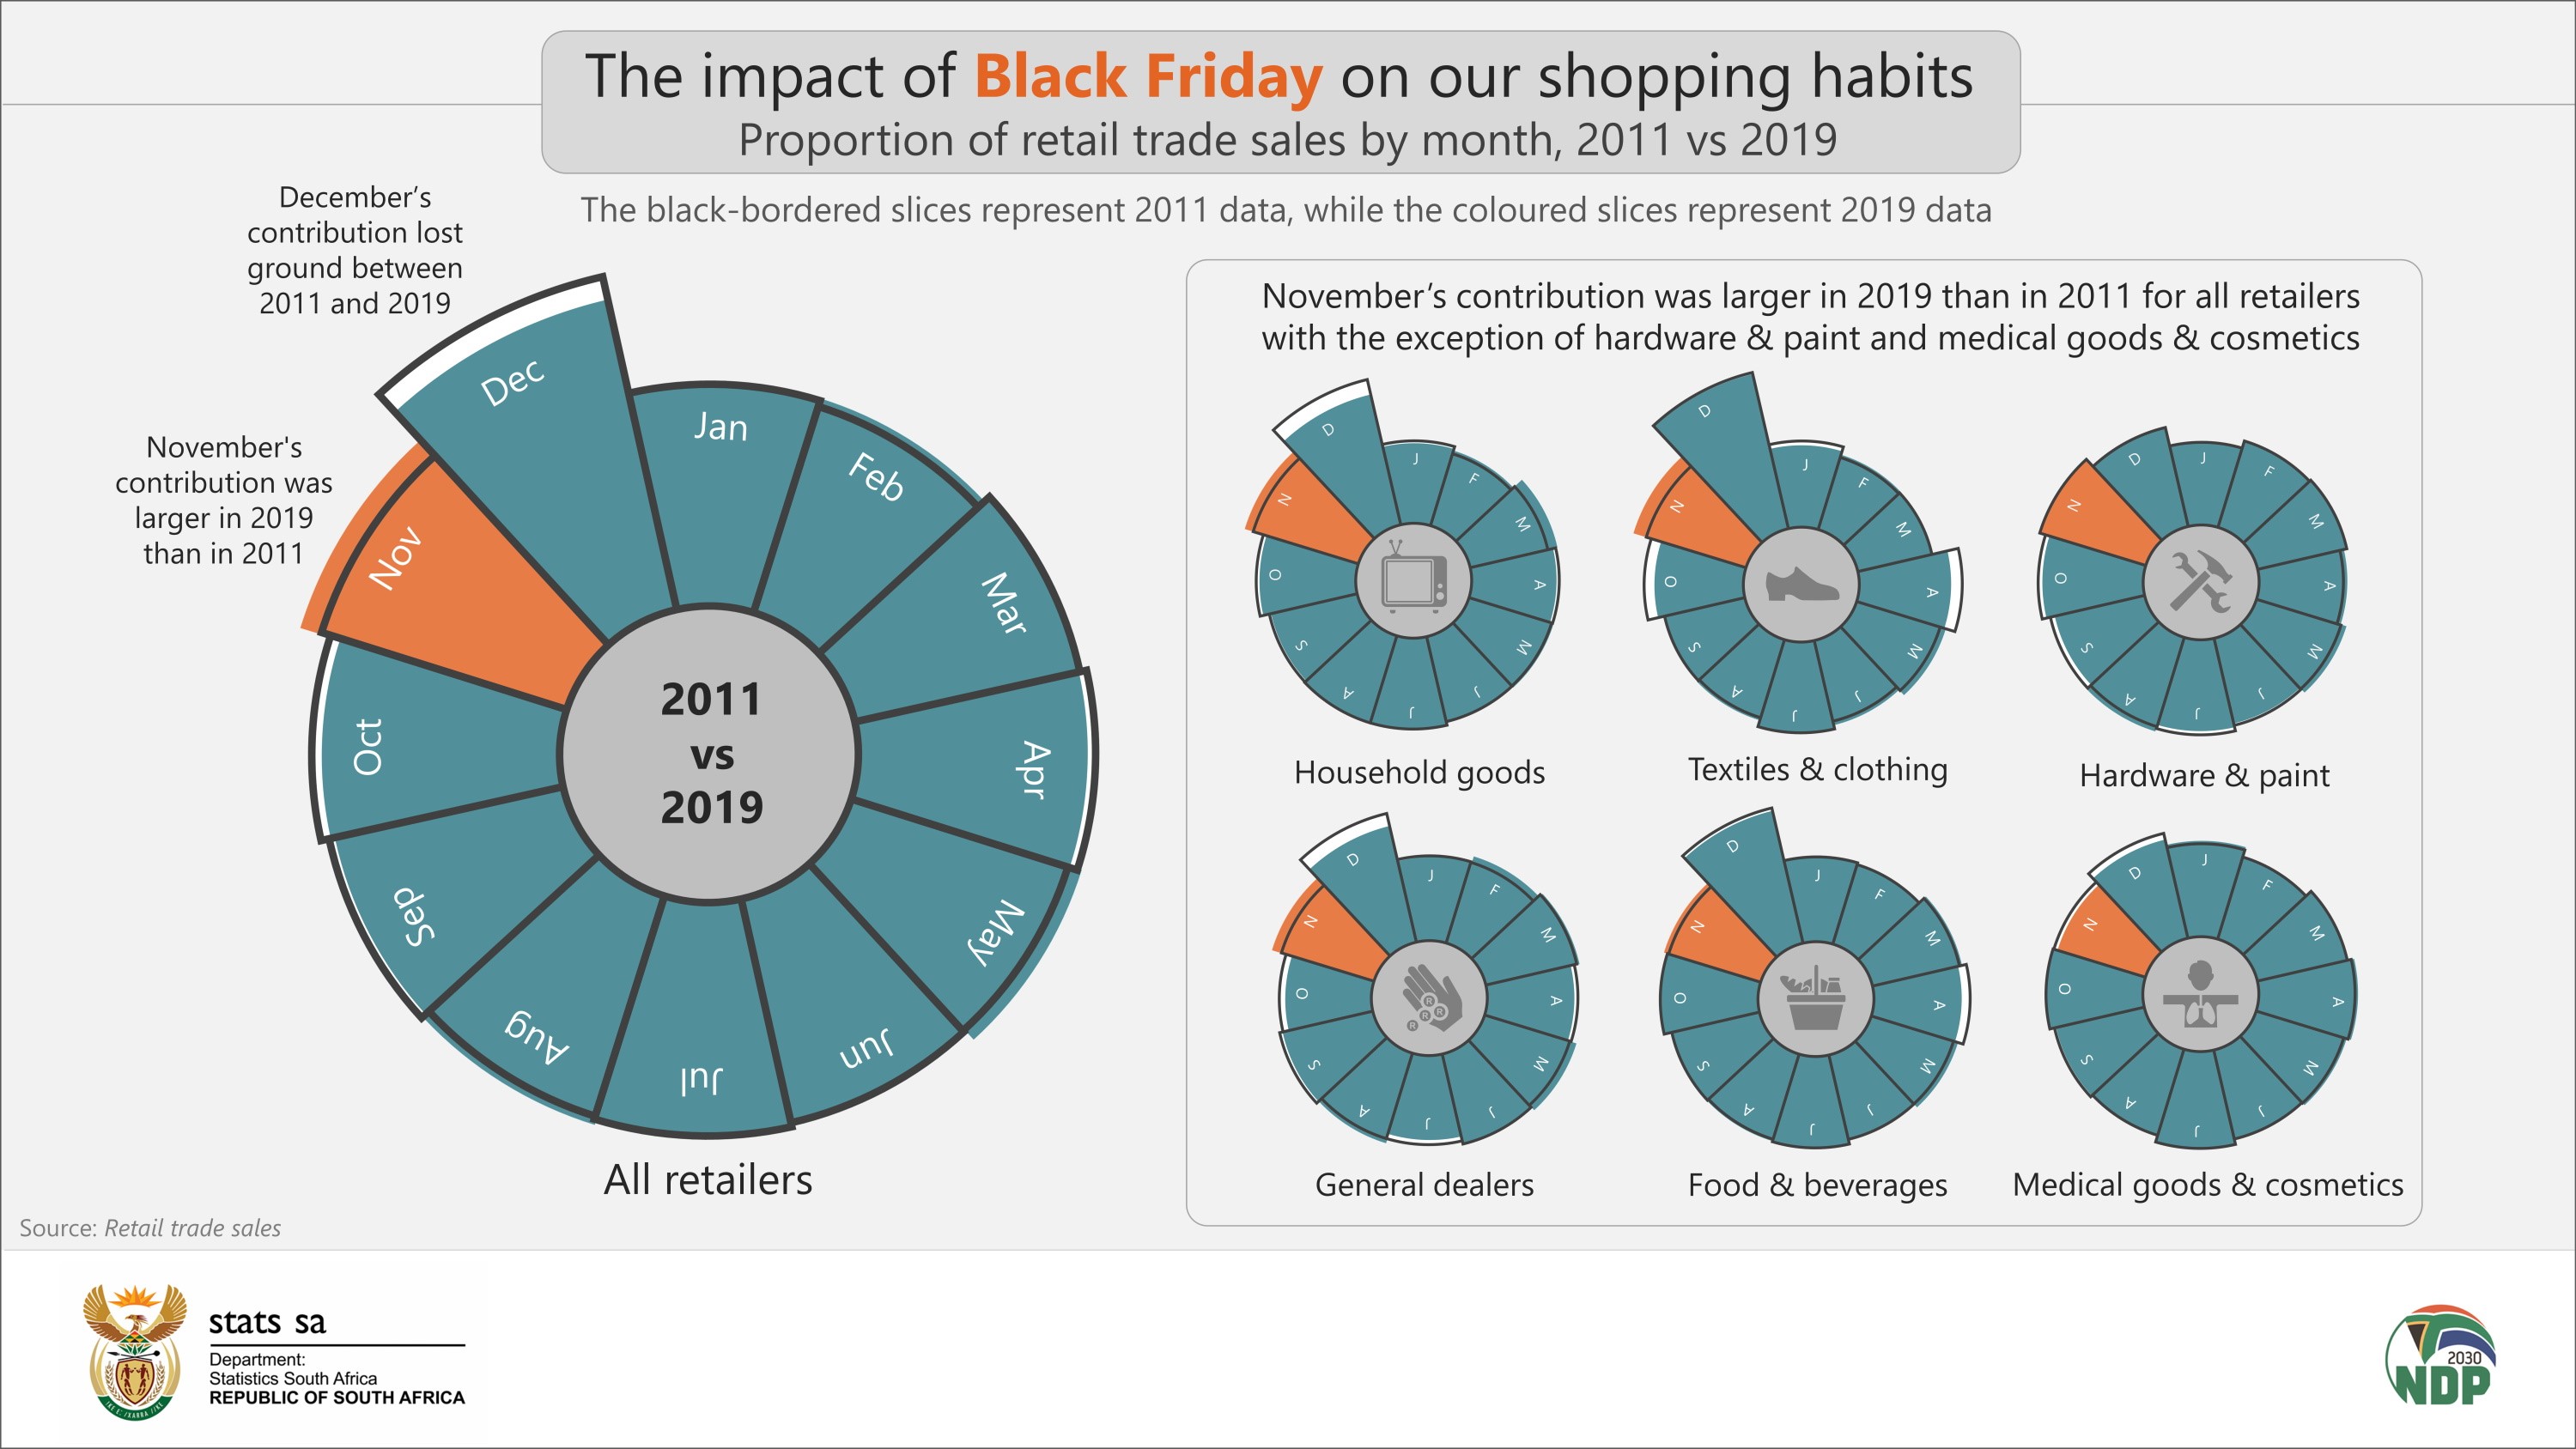
The rise of Black Friday affected some retailers more than others. The lift in consumer spending in November was felt by all retailers with the exception of those specialising in hardware & paint and medical goods & cosmetics.
The impact of the pandemic
Readers familiar with Stats SA’s retail trade data might be wondering why 2019 was selected for this analysis as data are available for 2020 and 2021. The reason is that 2019 is regarded as a ‘normal’ year before the advent of the COVID-19 pandemic.
The chart below shows monthly contributions to total annual sales for the years 2019, 2020 and 2021. November’s contribution remained somewhat stable, increasing slightly in 2020 and edging lower in 2021.
What is notable, however, is the decline in April 2020 during Alert Level 5 lockdown.
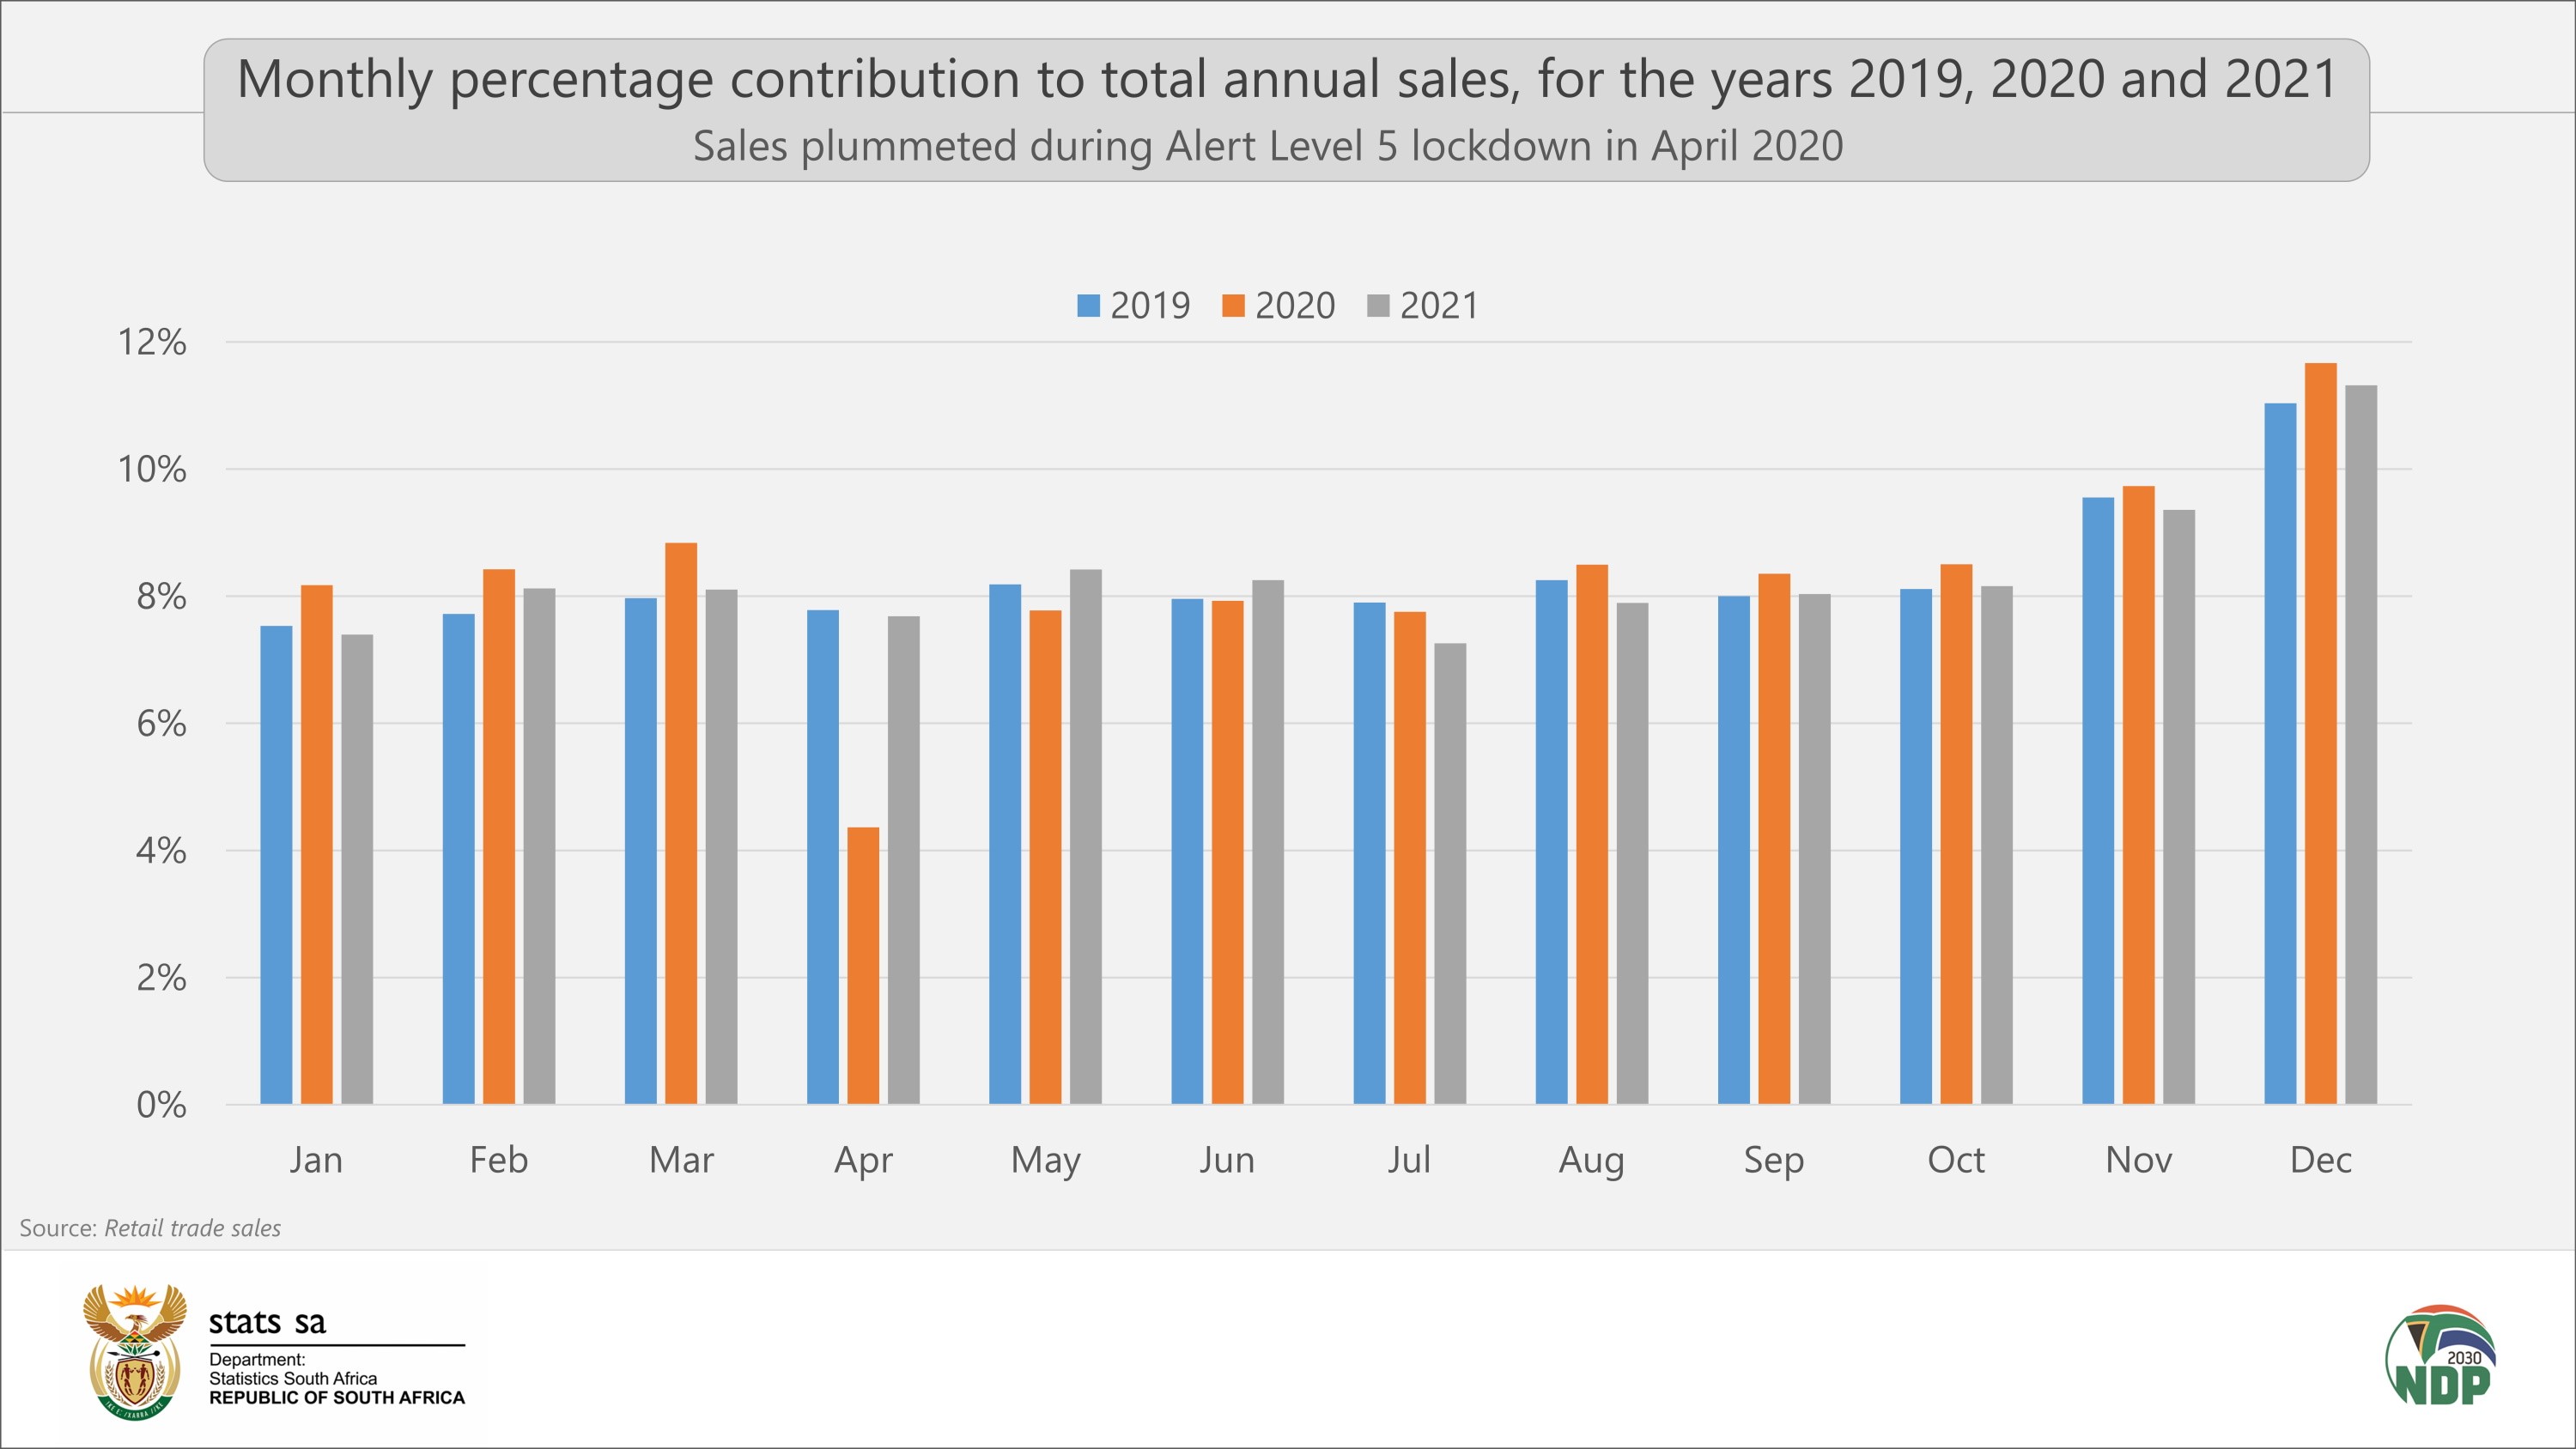
Level 5 was the most stringent form of lockdown, imposed for about a month at the beginning of the pandemic. Its impact was felt across the entire economy: South African gross domestic product (GDP) tumbled by 17,1% that quarter (April‒June), with economic activity in the trade industry (retail, wholesale, motor trade, catering and accommodation) falling by 27,0%.3
The country alternated between various lockdown levels in 2020 and 2021 as it battled consecutive waves of the virus. Trade faltered notably in July 2021, mainly due to the civil disorder and widespread looting that occurred in KwaZulu-Natal and Gauteng. The country was also placed under Alert Level 4 lockdown from 28 June to 25 July as the health sector battled a third wave of infections.
The latest retail trade sales statistical release provides data for September 2022. The results for November, which will cover this year’s Black Friday, will be published on 18 January 2023. For consumers weary of the pandemic, the 25th of November will be the first lockdown-free Black Friday in two years.
For more information, download the latest retail trade sales statistical release and Excel data here.
1 The data used in this article represent unadjusted retail trade sales at constant 2019 prices.
2 BusinessTech, Takealot.com prepares for record volumes for its annual Blue Dot Sale (read here).
3 Stats SA, Gross Domestic Product (GDP), 2nd quarter 2022 (download the release and Excel files here).