
The state of the electricity, gas & water supply industry (2021)
National electricity supply has been the cause of intense concern for many years. Stats SA’s latest detailed survey of the industry provides updated data on finances, production and employment.
Covering electricity, gas and water supply in the formal economy, the 2021 survey continues on from similar surveys conducted in 2006, 2010, 2013, 2016 and 2019. The time series provide valuable insights into how key characteristics of the industry have shifted over the last 15 years.
The country continues to produce less electricity
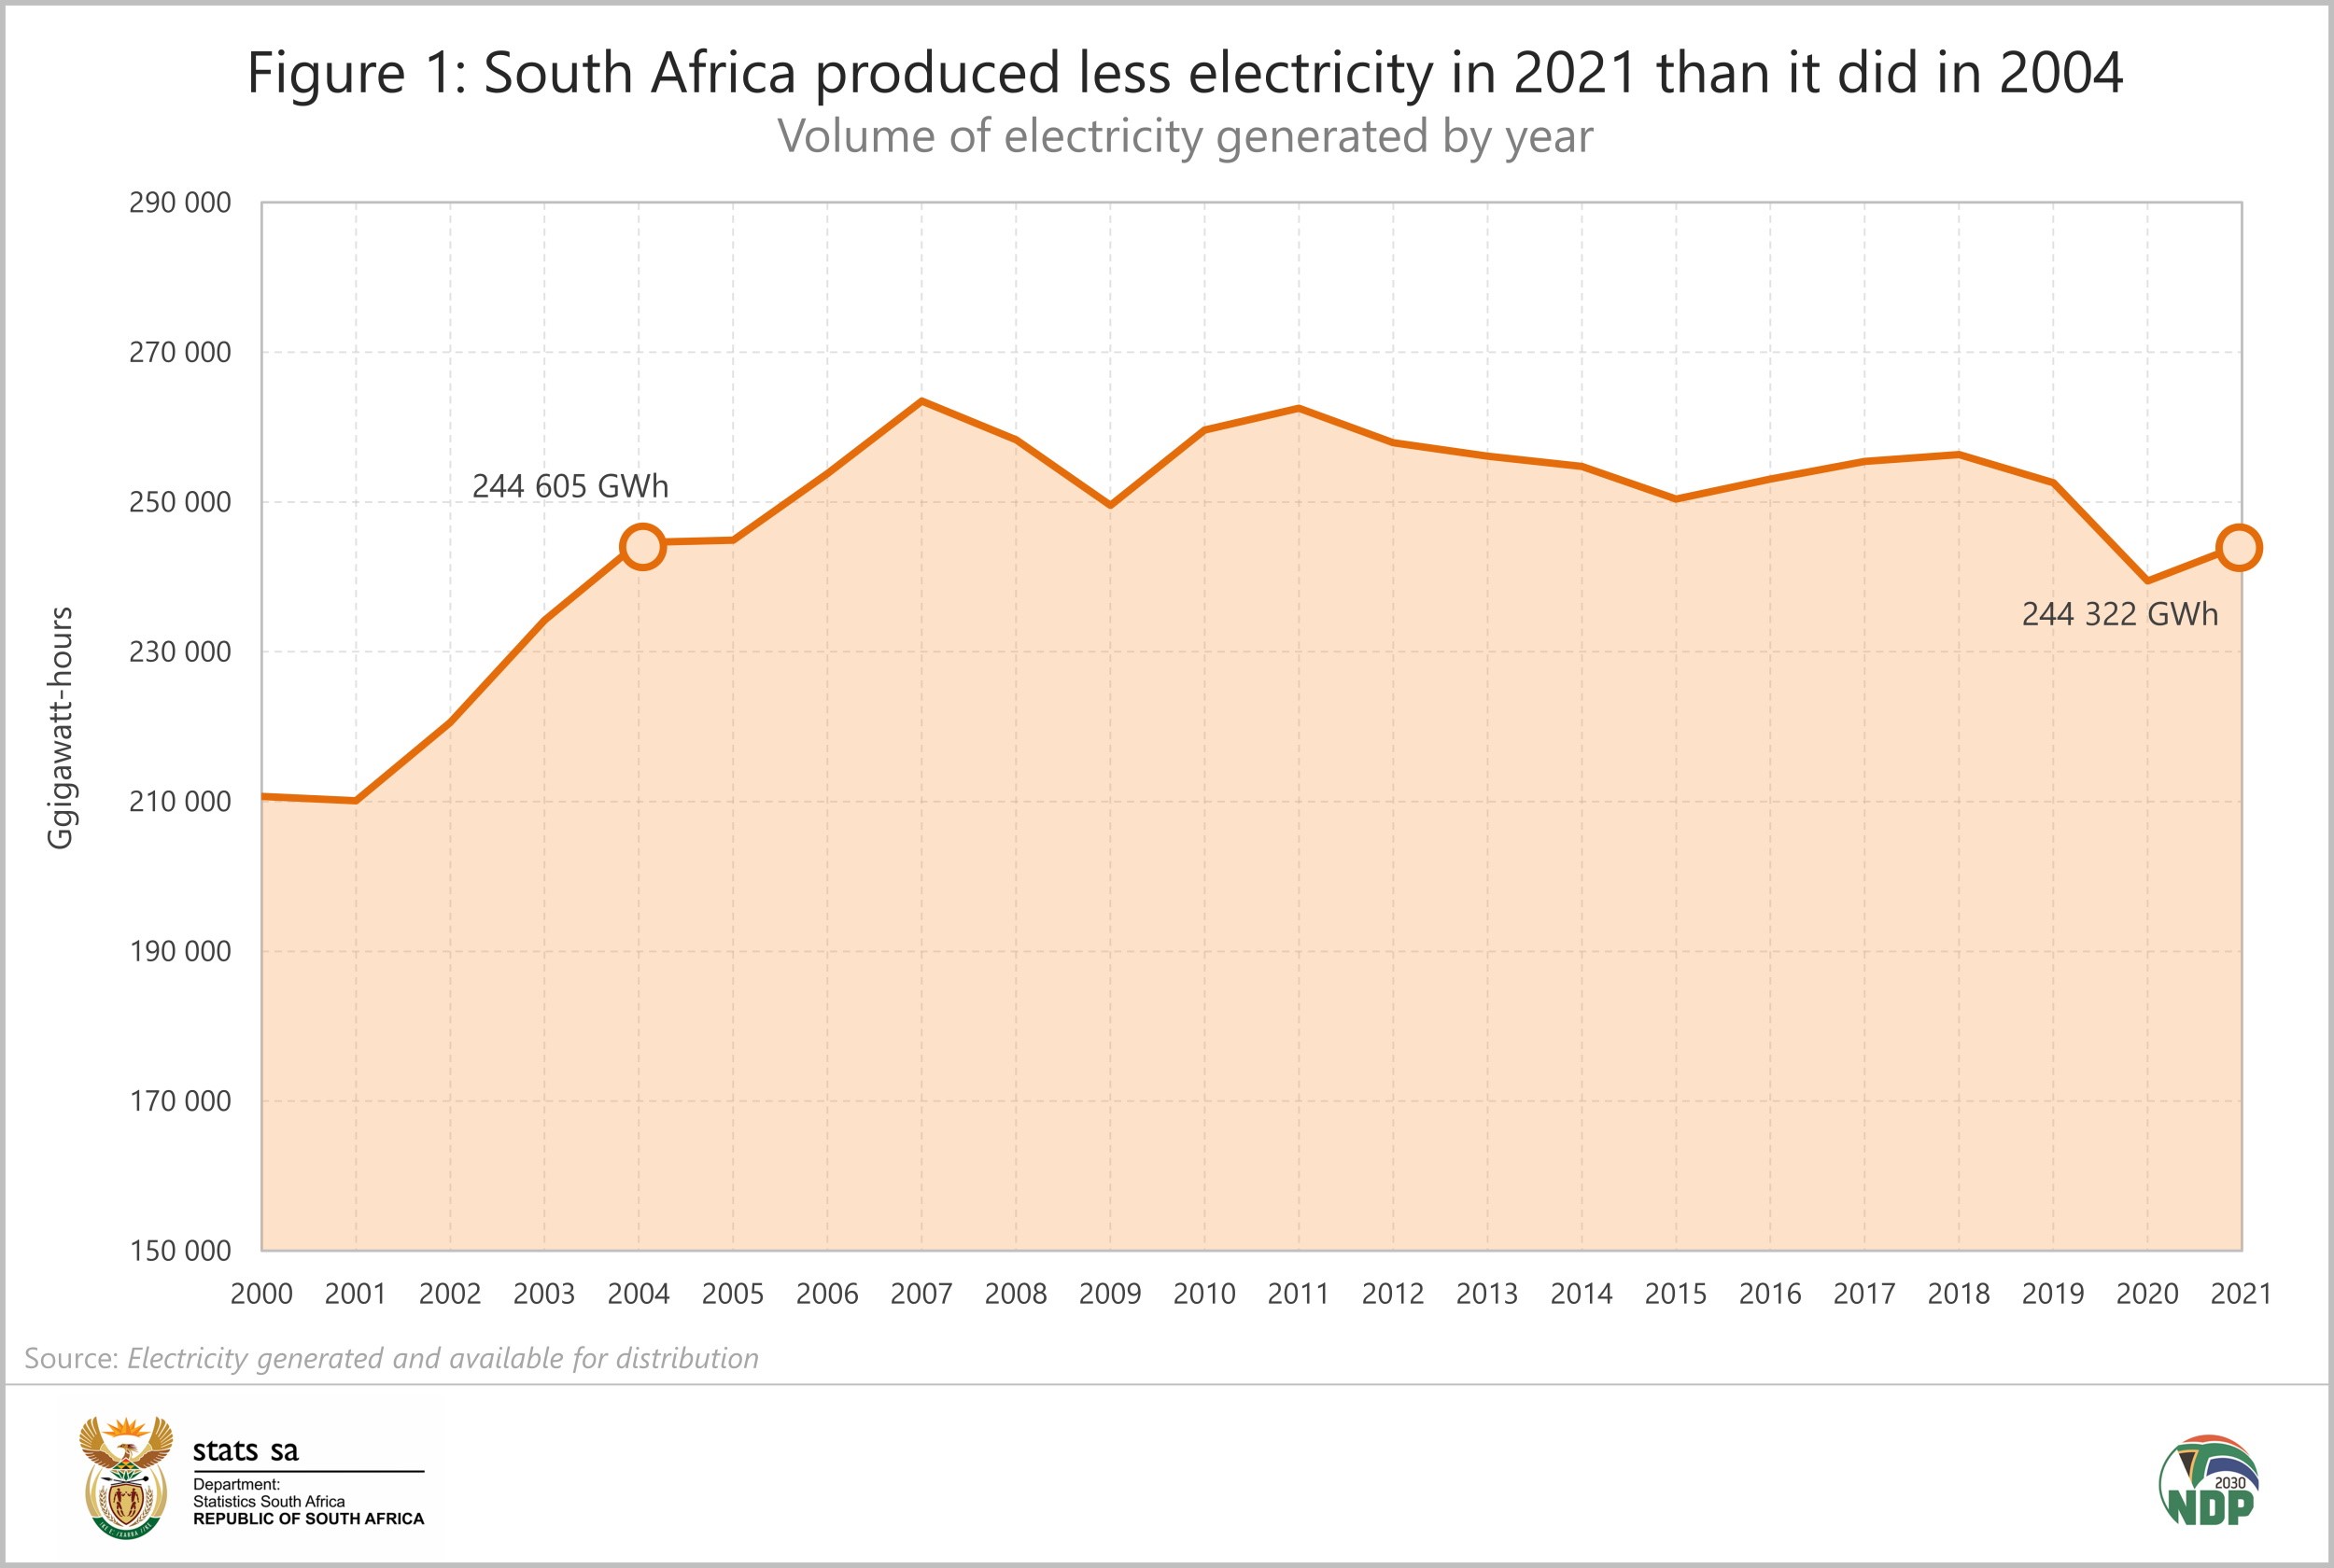
A critical variable published in the Electricity, gas and water supply industry statistical report is electricity production. According to the survey, South African electricity generation declined by 7,4% between 2019 and 2021. In fact, taking a quick look at the 2006 survey,1 the country produced less electricity in 2021 than it did in 2006.
Stats SA’s monthly Electricity generated and available for distribution statistical release provides a longer time series.2 Figure 1, an update to a similar analysis conducted in 2021,3 illustrates how subdued electricity generation has been over time. Even though the country produced more electricity in 2021 than it did in 2020, the level of production is still lower than it was in 2004. In 2022 we have seen extended periods of load shedding, with electricity generation down by 3,6% year-on-year for the period January to September 2022.
Employment numbers continue to wane
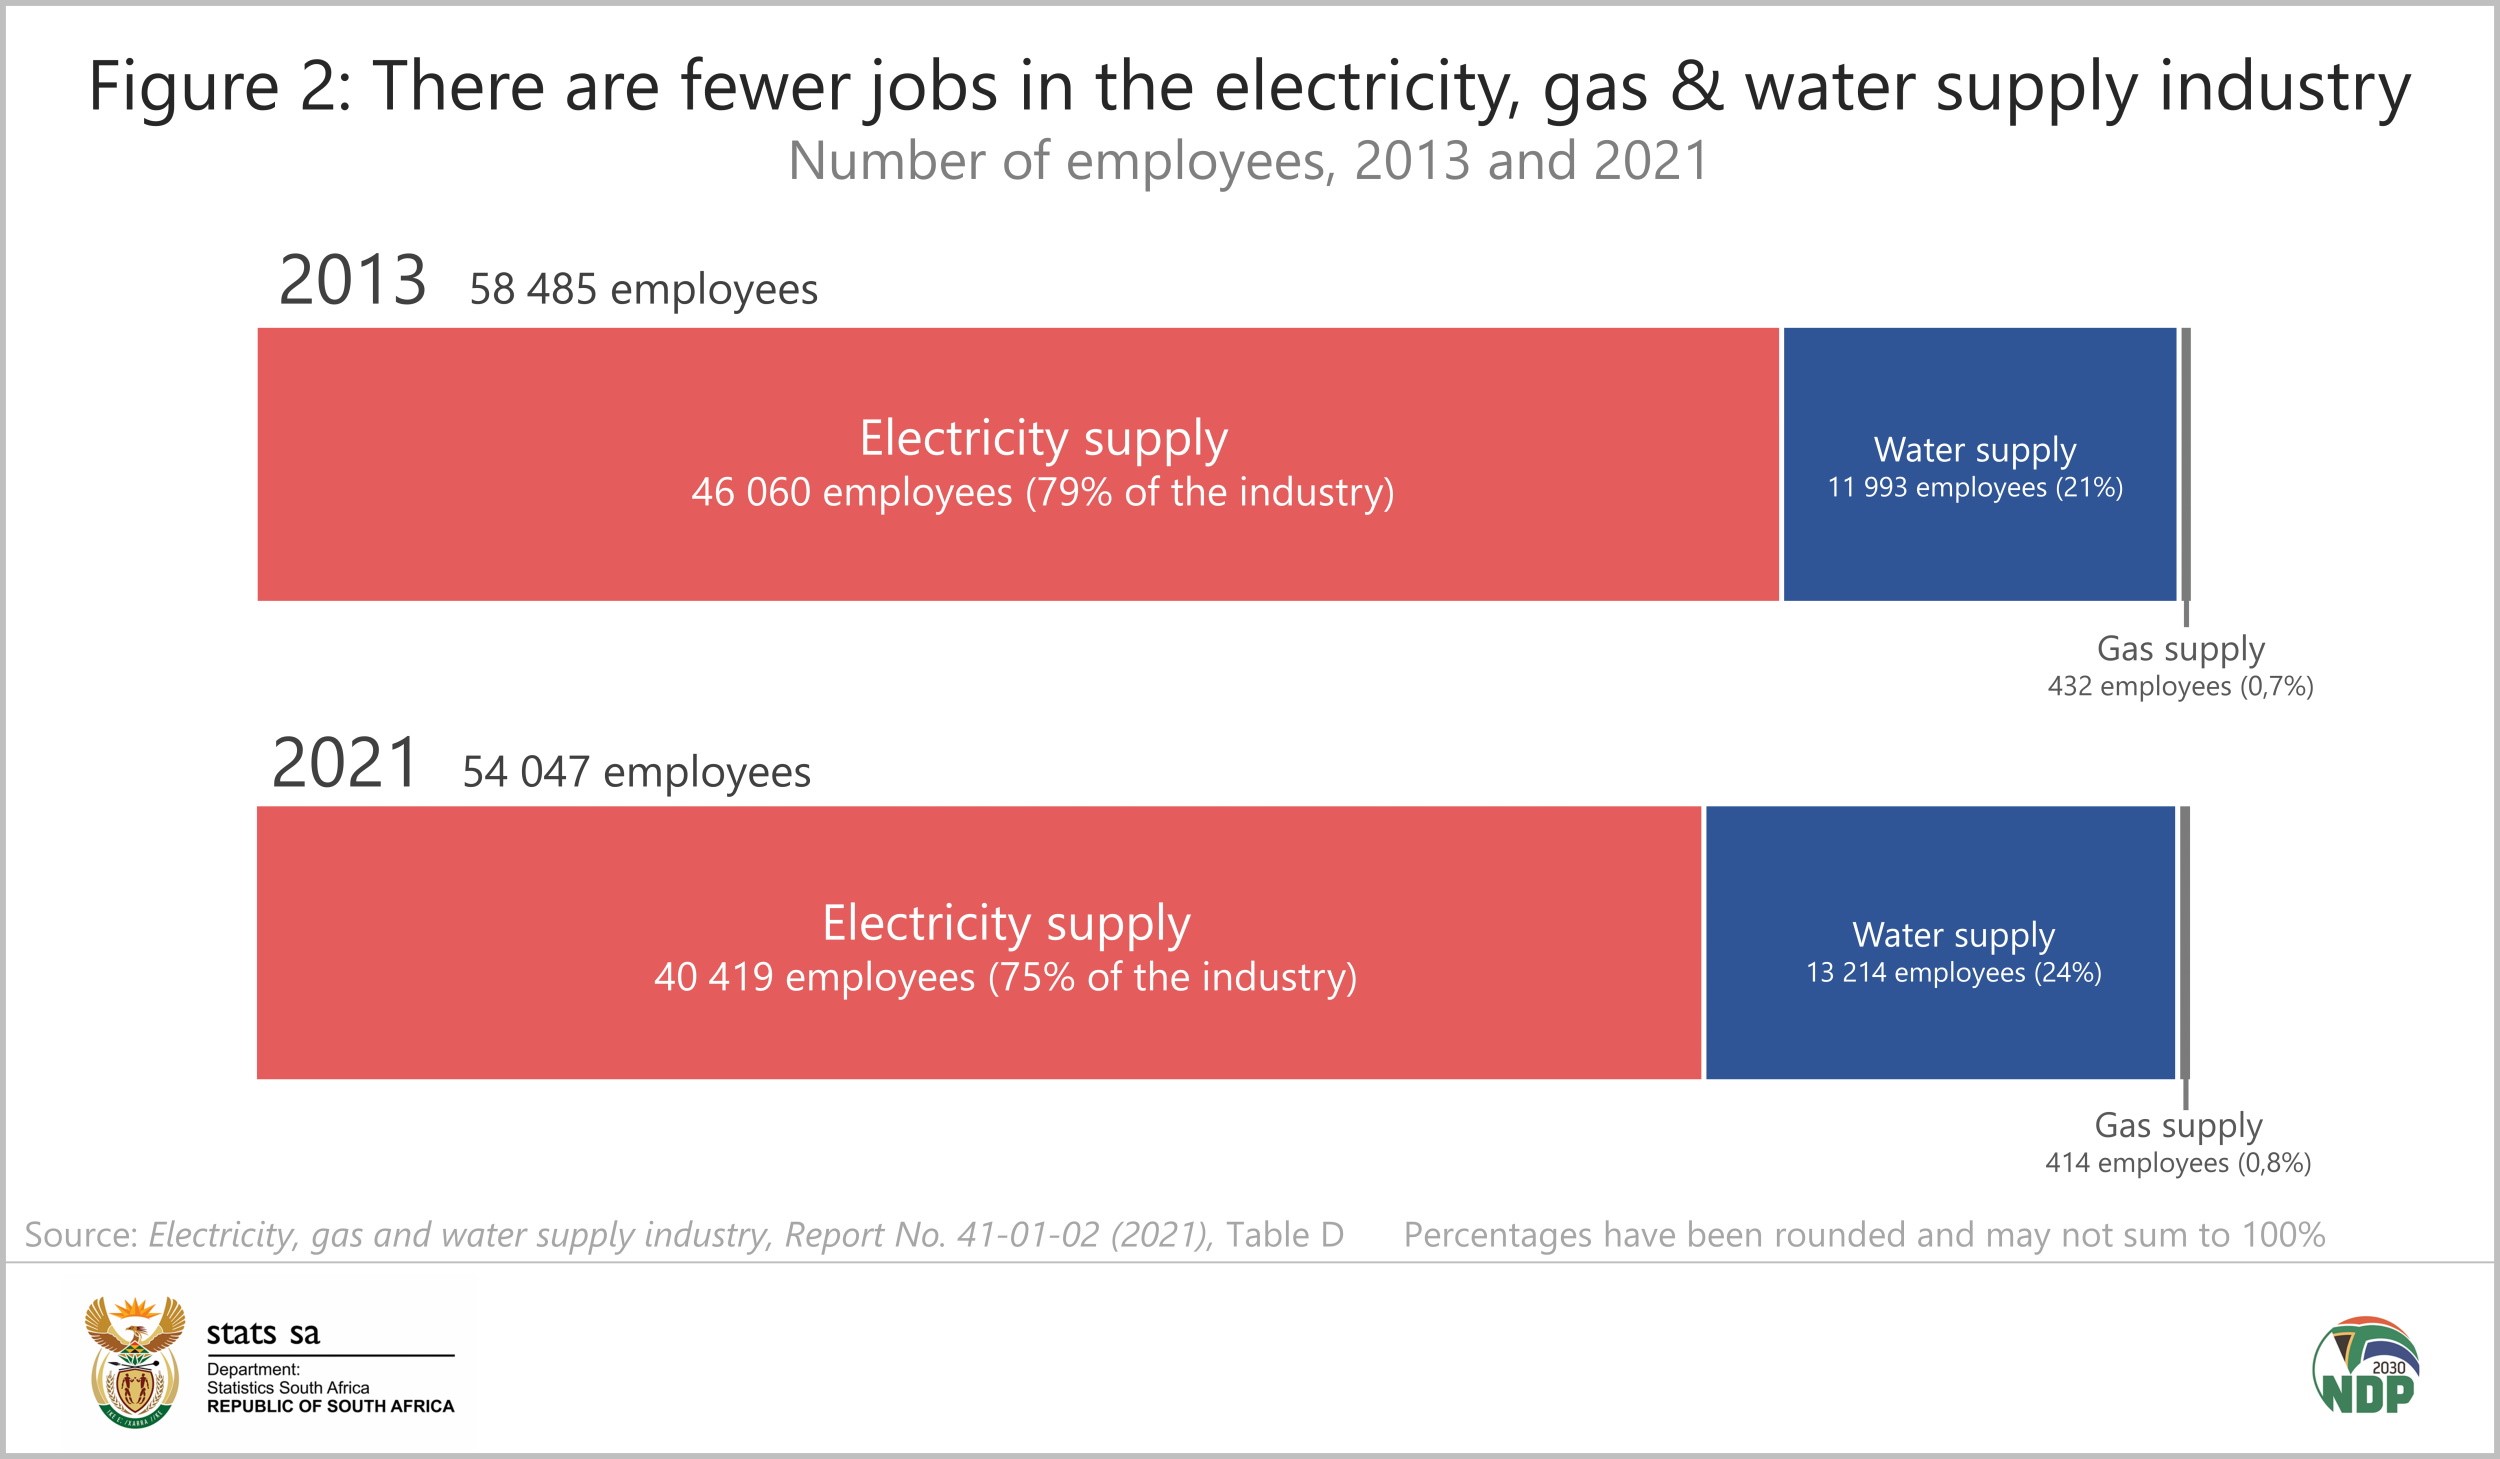
The 2019 Electricity, gas and water supply survey reported a loss of jobs in the industry.2 Thereafter the number of employed declined further, with the industry recording a net loss of 2 574 jobs in 2021 compared with 2019. This represents a decline of 4,5%.
Since 2013, the workforce in the industry has contracted by 4 438 jobs (Figure 2), with the electricity supply sector responsible for the biggest losses. In contrast, activities related to the supply of water recorded a net gain in employment between 2013 and 2021.
Operating at a loss
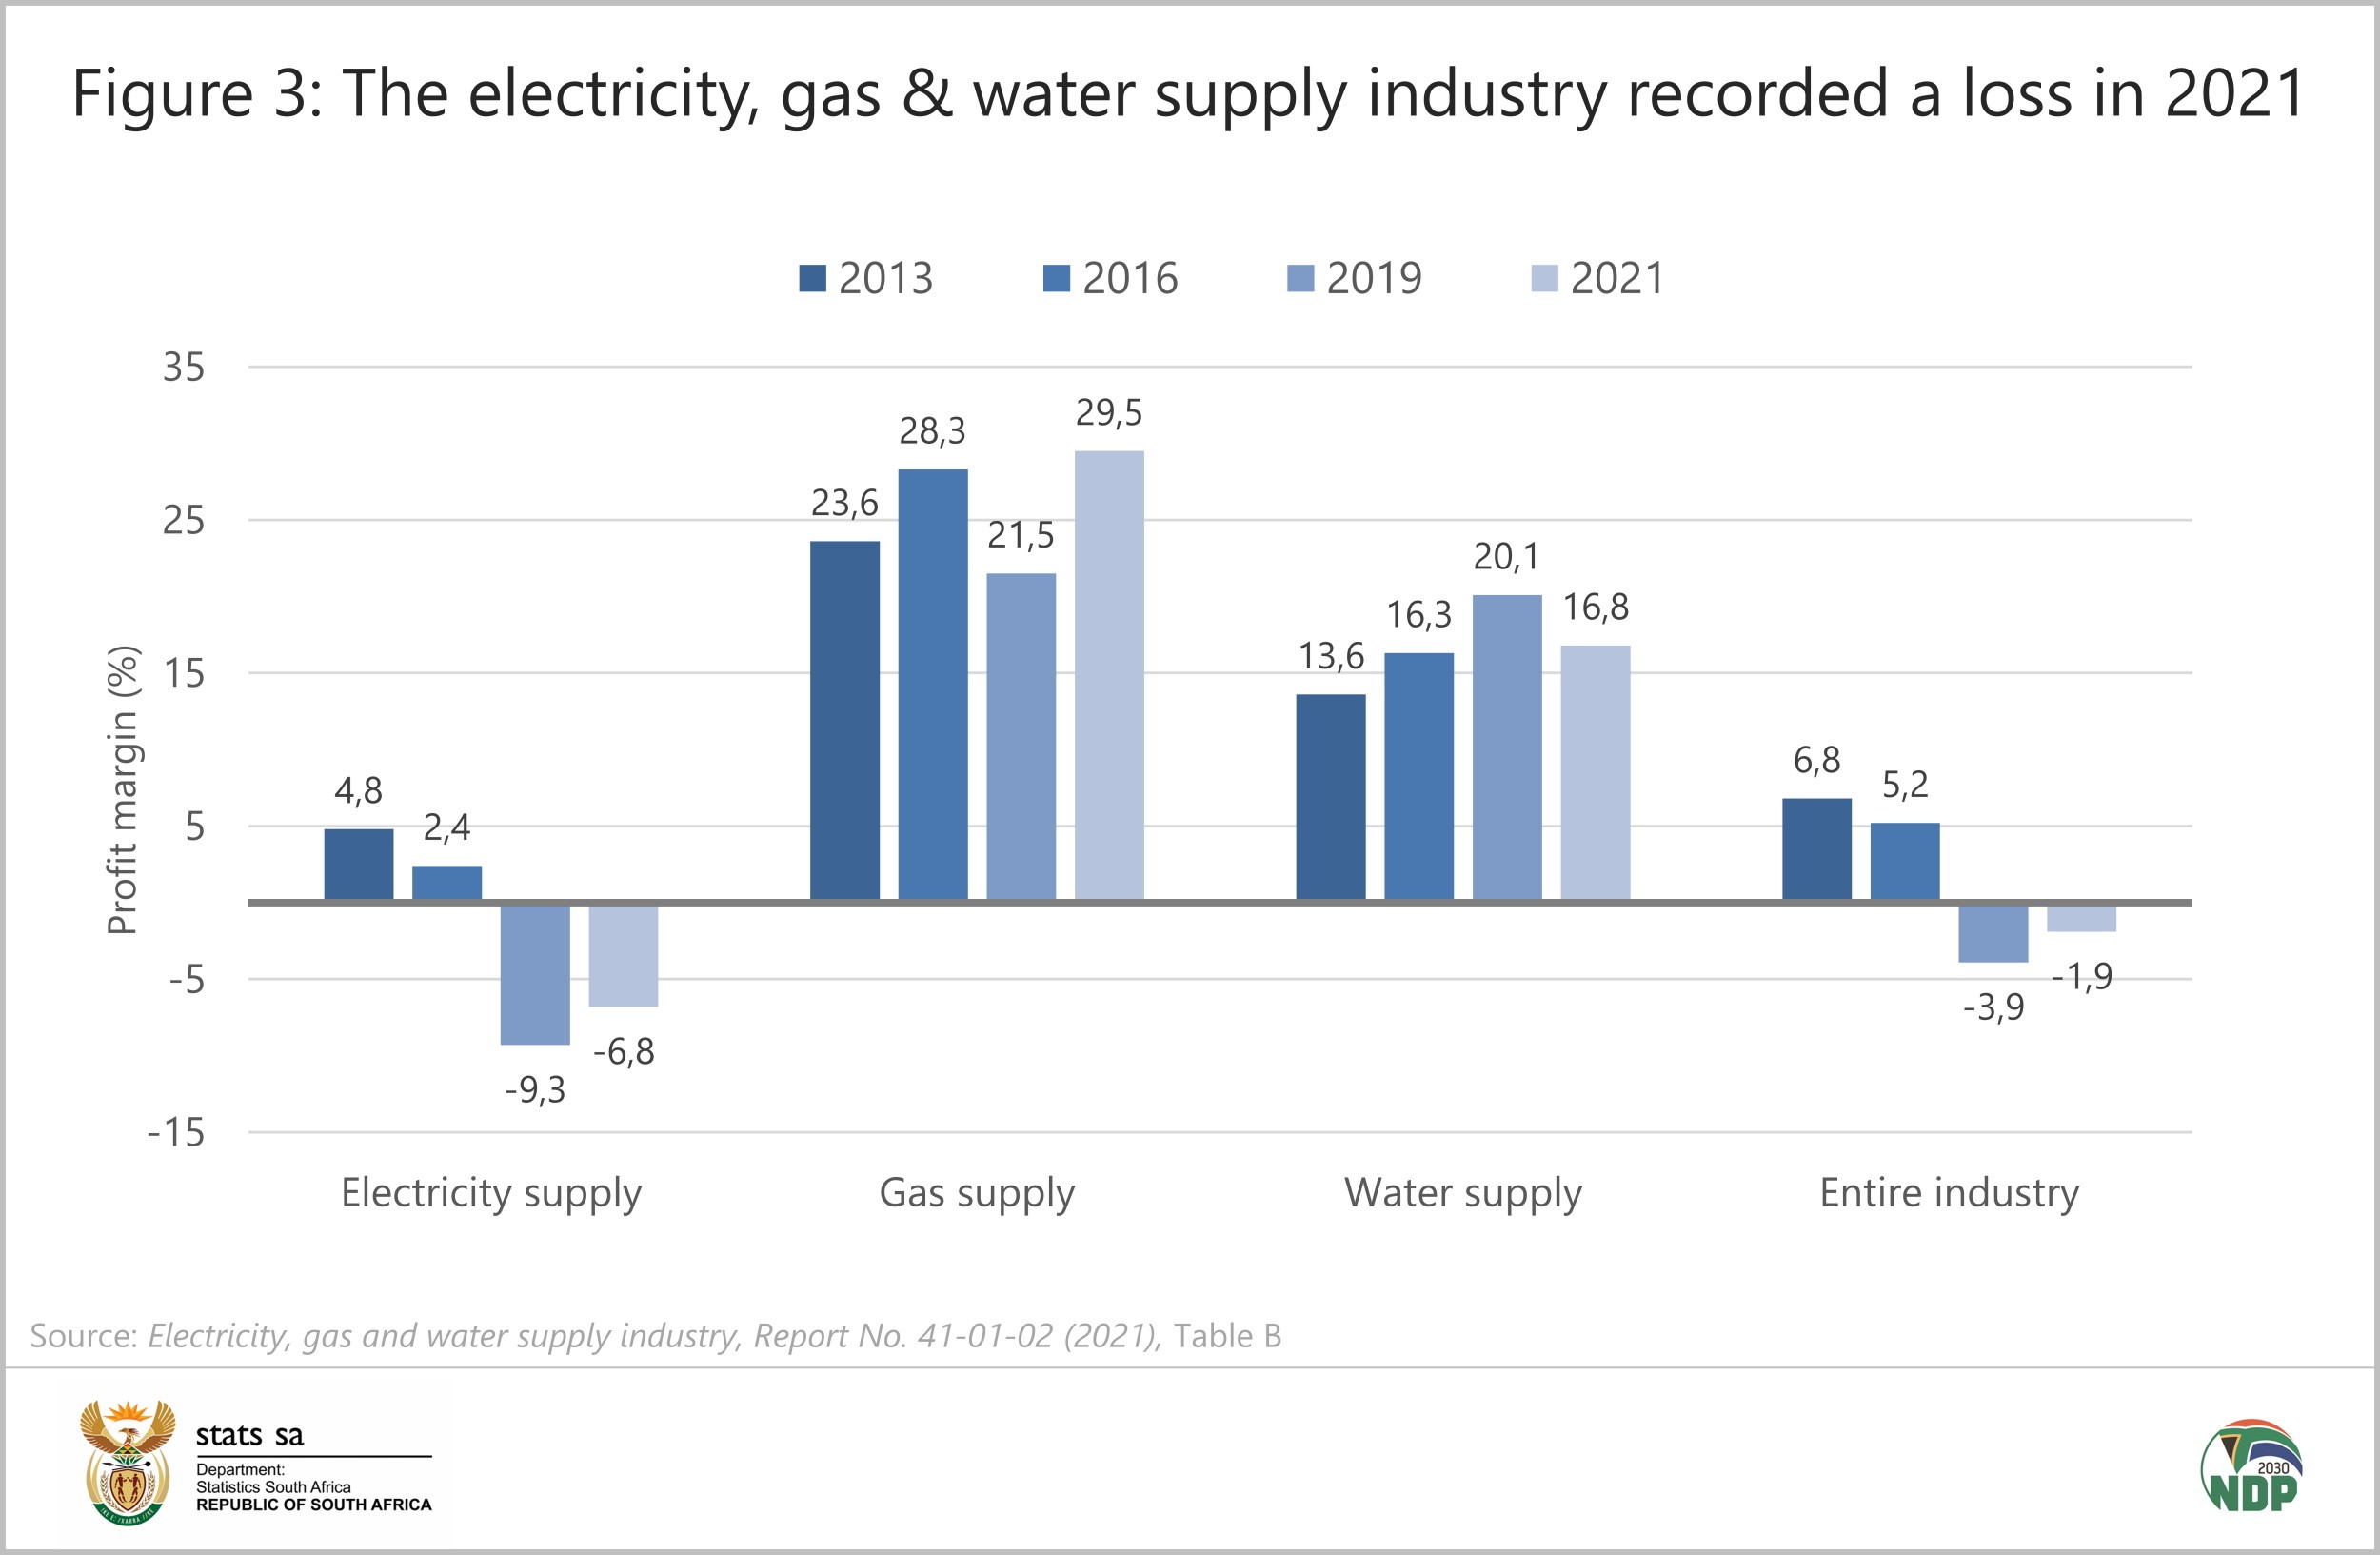
The industry recorded losses in both the 2019 and 2021 surveys, dragged lower by the electricity supply sector. The profit margin for the industry as a whole was ‑3,9% in 2019 and ‑1,9% in 2021 (Figure 3). The gas supply sector recorded the highest profit margin (29,5%) in 2021.
Renewables on the rise
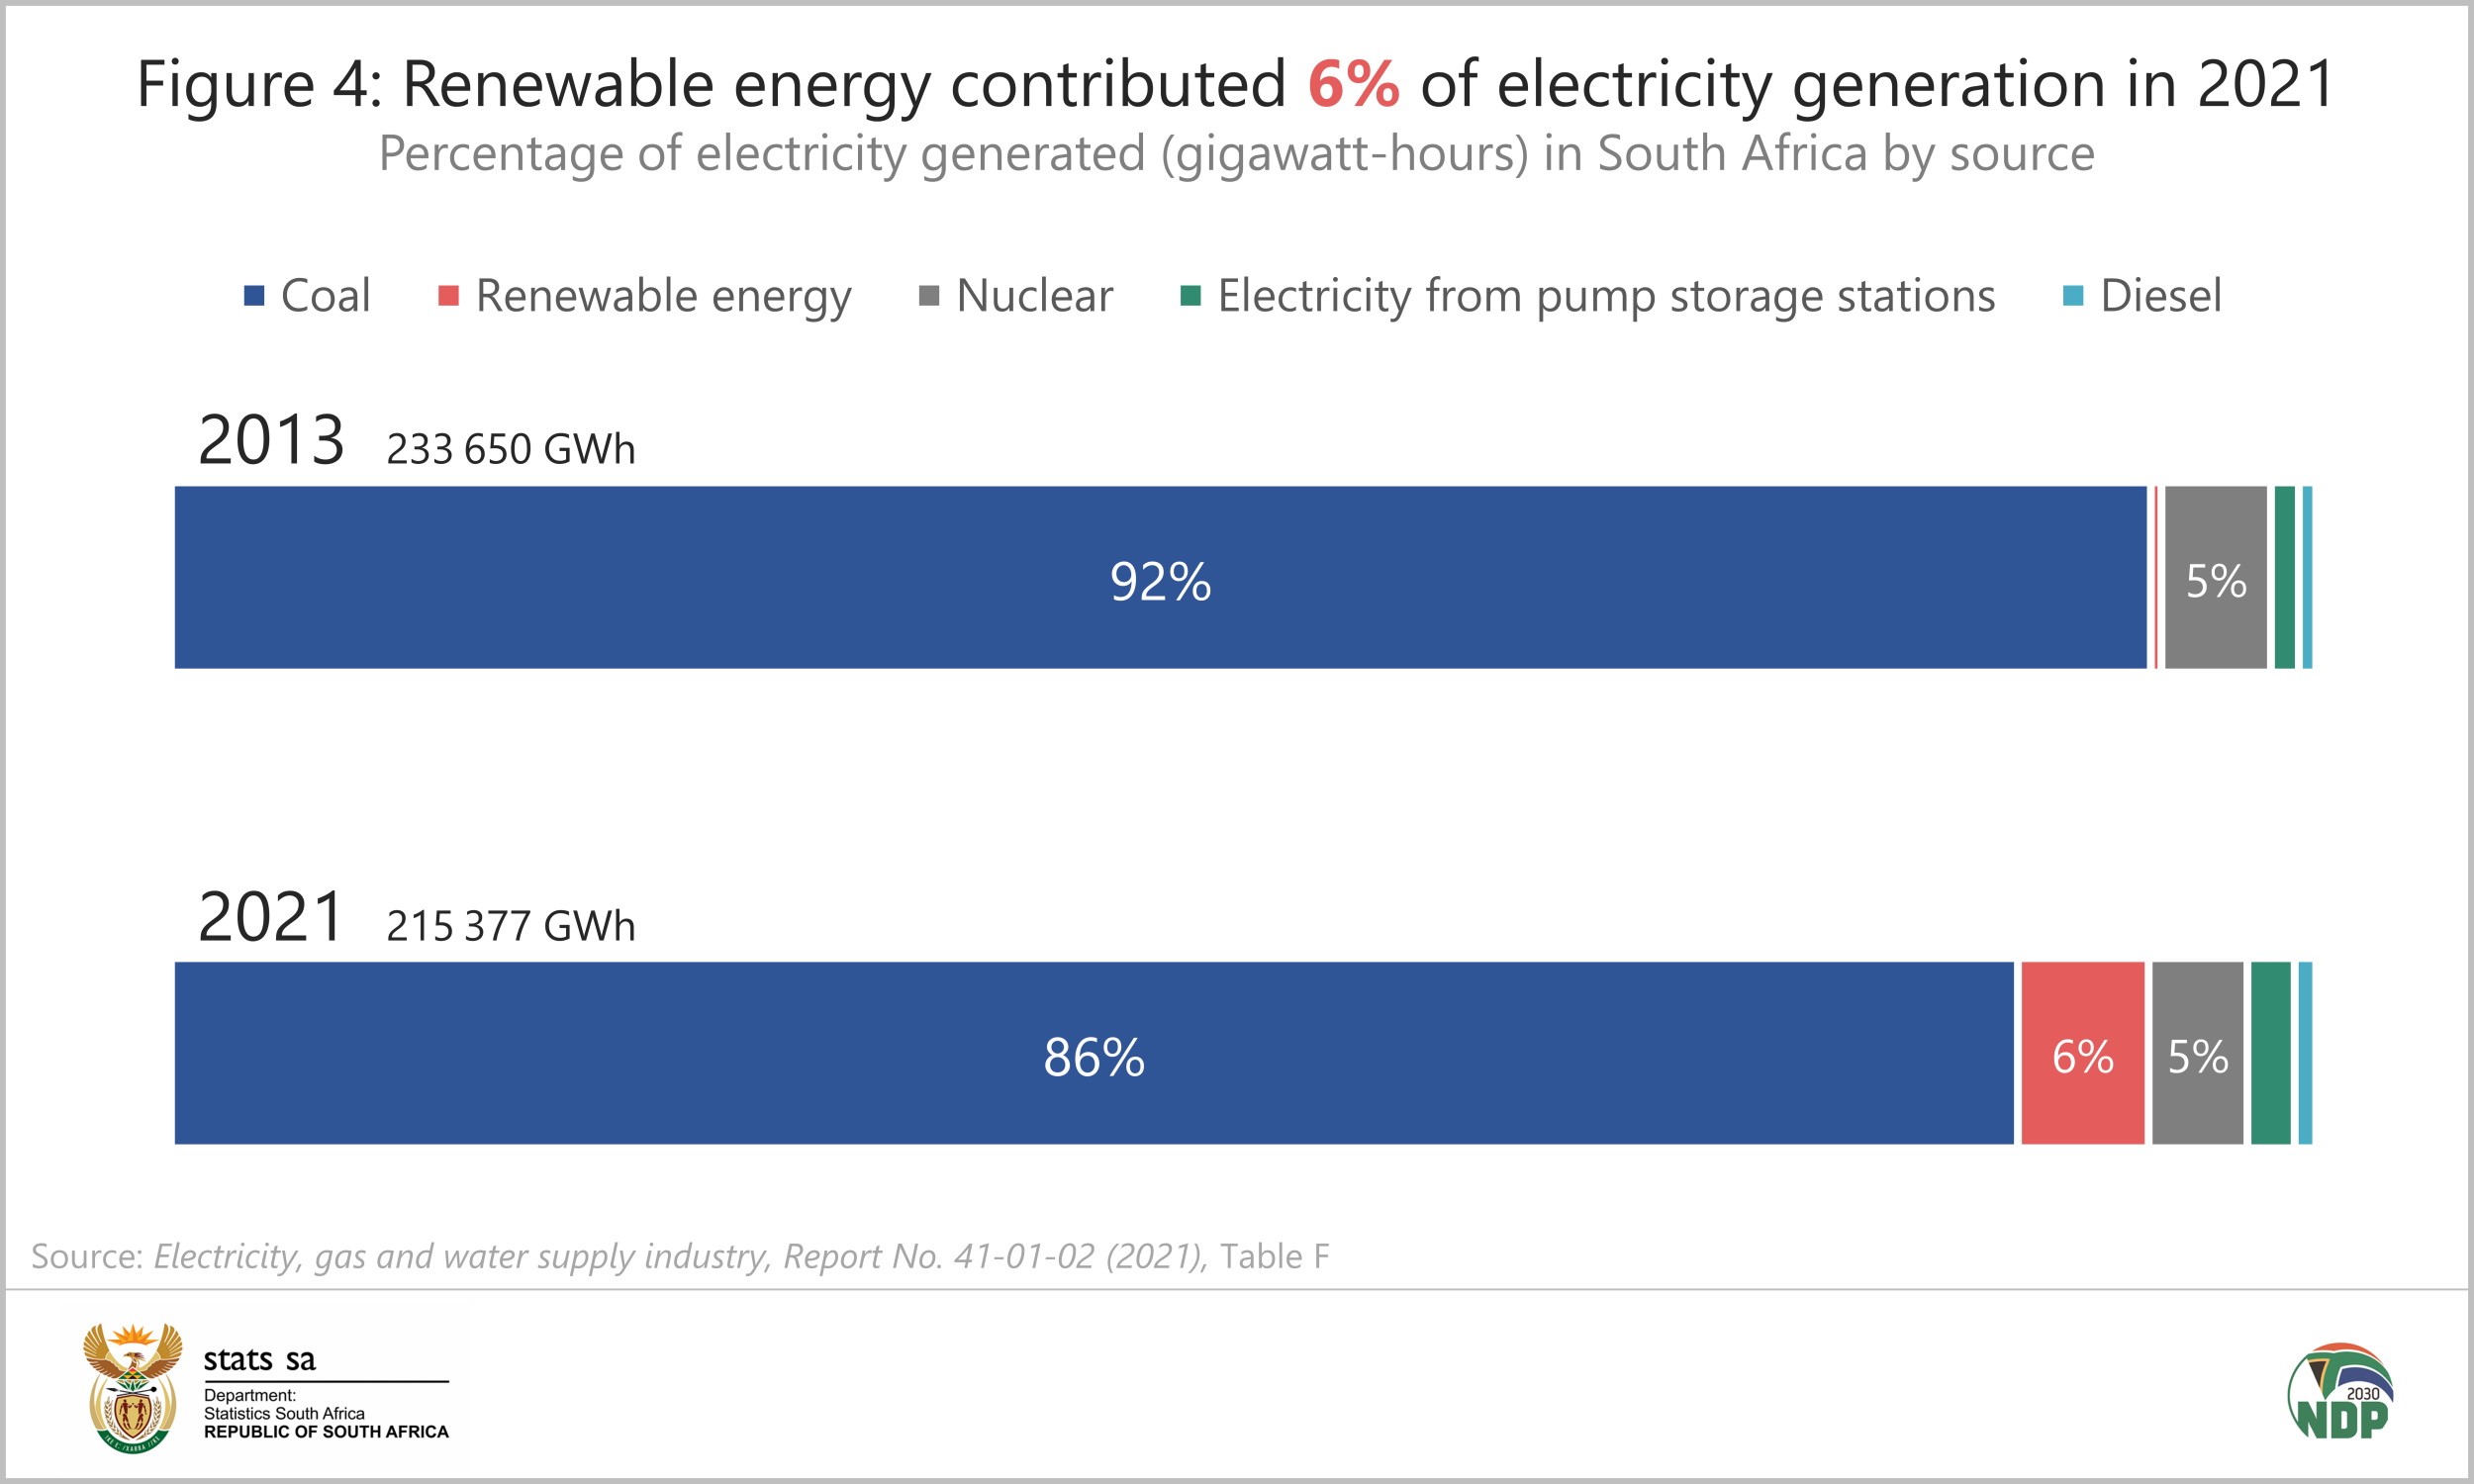
It’s not all bad news. One of the upbeat results from the 2021 survey is that renewables continue to make headway in the energy generation space (Figure 4). In 2013, renewable energy contributed 0,5% of total electricity production in South Africa, rising to 2,2% in 2016, 4,8% in 2019 and 6,1% in 2021.
For more information, download the latest Electricity, gas and water supply industry statistical report here.
1 Stats SA, Electricity, gas and water supply industry, 2006 (Report 41-01-02), Table 9 (download here).
2 Stats SA, Electricity generated and available for distribution (available here).
3 Stats SA, Five facts about the electricity, gas & water supply industry (2019) (read here).
Similar articles are available on the Stats SA website and can be accessed here.
For a monthly overview of economic indicators and infographics, catch the latest edition of the Stats Biz newsletter here.