
Economic recovery from COVID-19: Not all countries are equal
The South African economy took almost two years to recover from the worst of the COVID-19 pandemic. How does this compare with other countries?
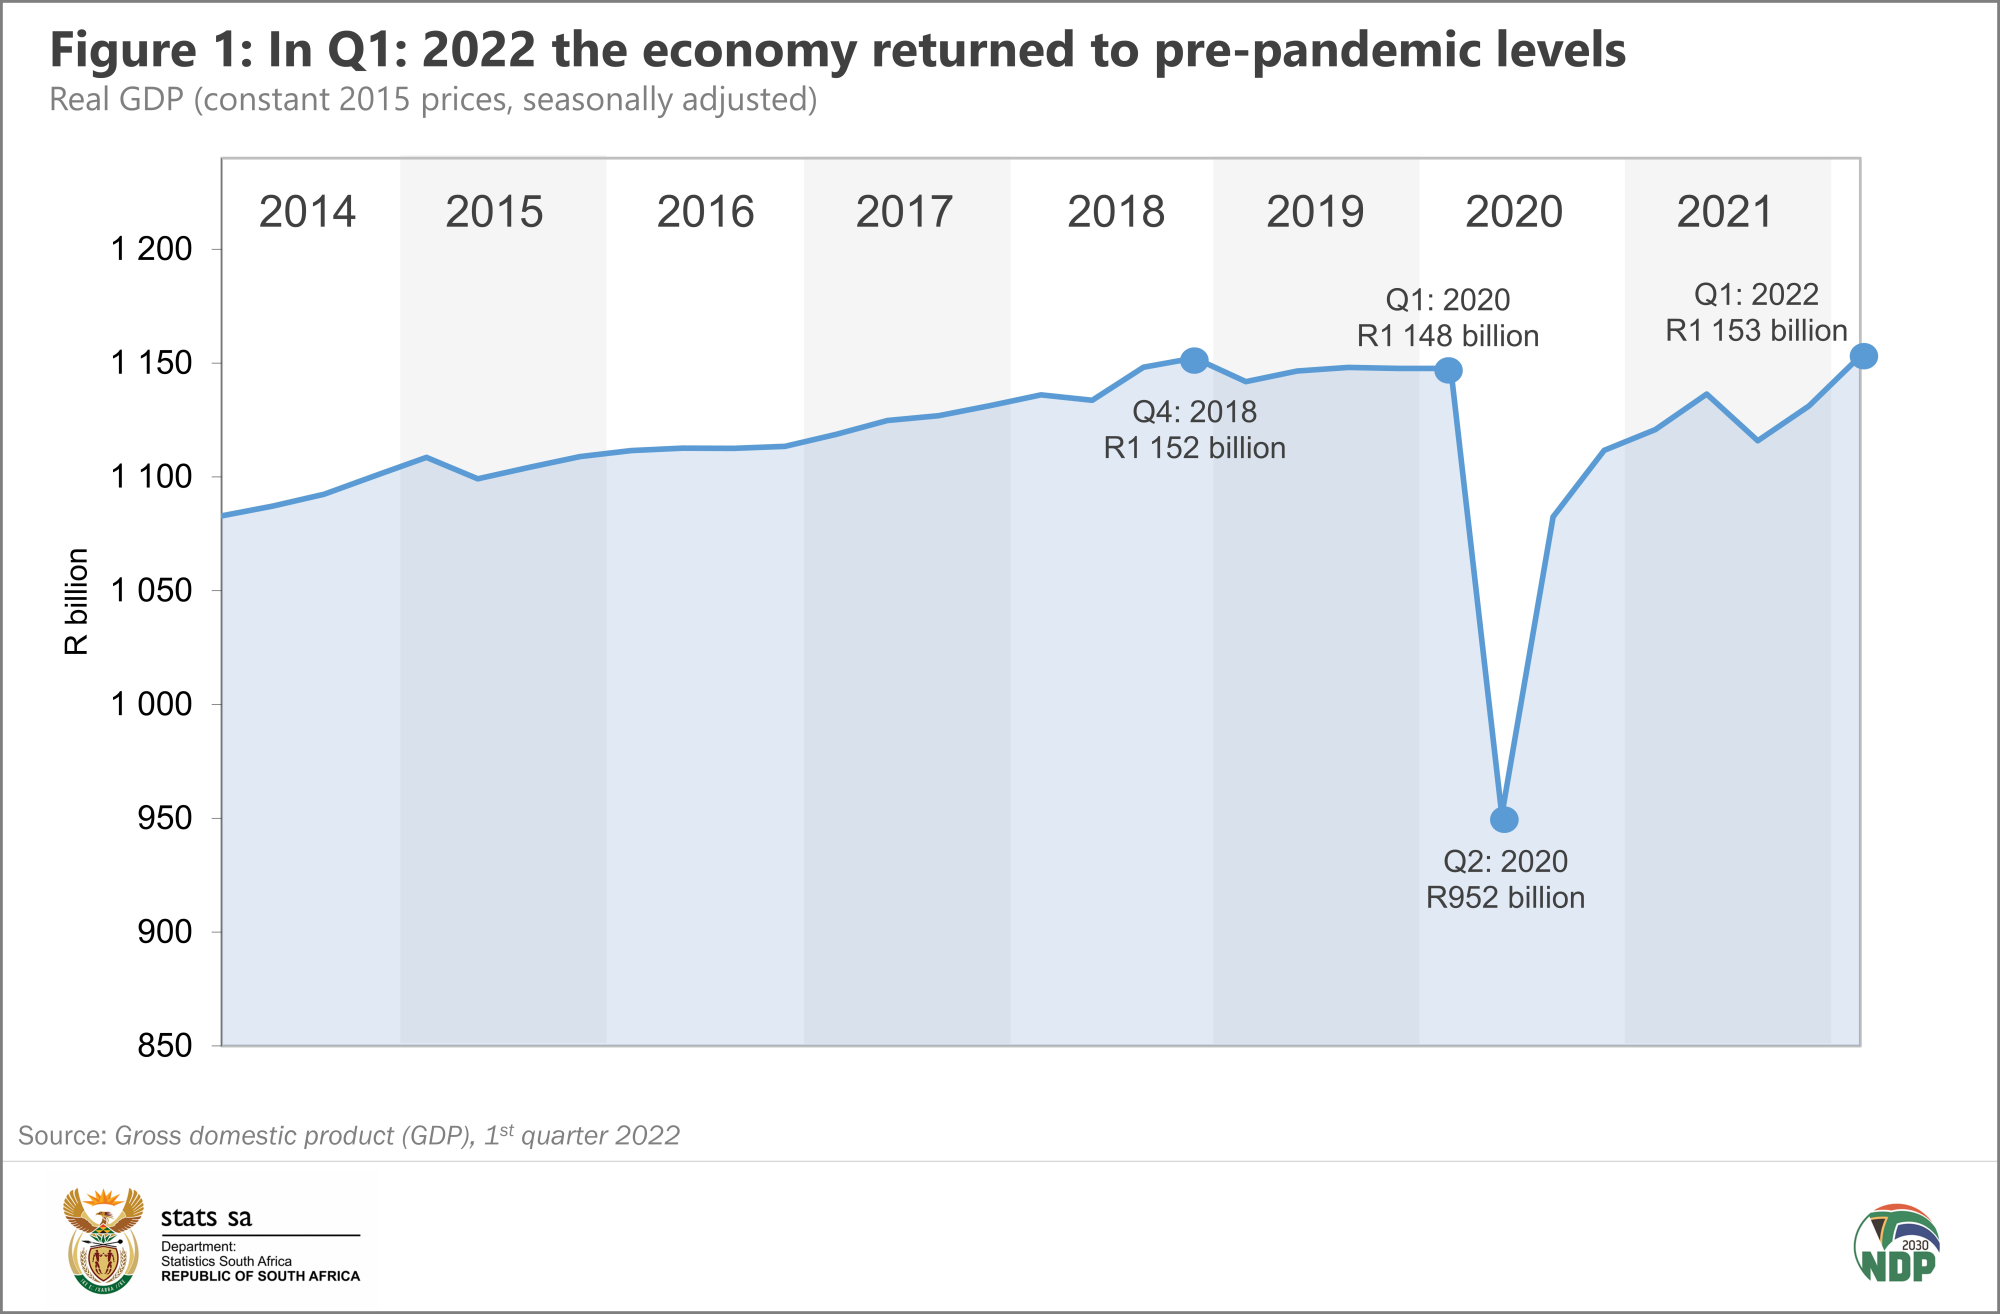
After plummeting in the second quarter of 2020 – when lockdown restrictions were at their most stringent – South African gross domestic product (GDP) clawed itself back to pre-pandemic levels in the first quarter of 2022 (Q1: 2022). This was highlighted in Stats SA’s most recent set of GDP results released in June (Figure 1).1
Compared with 51 other nations, South Africa’s recovery has been sluggish, according to data from the International Monetary Fund (IMF).2
The world economy started feeling the ill-effects of the pandemic in Q1: 2020. This was followed by a sharp downturn in global production in the second quarter as countries scrambled to impose hard lockdowns.
Although the initial economic effects of the pandemic were felt at different times in different countries, all the countries in this analysis reached their lowest level of GDP in Q2: 2020. Economic recovery times can be assessed with reference to two reference periods, namely Q4: 2019 (when economic activity was still ‘normal’ across all countries), and the low point of Q2: 2020. The heat map in Figure 2 shows a comparison between South Africa and its major trading partners where comparable GDP statistics are available from the IMF database. It can be used to determine how many quarters after Q2: 2020 it took for GDP to return to its Q4: 2019 level (click on the image to enlarge).
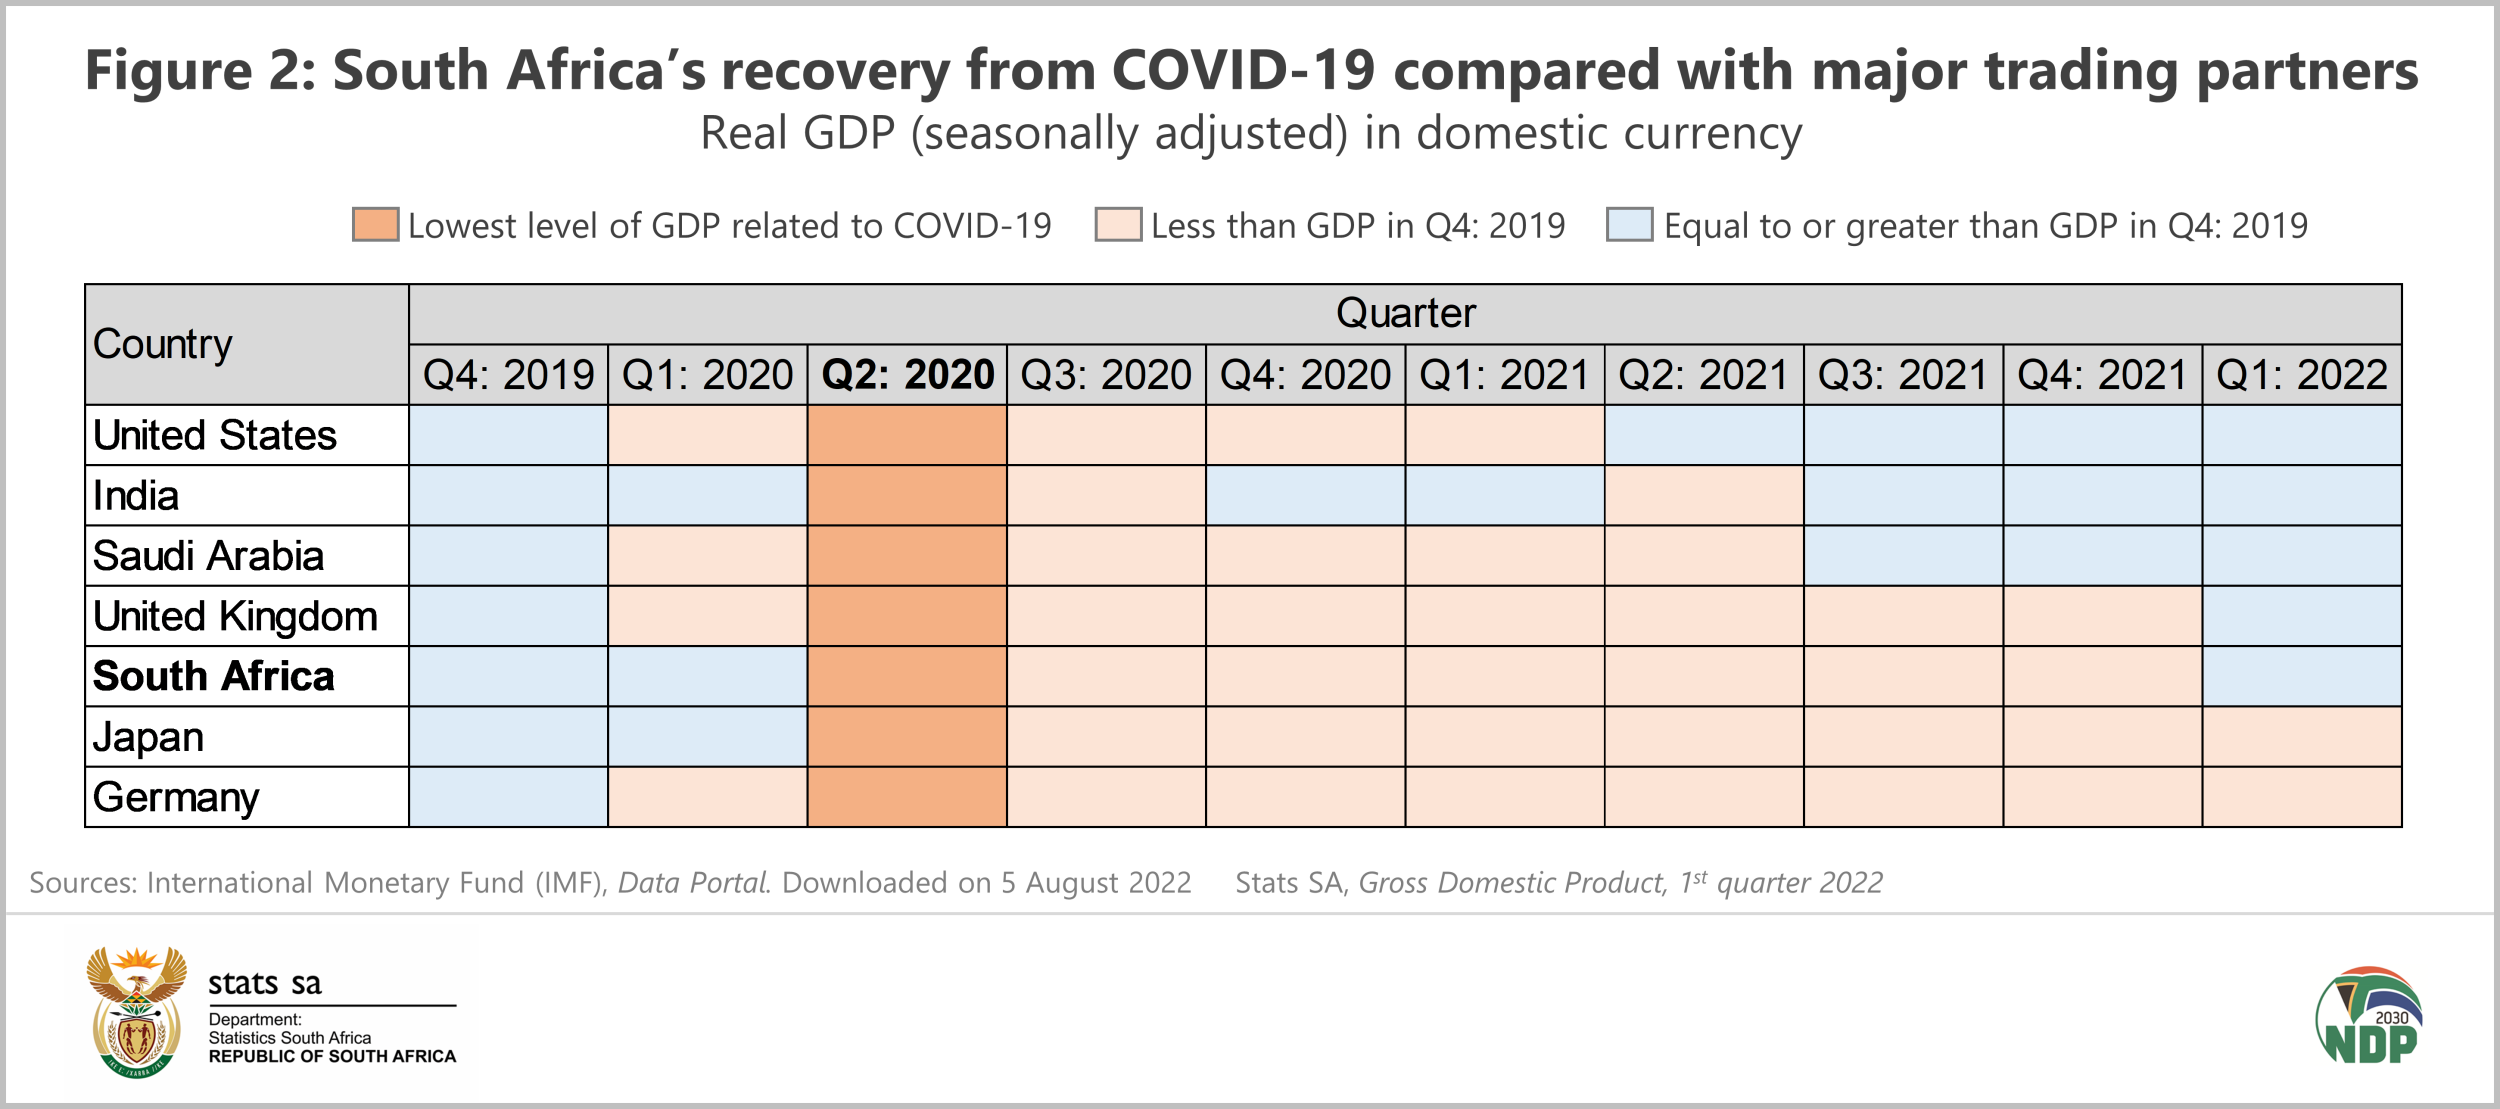
Sorted from quickest to slowest in terms of recovery, the United States is shown first in Figure 2. The GDP of the United States took four quarters (from the collapse in Q2: 2020) to get back to its pre-pandemic level, reaching it in Q2: 2021. South Africa’s recovery extended over seven quarters, reaching its pre-pandemic level in Q1: 2022. Germany and Japan had not fully recovered by Q1: 2022.
One country was not able to consistently hold onto its gains. India was above water for two quarters before hitting a speedbump in Q2: 2021.
Figure 2 was created from real GDP (seasonally adjusted) quarterly figures, expressed in domestic currency. The advantage of using this specific metric is that it allows us to compare with Stats SA’s data used in Figure 1. The disadvantage is that this specific variable is only available for a limited number of countries in the IMF database, which unfortunately doesn’t include other African nations.
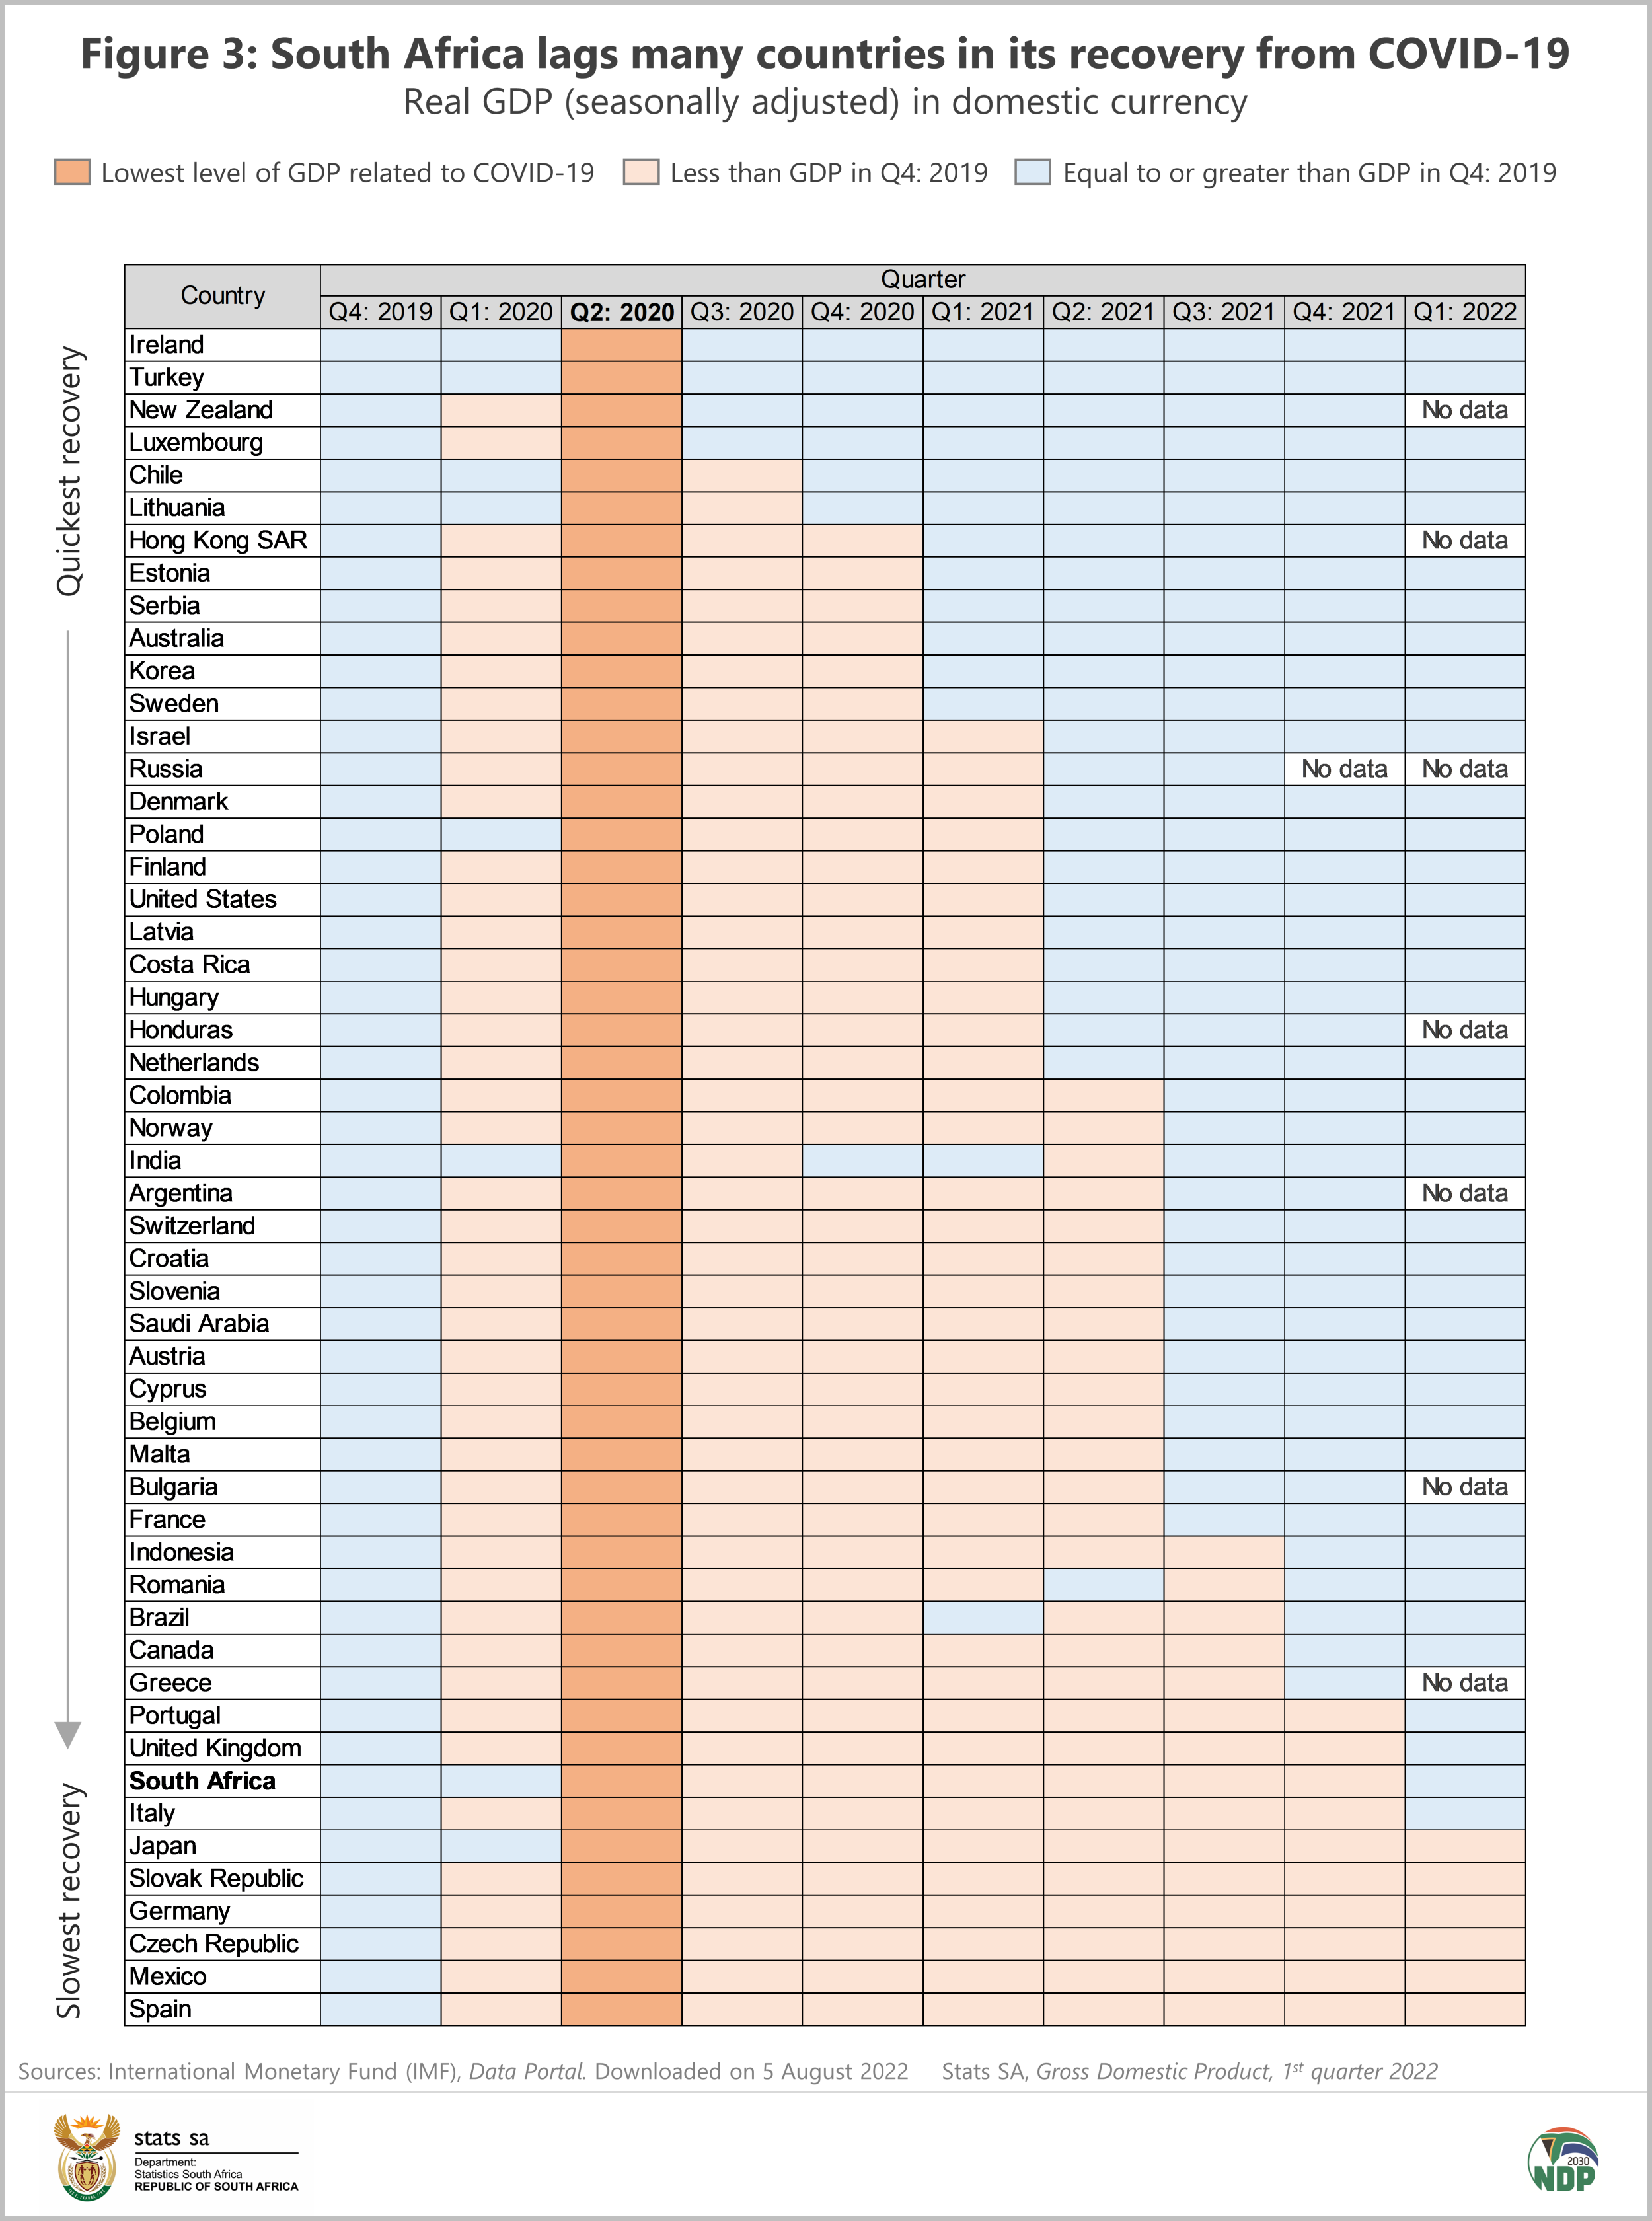
Data are also not available for China, which is why this global heavyweight is also absent in Figure 3 below. The data for 52 countries appear in Figure 3, with Ireland, Turkey, New Zealand and Luxembourg forming a clan of nations that immediately – in terms of this indicator, at least – got back on their feet after Q2: 2020.
South Africa appears near the bottom of this list, representing a relatively sluggish recovery.
Of course, GDP is only a single indicator which does not capture the many nuances inherent in each economy. This analysis doesn’t take into account other economic indicators (such as inflation or unemployment figures) and also doesn’t consider that different rates of recovery may be occurring in different parts of an economy. As the old saying goes, the devil is in the detail.
On Tuesday, 6 September at 11h30 Stats SA will publish South African GDP figures for Q2: 2022, providing an indication of how the picture has changed. A follow-up article will explore the extent to which South African industries have recovered from the COVID-19 pandemic.
1 Stats SA, After two years, GDP returns to pre-pandemic levels (read here).
2 IMF data portal (visit here). Data were downloaded on 5 August 2022.
Similar articles are available on the Stats SA website and can be accessed here.
For a monthly overview of economic indicators and infographics, catch the latest edition of the Stats Biz newsletter here.