
Municipal finances and electricity: 11 years in perspective
Rising prices are hitting consumers hard, and the cost of electricity is no different.
Municipalities play a significant role in the distribution of electricity in South Africa. Acting mostly as intermediaries, municipalities buy electricity from Eskom and then resell it to businesses, homes and other institutions.
Eskom tariffs and purchases and sales of electricity
A key contributor to electricity prices in South Africa are the tariffs that Eskom levies on its customers, including municipalities. Using data from Eskom’s tariff books, MyBroadband reported that – between 1994 and 1999 – electricity price increases were generally lower than overall consumer inflation.1 In contrast, since the implementation of load shedding in 2007, electricity tariff hikes have generally exceeded inflation.
Table 1 shows the annual increases in Eskom’s municipal tariffs from 2010 to 20212, and compares this with the average increase in the headline consumer price index (CPI)3 in each financial year. With the exception of 2017‒2018, electricity tariff increases have exceeded inflation.
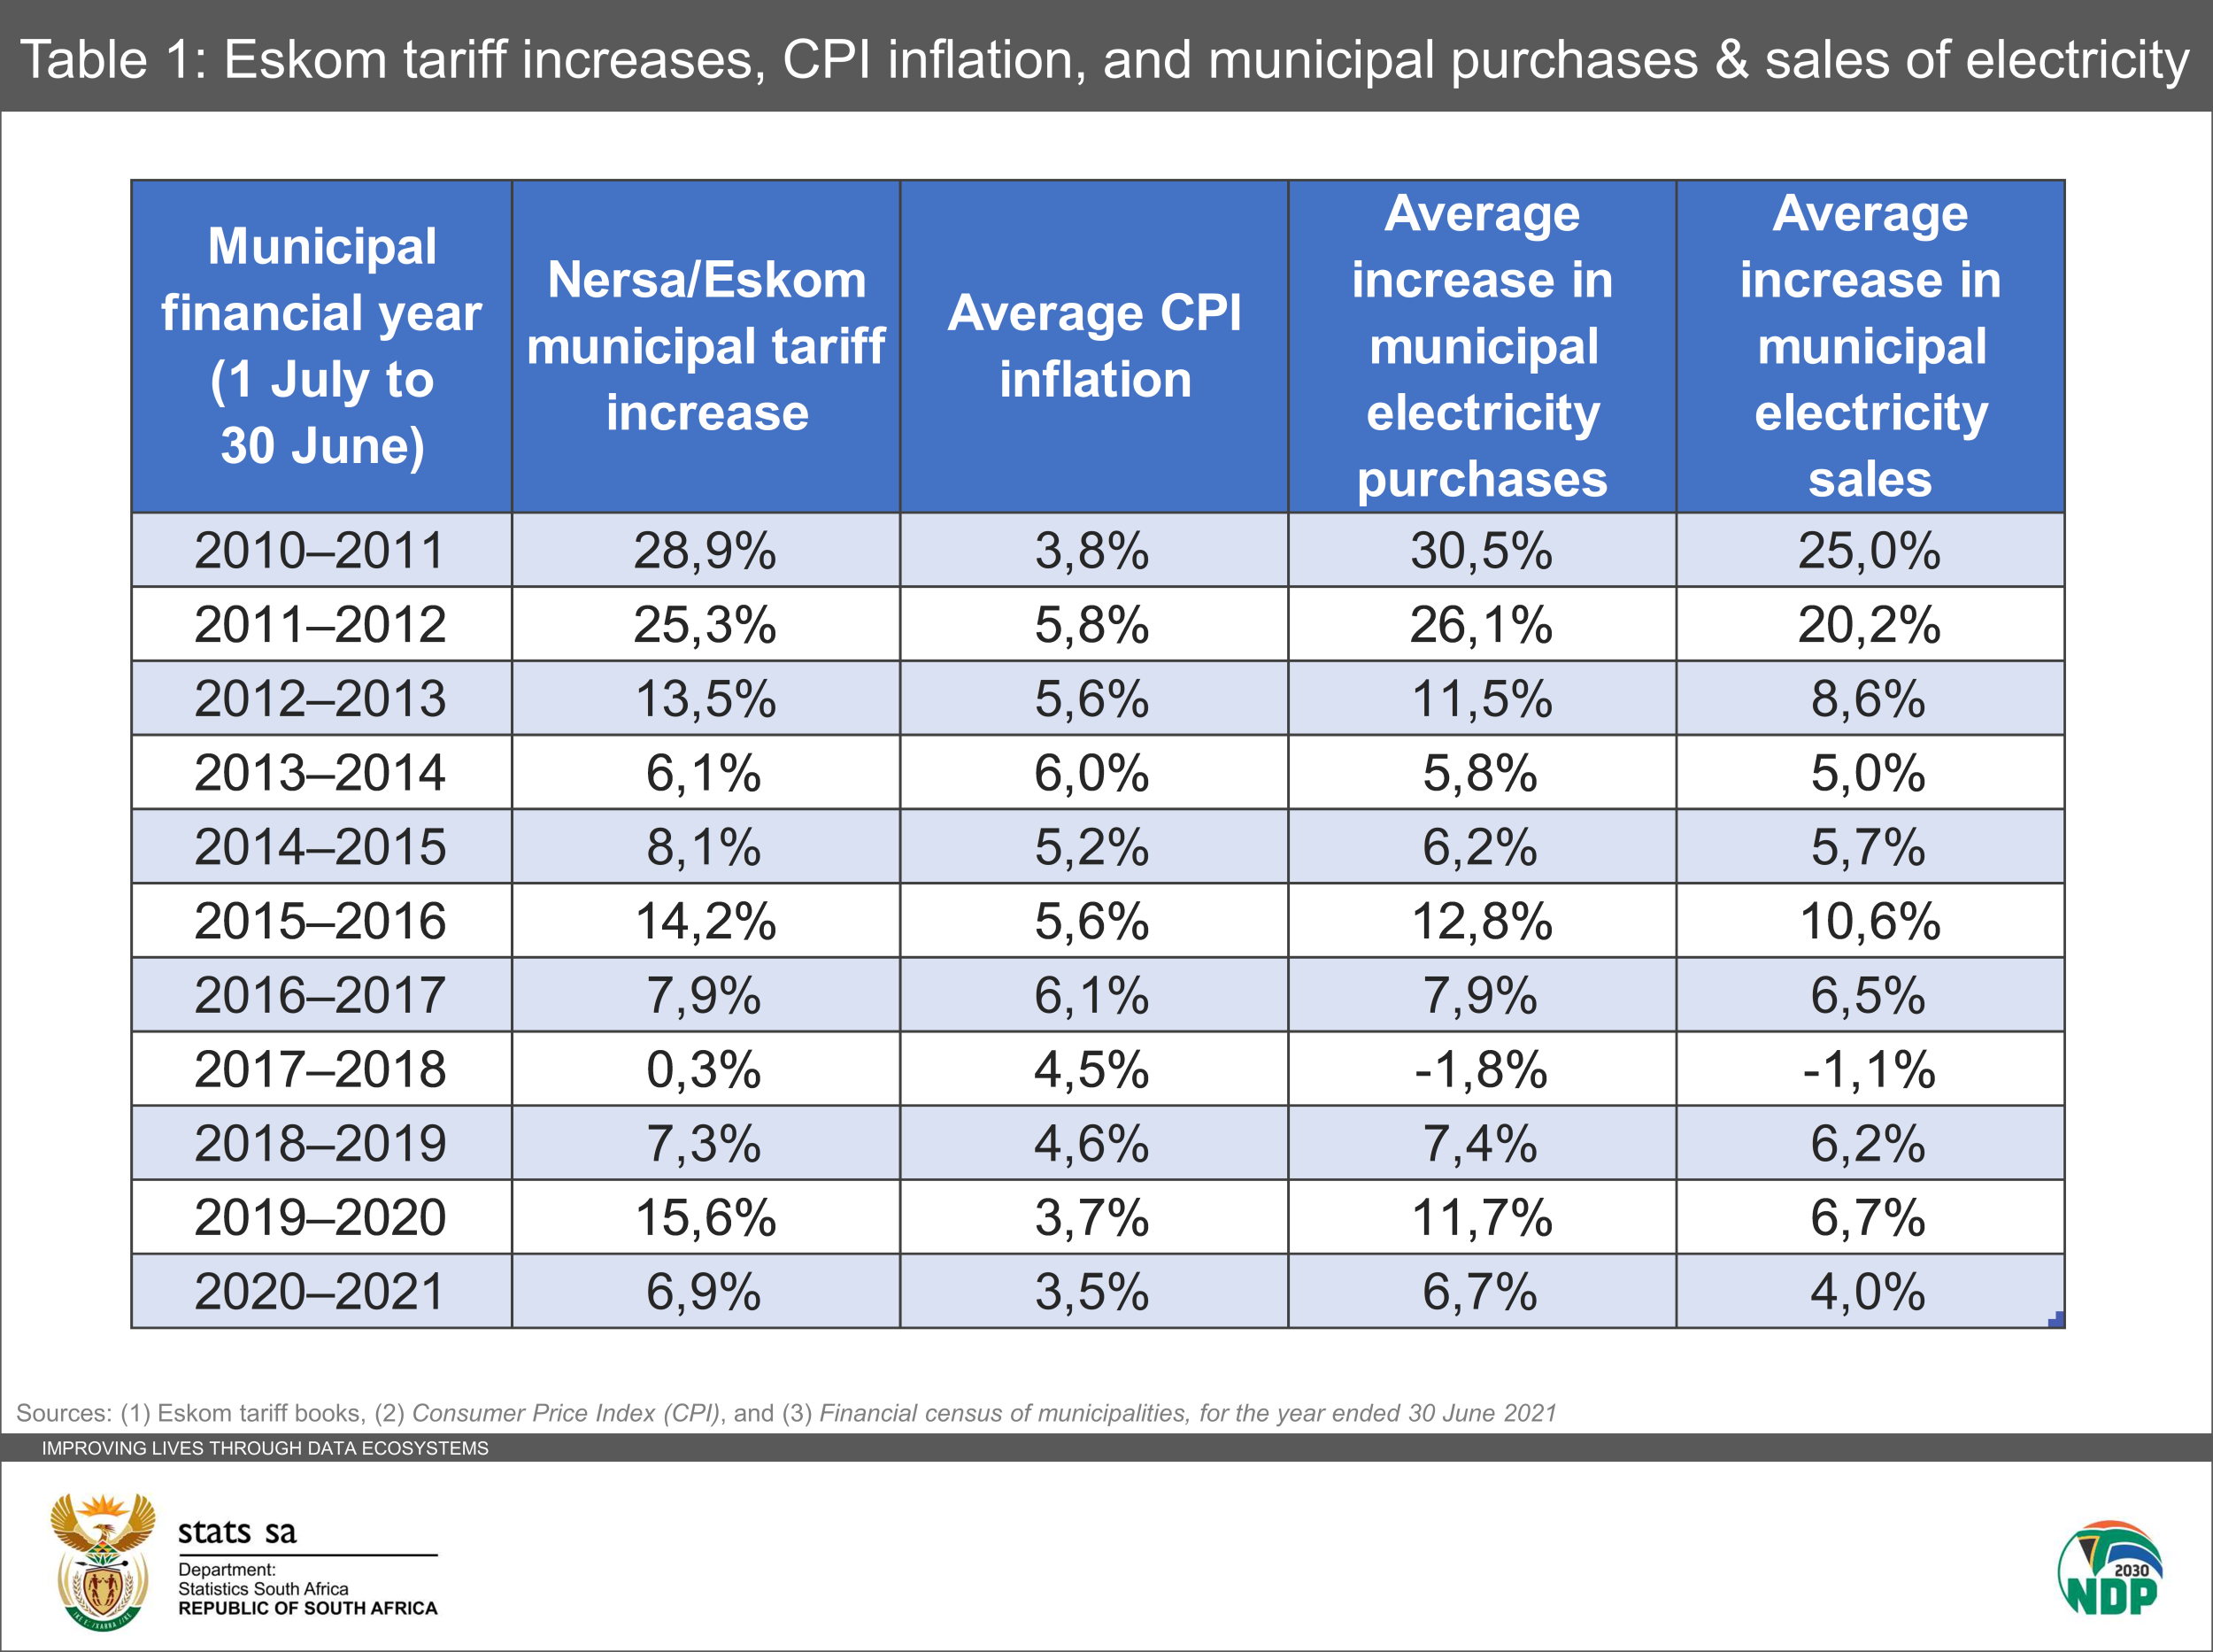
Municipalities are active traders in electricity, so it comes as no surprise that any rise in electricity tariffs will have an impact on municipal finances. The extent to which Eskom raises its tariffs is roughly mirrored by the rate at which municipalities increase spending on electricity.
The largest Eskom tariff increase in Table 1 was recorded in the 2010–2011 financial year (up 28,9%). Municipalities recorded an average increase of 30,5% in electricity purchases that year, according to Stats SA’s Financial census of municipalities statistical report. In 2017–2018, there was a decrease in electricity purchases. That year, Eskom’s rates increased by a nominal 0,3%.
Municipalities also tend to generate more revenue when there is an increase in Eskom’s tariffs, indicating that municipalities raise their own tariffs as well. This passes some of the costs to consumers, but it’s notable that the growth in electricity sales in Table 1 is lower than the growth in Eskom’s rates.
Even though Table 1 shows some link between Eskom tariffs and municipal purchases and sales of electricity, it should be noted that there is not a one-to-one relationship as the units of electricity purchased might carry over the years. Changes in purchases and sales of electricity are also influenced by a range of other factors, such as differences in the way billed and pre-paid customers are serviced.
What is also important to note is that municipalities can apply to the National Energy Regulator of South Africa (NERSA) for additional tariff increases on top of the approved national increase. Furthermore, growth rates for electricity sales differ from municipality to municipality, as each council has different tariff structures according to their own distinct goals and needs.
Each municipality is different
In the 2020–2021 financial year, South African municipalities spent R95,1 billion to purchase electricity from Eskom. Municipalities sold this power to their own customers, generating R118,1 billion in revenue. The gap between these two represents a surplus of R23 billion – much needed funding that is often used to finance other municipal activities.
Figure 1 shows electricity sales as a percentage of total revenue for each local and metropolitan municipality. For every rand of revenue generated by Langeberg Local Municipality in Western Cape, 57 cents was from electricity sales. KwaDukuza in KwaZulu-Natal is another municipality that was heavily dependent on sales of electricity, with 46% of its revenue generated from this source of cash.
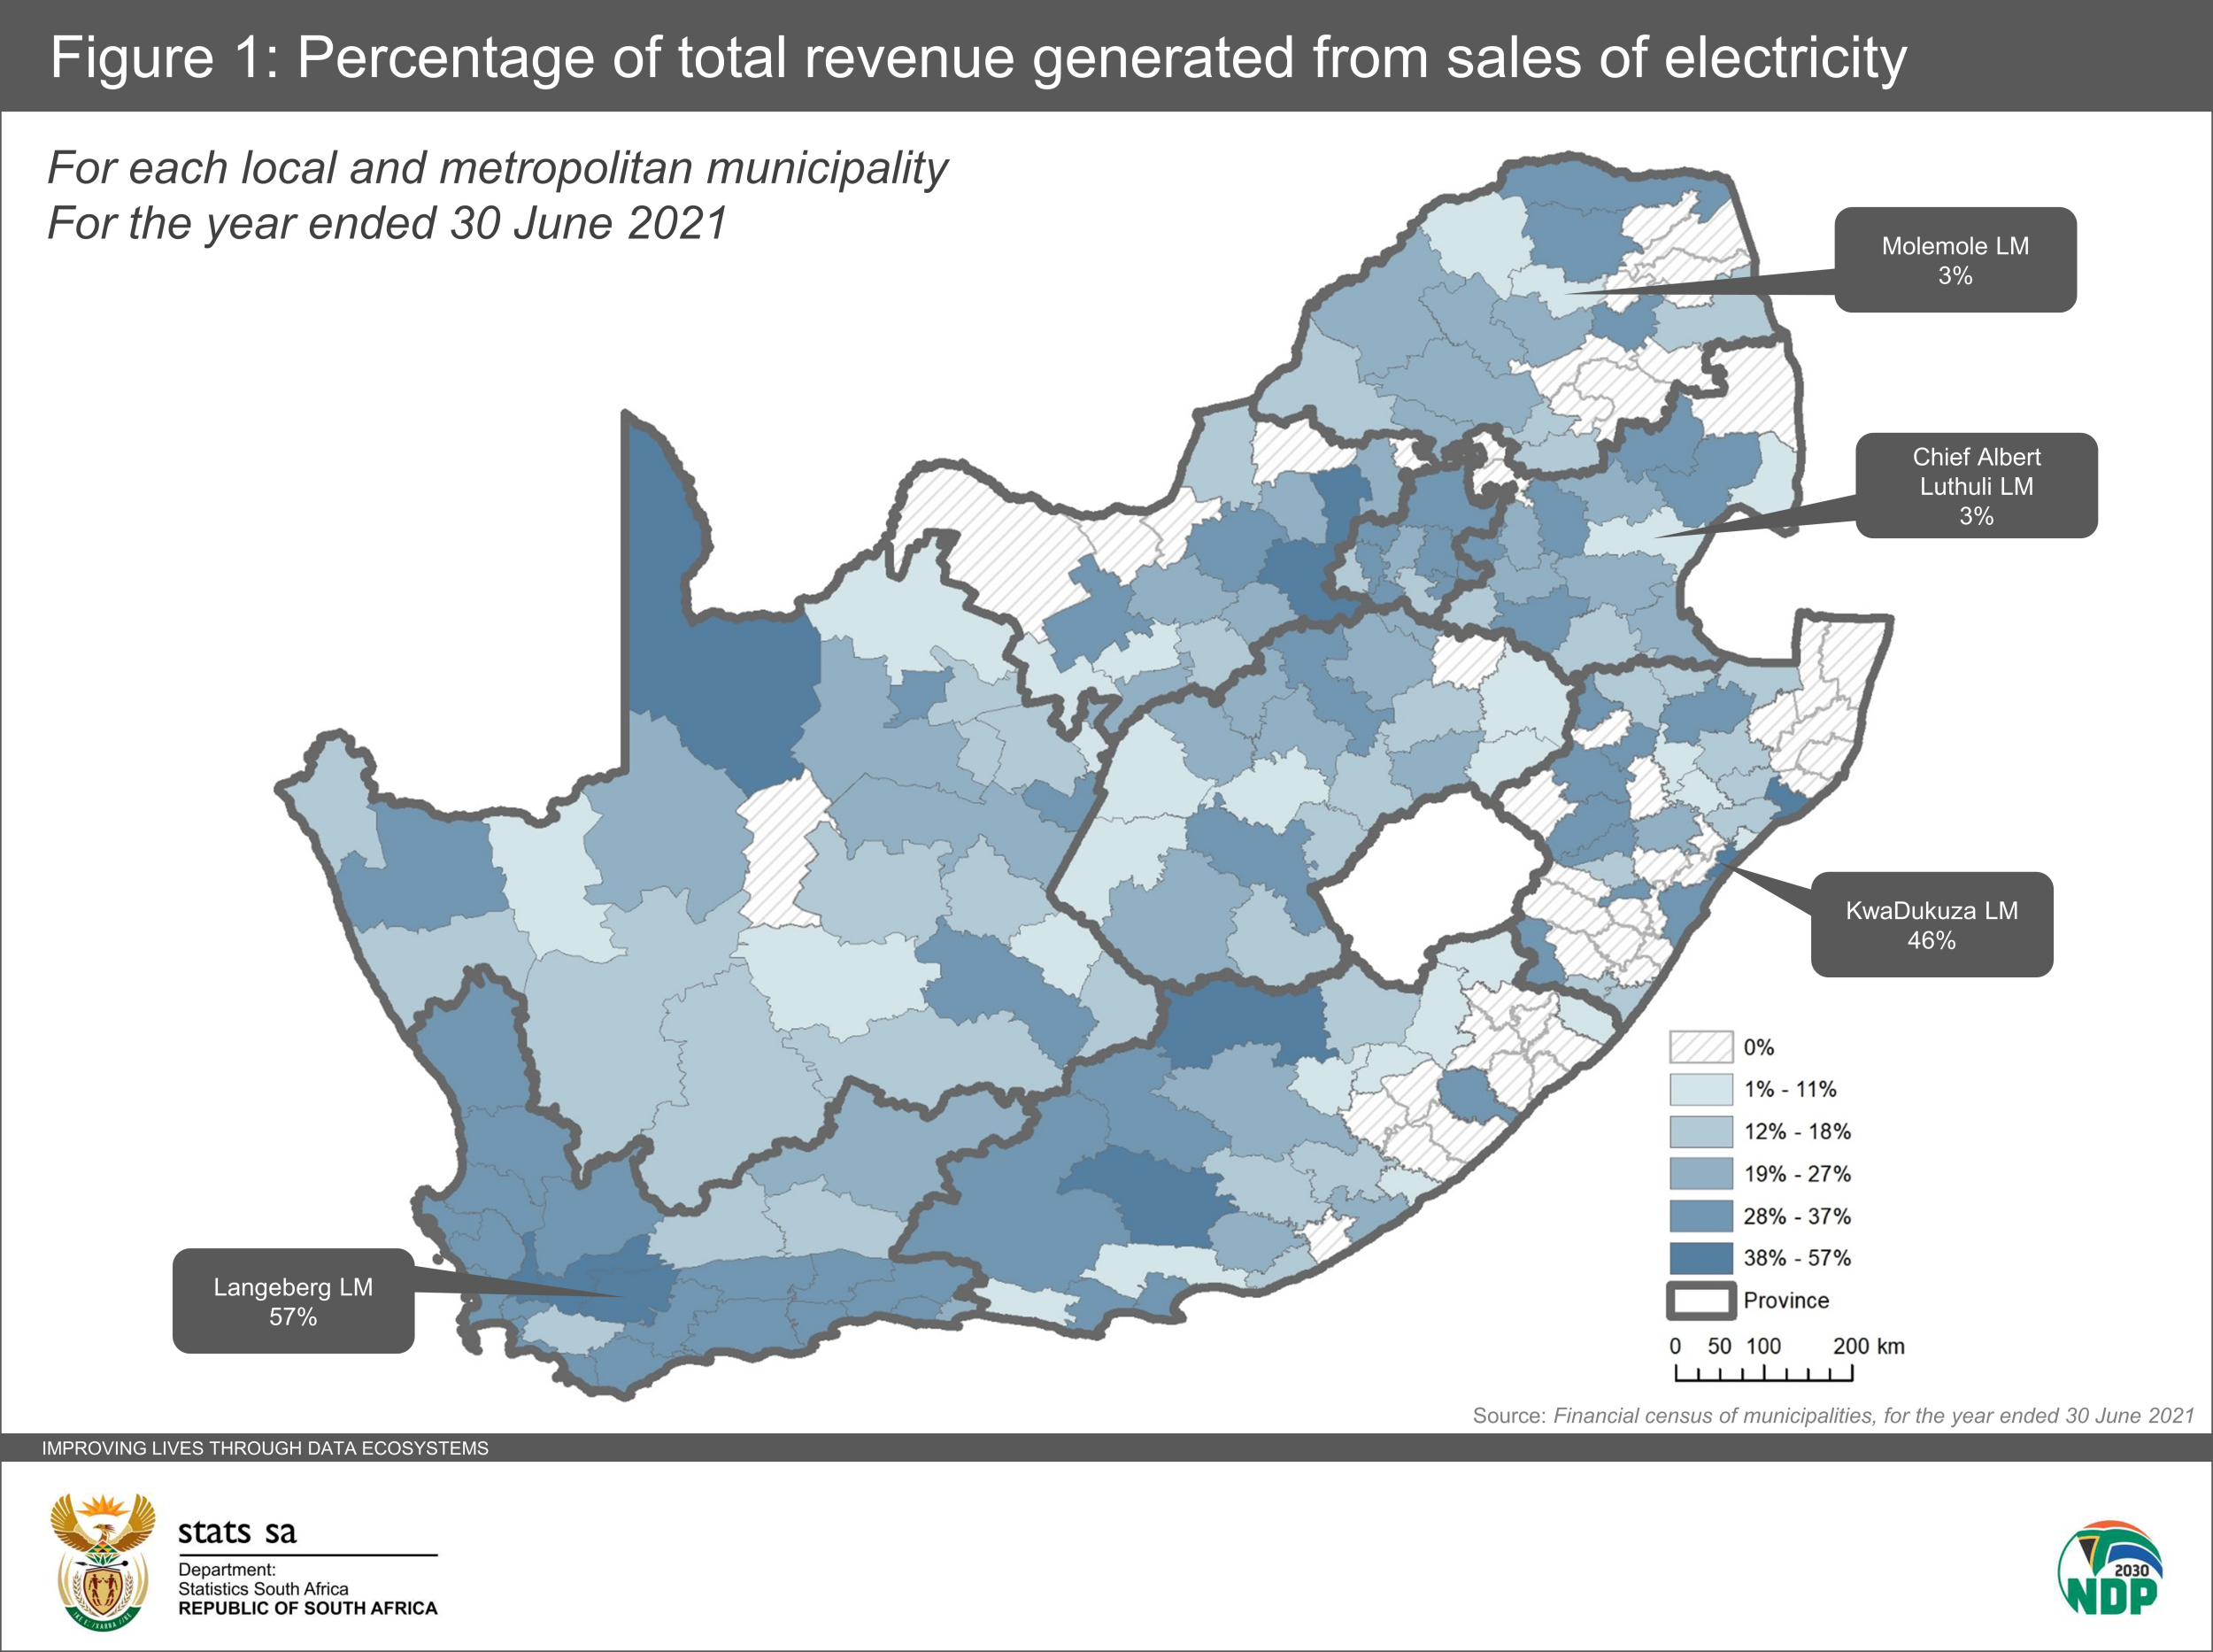
Chief Albert Luthuli Local Municipality (Mpumalanga) and Molemole Local Municipality (Limpopo) recorded relatively low percentages. In both municipalities, 3% of total revenue was generated from sales of electricity. These small contributions are not unexpected as the vast majority of households in those two municipalities source their electricity directly from Eskom – no municipal middleman required.
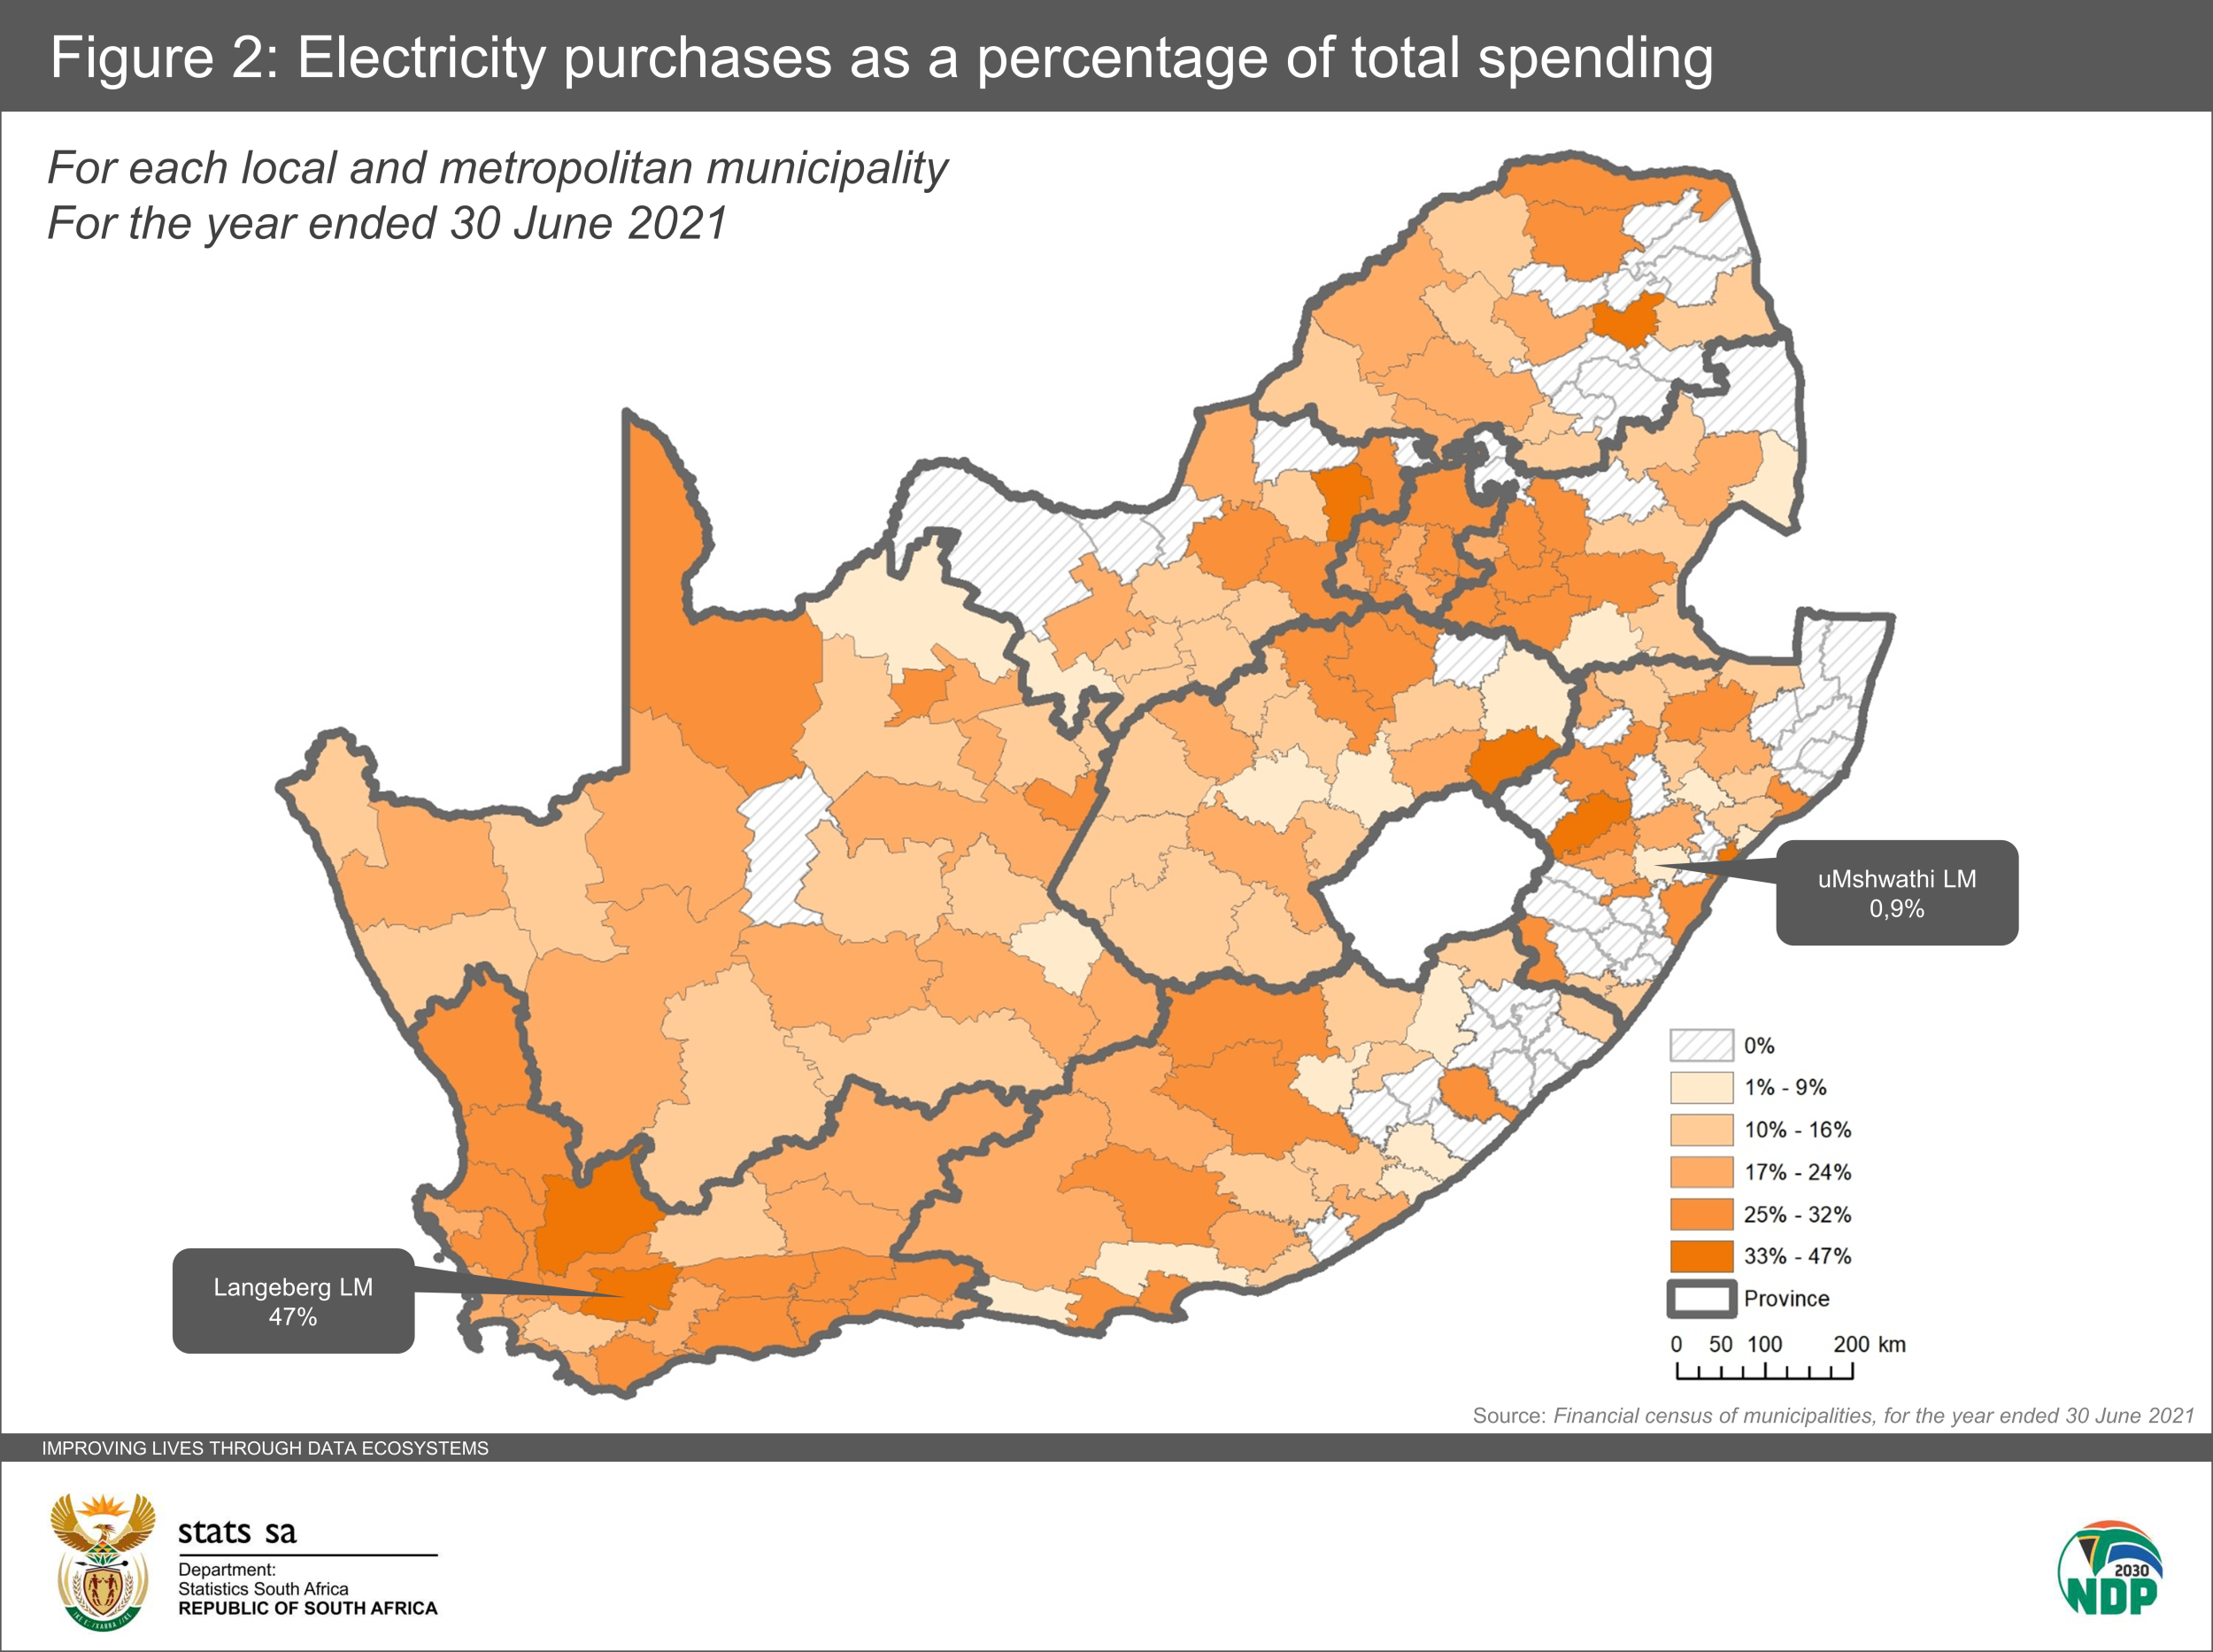
Figure 2 illustrates the expenditure side of the coin. Langeberg Local Municipality spent almost half of its budget on electricity purchases, while uMshwathi Local Municipality devoted a tiny contribution (0,9%).
There are only three district municipalities (not shown in the maps above) that sell electricity. These include uMkhanyakude in KwaZulu-Natal, as well as West Coast and Overberg in Western Cape. Due to the fact that these districts only service a few households in small towns, the contribution of electricity sales to their revenue streams is minimal (at 0,4%, 0,3% and 0,1% respectively). Most districts – particularly those that are not water services authorities (WSAs), water service providers (WSPs) or category C1 districts – are not involved in service delivery and instead act as overseers of local municipalities.
Other key results from the latest Financial census of municipalities report
The latest report, for the 2020–2021 financial year, provides a wealth of financial data on a range of other variables. Municipal purchases of water increased by 2,6% compared with 2019–2020, while sales of water was up by 10,1% over the same period. Whereas electricity purchases contributed 21,7% to total municipal expenditure in 2020–2021, water purchases contributed 6,2%. On the revenue front, water sales contributed 10,2% to total revenue, while electricity contributed 26,0%.
For more information, download the latest Financial census of municipalities report and unit data here.
1 MyBroadband, Eskom electricity prices – 1994 to 2020 [17 August 2022] (read here).
2 Tariff data for this article were sourced from Eskom’s annual tariff books (available here). The tariff increase for 2016–2017 is available here.
3 The latest consumer price index (CPI) statistical release and time series data in Excel are available here.
Similar articles are available on the Stats SA website and can be accessed here.
For a monthly overview of economic indicators and infographics, catch the latest edition of the Stats Biz newsletter here.