
Bucket toilets increase in 2020
After six years of steady decline, the number of consumer units serviced with a municipal bucket toilet jumped from 42 434 in 2019 to 47 130 in 2020. Increases were reported in seven of South Africa’s 257 municipalities.
This represents a rise of 4 696 consumer units, according to data from the latest Non-financial census of municipalities statistical report.1 The increase was mainly concentrated in Free State, with six municipalities in that province recording a rise in numbers. The municipalities of Matjhabeng and Ngwathe contributed the bulk of new consumer units2 that use a bucket toilet, adding almost 9 000 to the national tally.
Municipalities provide bucket toilets to communities as a temporary measure while more permanent forms of sanitation are in development. The intention is that it should only be temporary, but the system tends to remain in place longer than planned when service delivery delays occur.
Only one municipality outside Free State recorded an increase. Makana in Eastern Cape, which includes the town of Makhanda, saw 84 new consumer units using a bucket toilet in 2020.
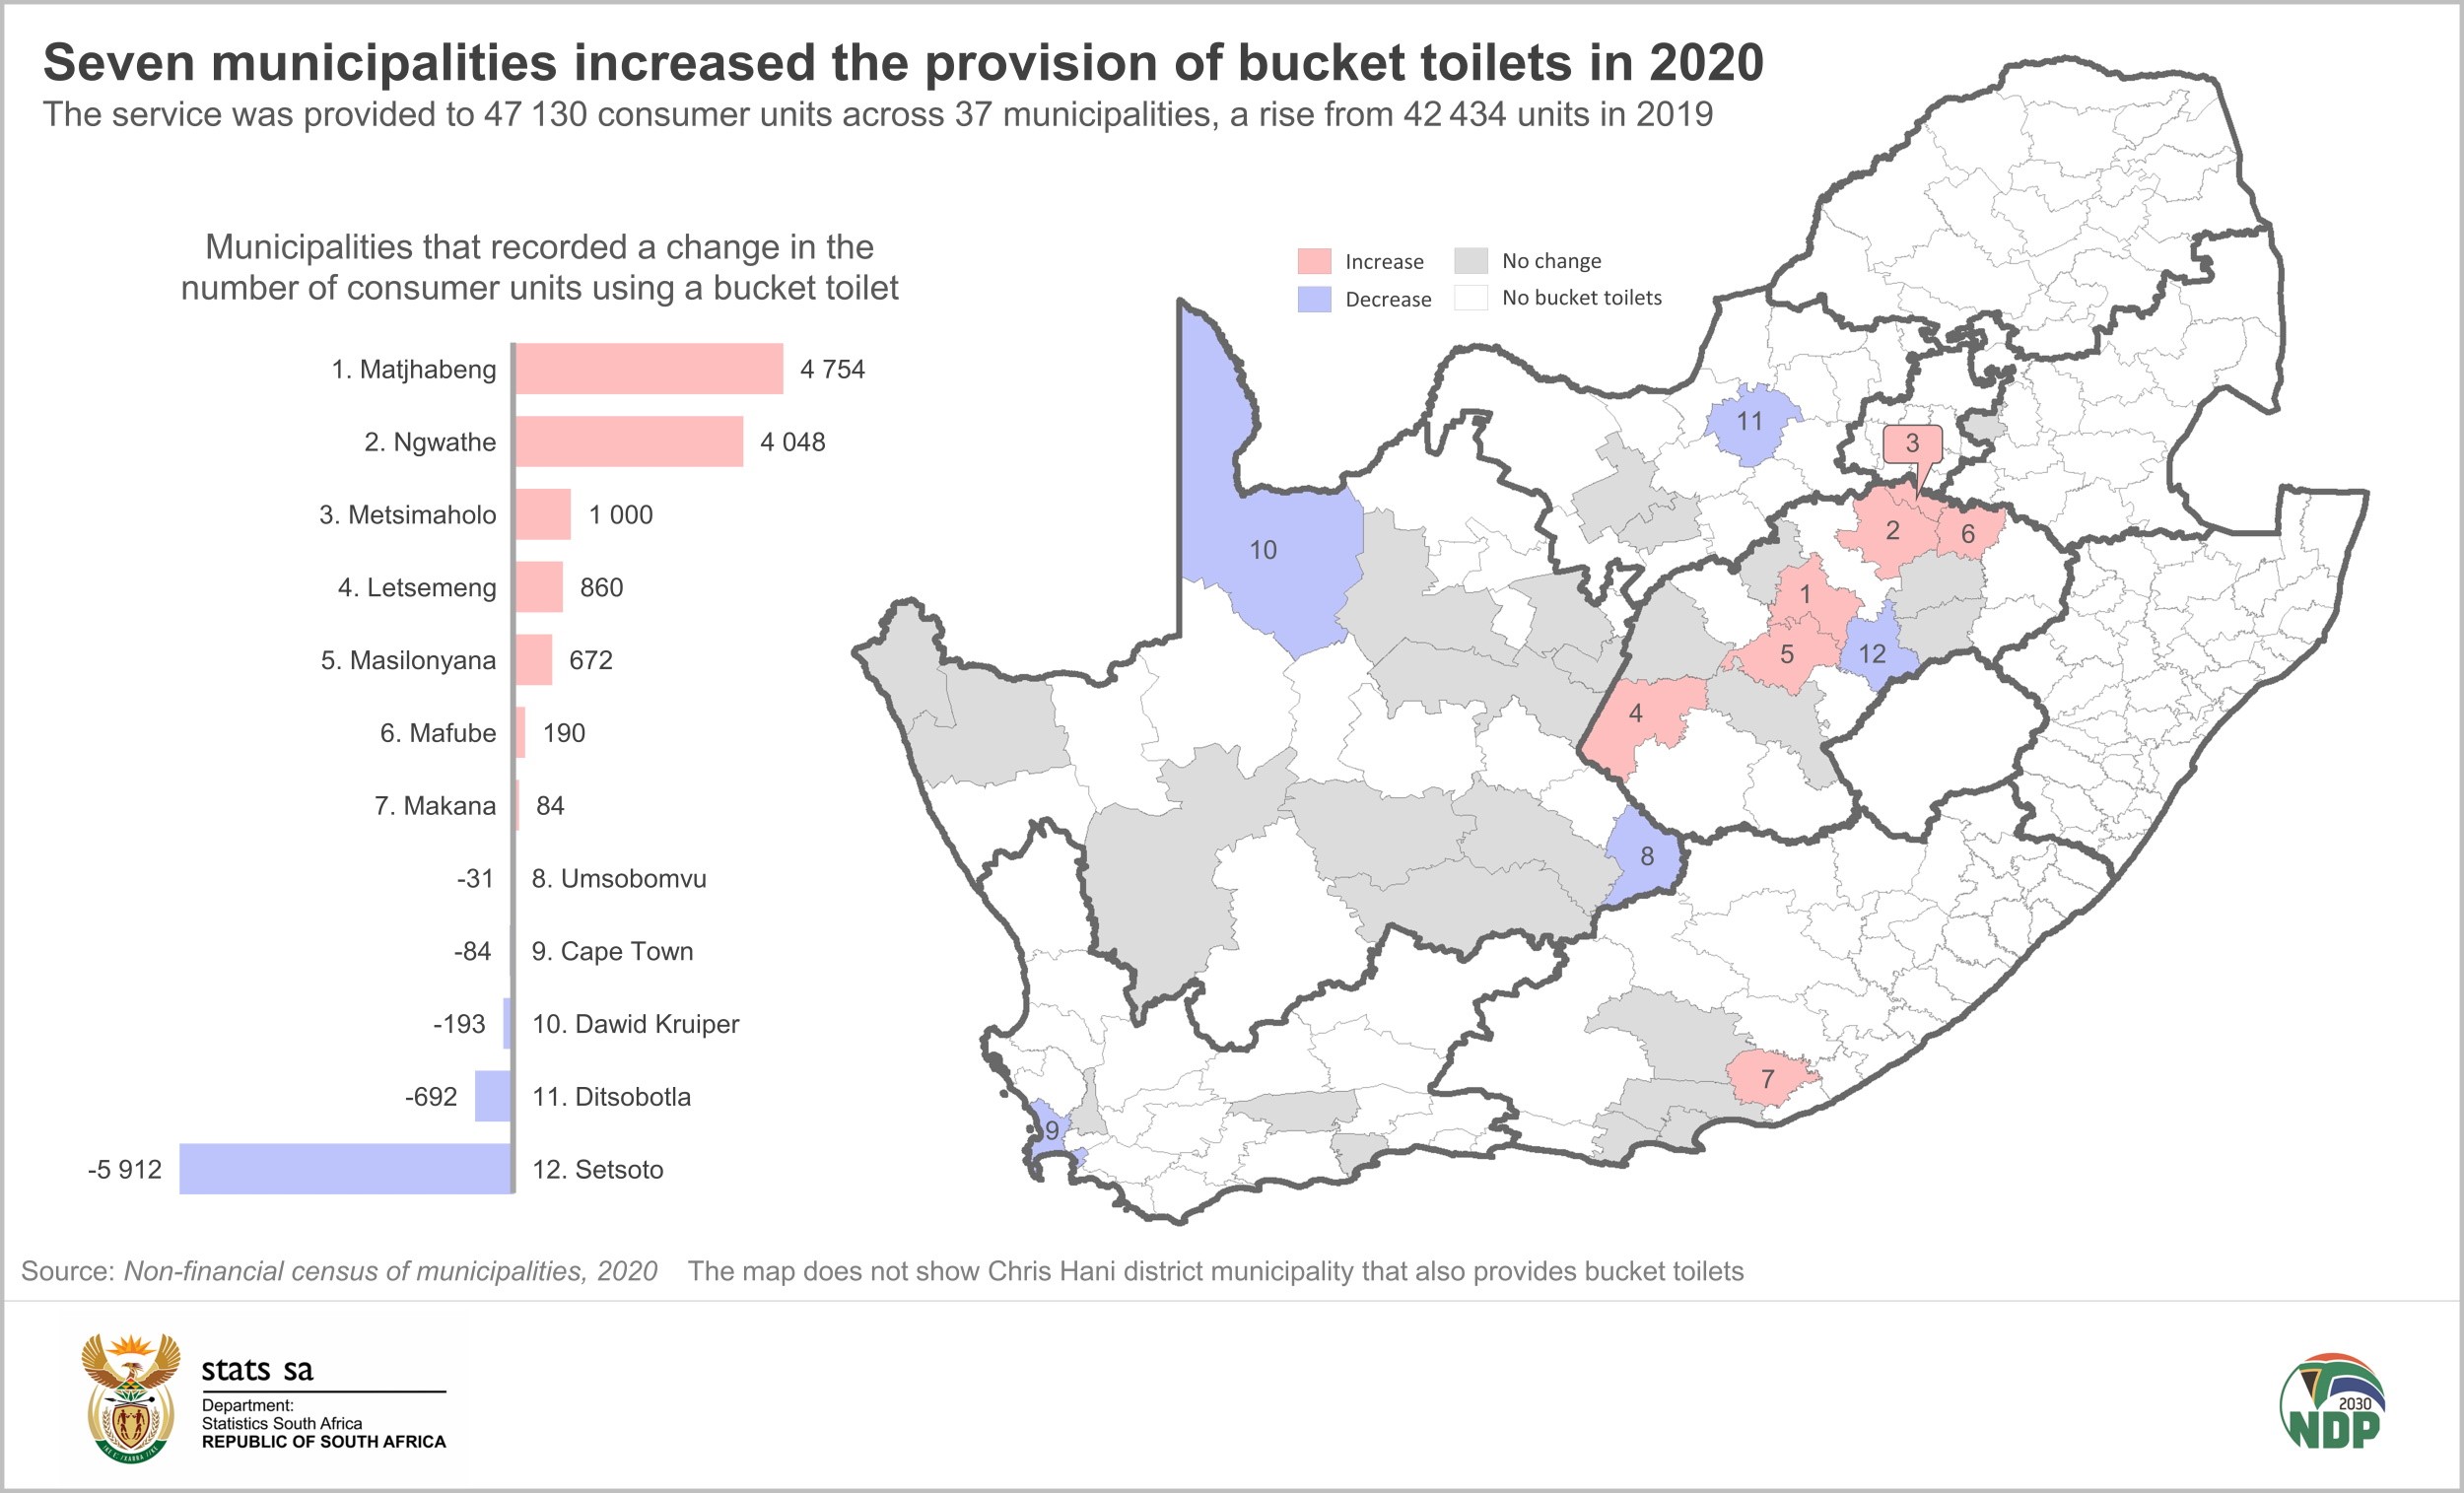
Municipal bucket toilets were in use in 37 municipalities in 2020.
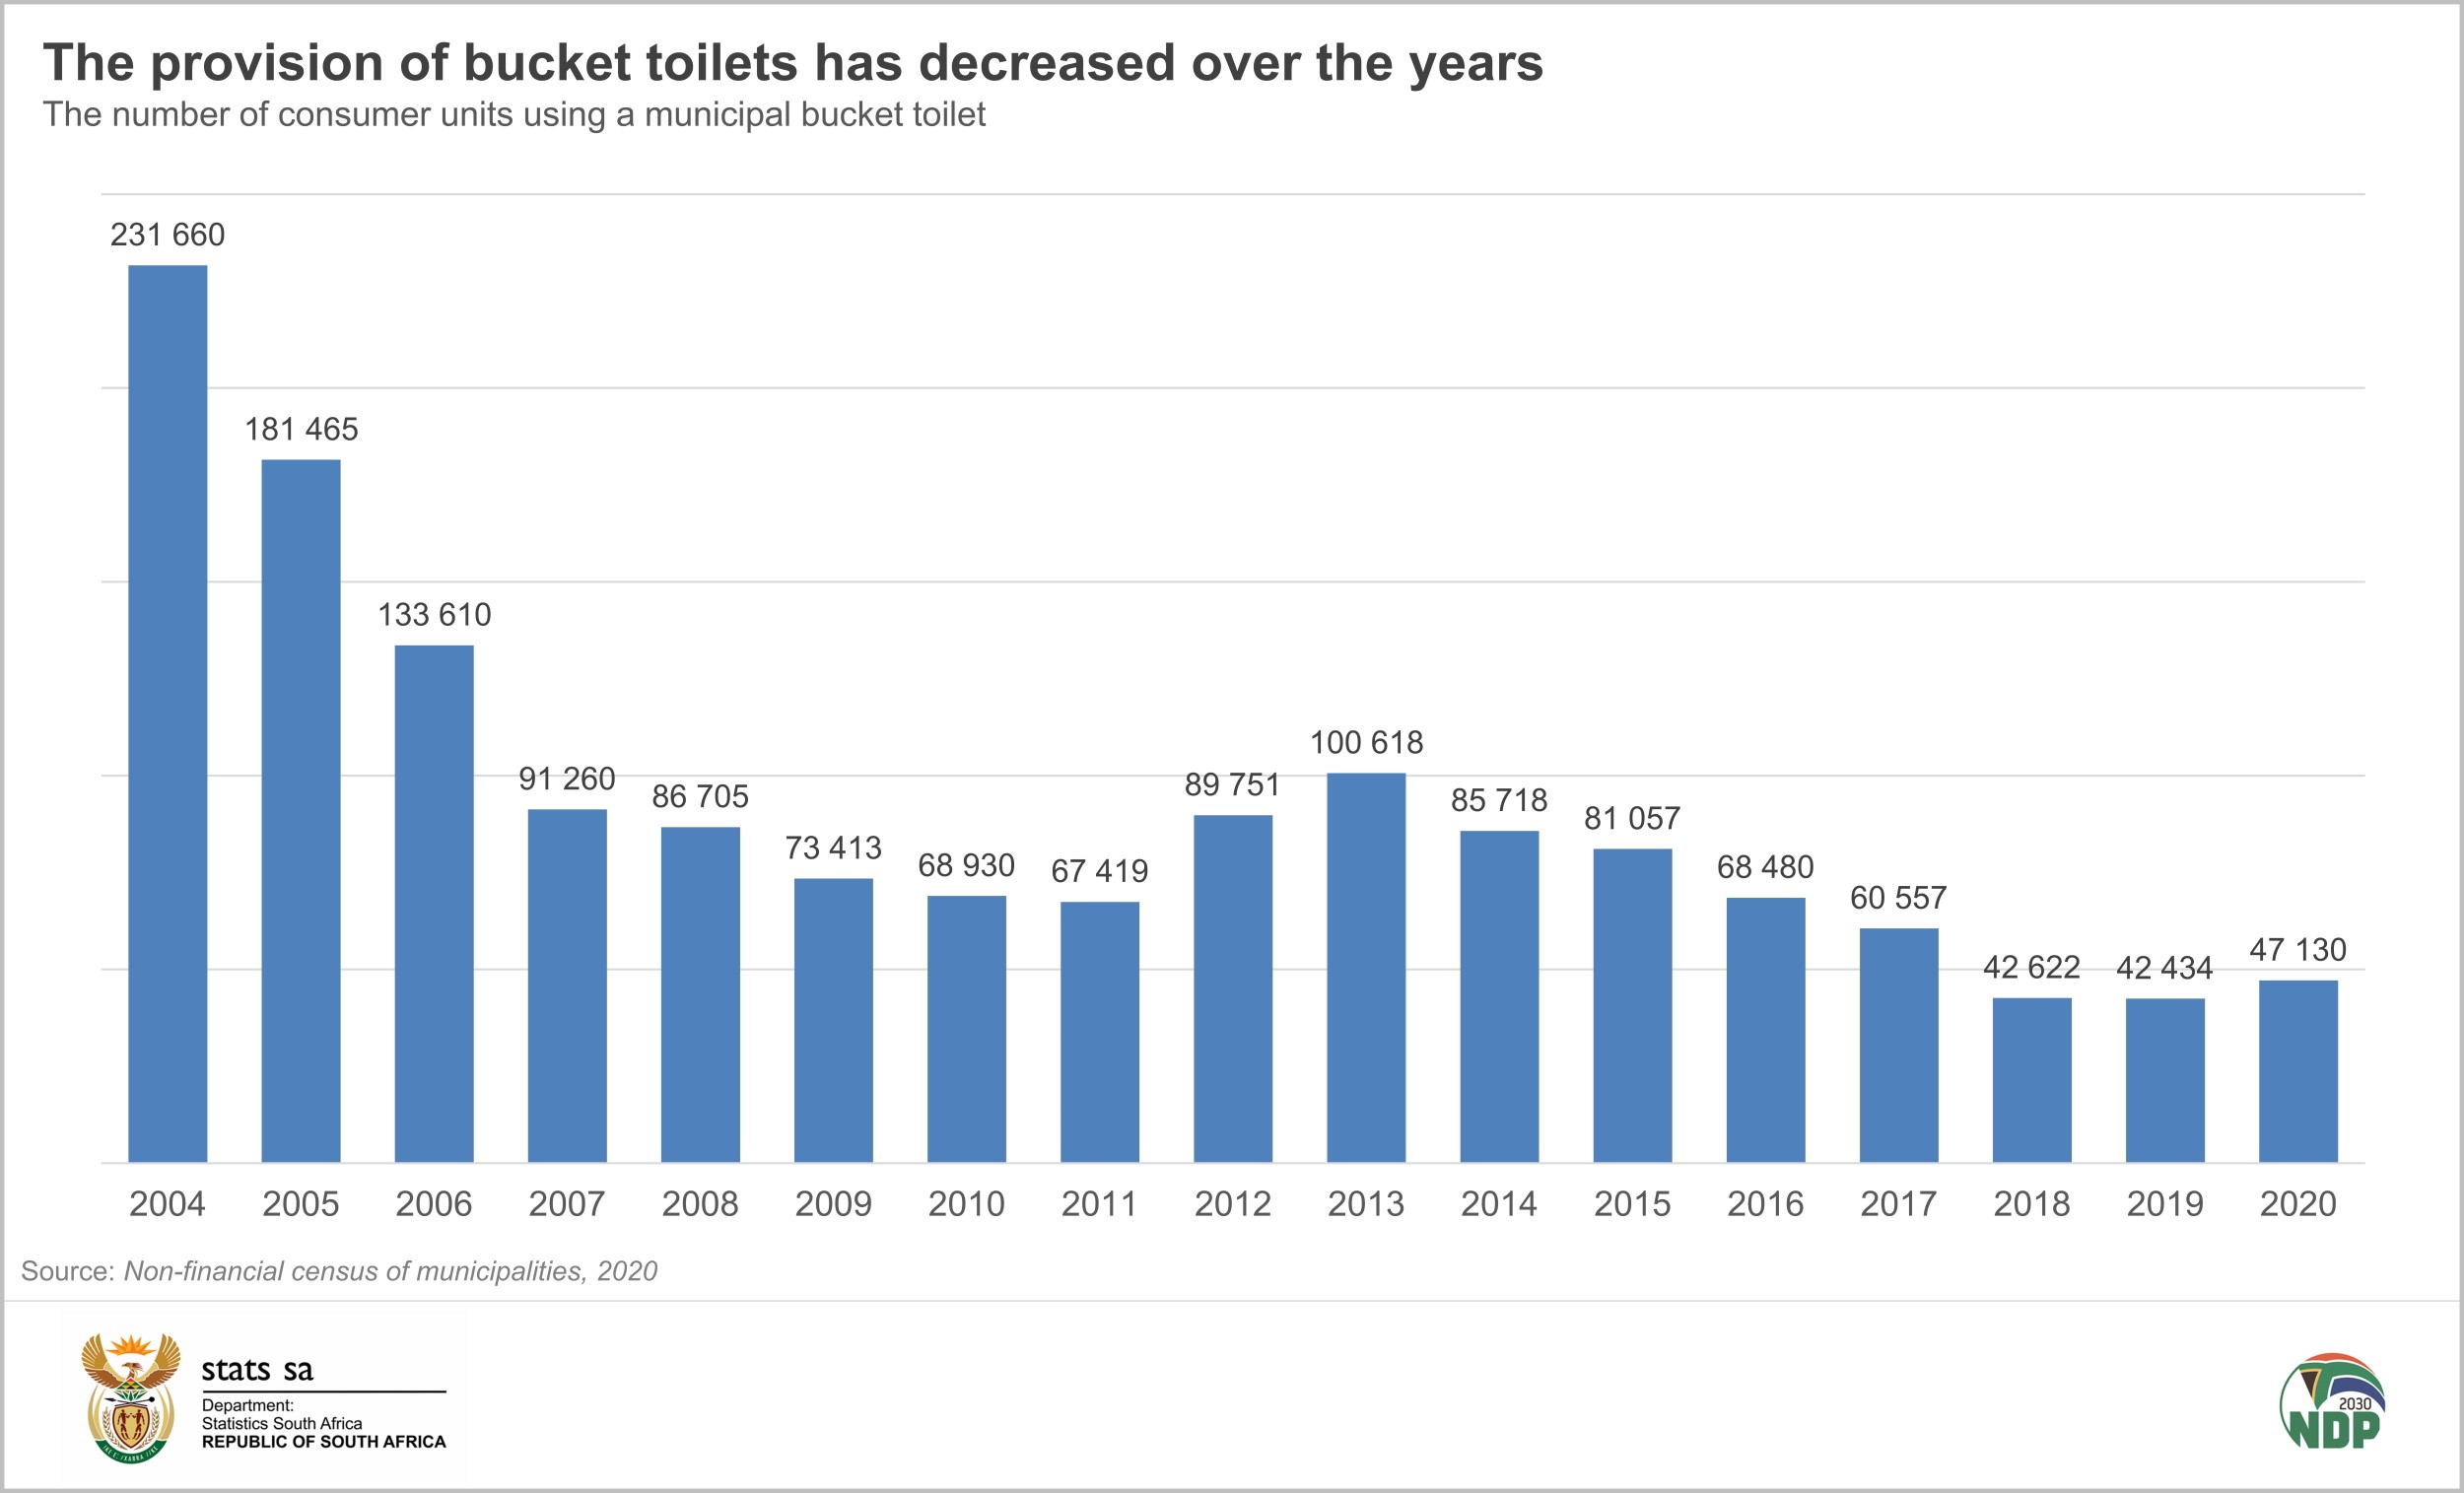
The data used to compile the Non-financial census of municipalities statistical report extends as far back as 2004, which provides a useful long-term view. The number of consumer units using a municipal bucket toilet declined from 231 660 in 2004 to 42 434 in 2019.
Despite the rise in 2020, a number of municipalities did reduce the use of bucket toilets within their jurisdictions. While seven municipalities increased the use of bucket toilets, five municipalities pulled back. Setsoto in Free State made the biggest dent in the national total. The municipality (which had the highest number of consumer units using a bucket toilet in 2019) reduced its tally from 7 006 to 1 094. The City of Cape Town eradicated municipal serviced bucket toilets entirely, reducing the number from 84 in 2019 to zero in 2020.
The survey also covers water, energy, and solid waste services, as well as municipal employment statistics. For more information, download the 2020 Non-financial census of municipalities report here.
1 The figures from the report cannot be compared with data on bucket toilets from Stats SA household surveys, such as the Population Census, Community Survey, and the General Household Survey. This is because the Non-financial census of municipalities survey measures the supply side of service delivery in South Africa, and reports on only those bucket toilets provided and collected by municipalities.
2 A consumer unit is an entity to which the service is (or would be) delivered, and which receives one bill if the service is billed, alternatively known as a delivery point. This concept is often referred to as a household by municipalities, but this is not strictly correct, as households and consumer units do not coincide one-to-one, particularly in blocks of flats, on stands where there are multiple households in the same dwelling, and in the case of public taps.
Similar articles are available on the Stats SA website and can be accessed here.
For a monthly overview of economic indicators and infographics, catch the latest edition of the Stats Biz newsletter here.