
Provision of basic services at local government level increases
The provision of basic services such as water went up by 6,4% between 2011 and 2012 nationally. The highest provincial increases were recorded in Western Cape (19,6%) and Gauteng (7,2%).
The extent of service delivery at local government level is normally obtained from households through population censuses and general household surveys. However, the suppliers (the municipalities) also furnish service delivery information to Statistics South Africa (Stats SA) in the form of an annual survey referred to as the Non-financial census of municipalities (NFCM). Some fascinating observations discernible from the NFCM for 2012 (the financial year ended 30 June 2012) are briefly noted below, covering the extent of the provision of basic services, as well as trends in the provision of free basic services, and employment.
Basic services
From 2008 to 2012, the number of consumer units receiving the four basic services (water, electricity, sewerage and sanitation) as well as solid waste management has gone up (see Figure 1).
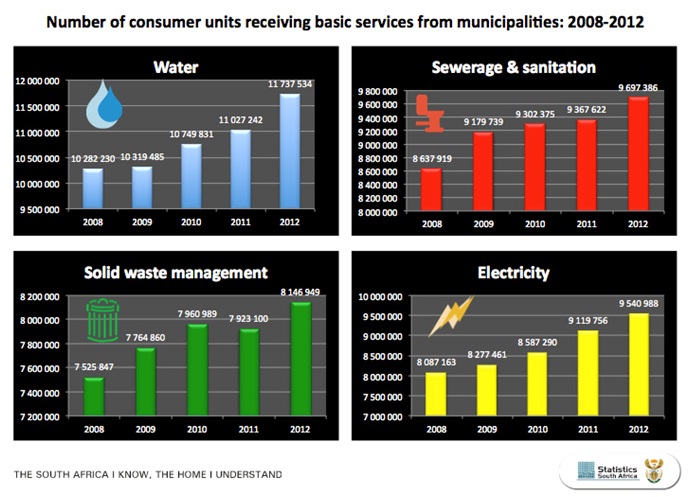
The provision of basic water increased nationally by 6,4% between 2011 and 2012, with the highest provincial increases being recorded by municipalities in the Western Cape(19,6%) and Gauteng (7,2%). Over the five-year period (2008 to 2012), Gauteng had the highest increase in consumer units (from 2,4 million in 2008 to 3,0 million in 2012). The single highest municipality increase over the 2008–2012 period was recorded bythe City of Tshwane (from 558 510 consumer units in 2008 to 940 997 consumer units in 2012); this being due to new developments in and around townships and suburbs of Tshwane.
The number of consumer units receiving electricity also went up throughout the country from 8,1 million to 9,5 million over the five-year period (2008 to 2012), with North West recording an increase of 36,9% during the five-year period. The increase in electricity provision by municipalities has enabled many communities to have this facility in their houses for the first time.
The number of consumer units receiving sewerage and sanitation increased nationally, from 8,6 million in 2008 to 9,7 million in 2012.The report shows that there has been a steady decline in the number of bucket toilets supplied by municipalities, from about 86 705 in 2008 to about 68 143 in 2012. Municipalities in Free State had the highest number of consumer units using bucket toilets (29 546 in 2012).
Solid waste management services to consumer units went up from 7,5 million in 2008 to 8,1 million in 2012, with municipalities in Gauteng recording the largest increase (from 2,4 million in 2008 to 2,6 million in 2012).
Free basic services
The indigent policy, whose aim is to alleviate poverty in disadvantaged communities by providing free basic water (at least 6 kilolitres per month), free basic electricity (at least 50 kWh per month), and subsidised sewerage and sanitation as well as solid waste management (up to R50 per month or 100% subsidy to indigent households), was useful in assessing progress in this regard.
The survey recorded 4,3 million consumer units receiving free basic water from municipalities during 2011/12 period, with municipalities in Western Cape and Eastern Cape reporting the largest proportions of households receiving free basic water (recording 66,8% and 44,5% respectively). However, over the five-year period (2008 to 2012), municipalities in Mpumalanga reported the highest increase in consumer units receiving free basic water (from 342 915 in 2008 to 424 285 in 2012). Nationally, the municipality reflecting the largest increase in consumer units receiving free basic water over the five-year period (2008 to 2012) was Polokwane (from 69 750 consumer units in 2008 to 115 082 consumer units in 2012).
With regards to electricity, there were 2,4 million consumer units receiving free basic electricity from municipalities during the 2011/12 period, with municipalities in Western Cape and Mpumalanga reporting the largest proportions of households receiving free basic electricity (43,6% and 39,5% respectively). Whereas, over the five-year period (2008 to 2012), municipalities in Mpumalanga had the highest increase in consumer units receiving free basic electricity (from 220 106 reported in 2008 to 279 044 in 2012). The municipality that reported the largest increase in consumer units receiving free basic electricity during 2012 was Thembisile Hani Local Municipality (from 0 in 2011 to 69 822 in 2012).This service was provided for the first time during the 12 months ended 30 June 2012.
A closer look at the municipal provision of sewerage and sanitation services shows that there were 2,5 million consumer units receiving free basic sewerage and sanitation from municipalities in 2012 (from 2,7 million in 2011), with the highest increases recorded in Western Cape (67,7%) and Eastern Cape (43,1%). Over the five-year period (2008 to2012), municipalities in the Limpopo reported the largest increase in consumer units receiving free basic sewerage and sanitation (from 155 780 reported in 2008 to 270 108 in 2012).Nationally, Govan Mbeki Local Municipality reported the largest increase in consumer units receiving free basic sewerage and sanitation over the five-year period (2008 to 2012), from 17 041 in 2008 to 69 908 in 2012.
The provision of free basic solid waste management services to consumer units went up by 31,1% in the 2011/2012 period nationally, with the highest provincial increases recorded in KwaZulu-Natal (55,2%) and Western Cape (47,8%). Over the five-year period (2008 to 2012), municipalities in KwaZulu-Natal had the largest increase in consumer units receiving free basic solid waste management (from about 94 040 in 2008 to 803 061 in 2012). Nationally, the municipality that reported the largest increase in consumer units receiving free basic solid waste management over the five-year period (2008 to 2012) was Polokwane (from 30 700 to 91 338 consumer units).This increase was due to the awareness campaigns that were run in villages, leading to more residents reporting and registering for free basic services at the municipality.
Employment
The number of people employed by municipalities increased from 277 024 in 2011 to 284990 in 2012. There were 19156 people occupying posts at management level (including mayoral and councillors positions) in all South African municipalities (excluding vacancies), with 12 632 of these posts filled by men while women occupied the remaining 6 524 posts. There was a slight drop in the number of funded vacant posts (from 35 831 in 2011 to 35 672 in 2012). The highest number of unfilled posts in the technical areas was in the electricity departments (19%), while both the roads transport and waste management departments reported vacancy rates of 17%.
The above summary highlights just a few areas where increases in the provision of basic services and employment were experienced in municipalities.
More detail on each municipality is obtainable on the Stats SA website: www.statssa.gov.za.
Author:
Jacob Shai
JacobS@Statssa.gov.za