
The impact of COVID-19 on national government finances in the 2020/2021 financial year
Total revenue collection of national government decreased by R95 billion from R1 385 billion in 2019/2020 to R1 290 billion in 2020/2021.
The revenue streams in national government are taxes collected, grants and ‘other’ receipts (this comprises sales of goods and services and interest). Taxes collected contributed about 97% of total revenue.
The decrease of R106 billion in cash receipts of taxes from R1 356 billion in 2019/2020 to R1 250 billion in 2020/2021 was mainly due to decreases in taxes from individuals’ income, taxes on goods and services (i.e. value added tax, excise taxes), and taxes collected from corporations and other enterprises.
Figure 1 – Types of tax collected for 2019/2020 and 2020/2021
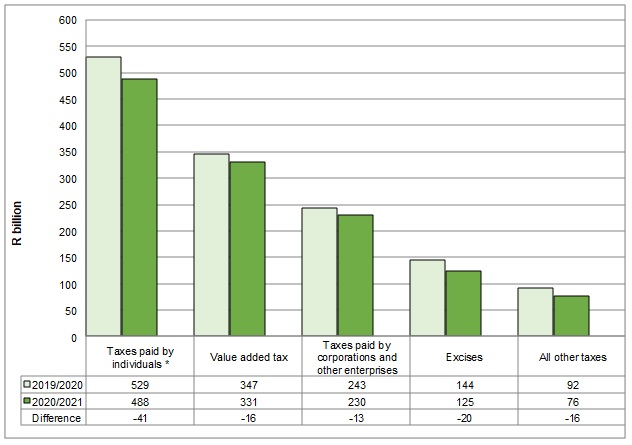
* Taxes paid by individuals on income, profits, and capital gains.
Source: Financial statistics of national government, 2020/2021
Taxes paid by individuals decreased by R41 billion, adversely affected by job losses during the COVID-19 pandemic as well as lower earnings for many who were employed.
The contractions of R16 billion in value added tax and R13 billion in taxes paid by corporations and other enterprises were partly due to lower levels of economic activity during the COVID-19 pandemic.
The R20 billion loss of excise taxes (for example taxes on tobacco, alcohol, etc.) was due to factors such as the closing of bars and restaurants and bans on alcohol and tobacco – once again the impact of COVID-19 is evident.
Moving on to spending, note that a significant amount (R1,01 trillion or 55%) of the total expenses (R1,84 trillion) includes grant payments to other levels of general government for the purpose of covering their expenditures.
Table 1 – Breakdown of national government spending 2019/2020 – 2020/2021 (R billion)
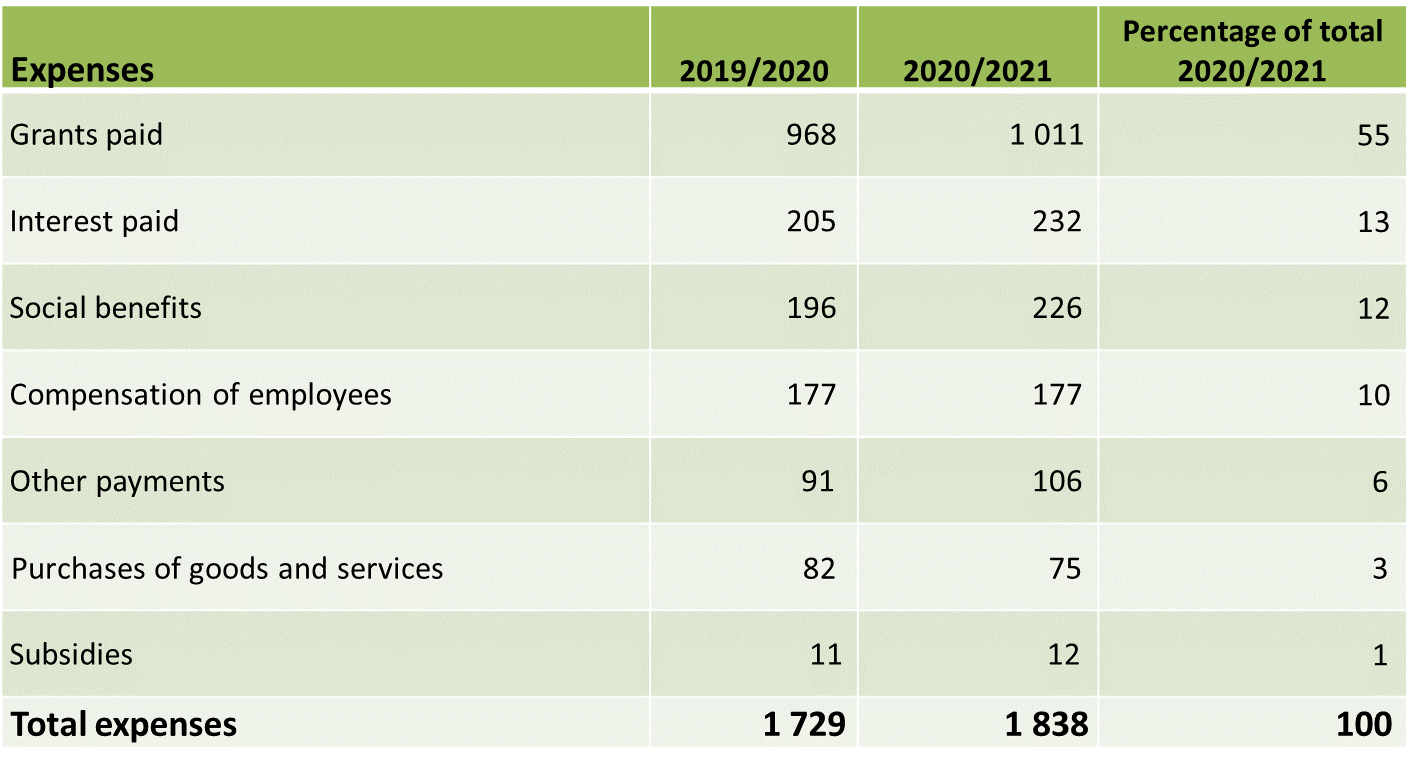
Source: Financial statistics of national government, 2020/2021
The second biggest expense item on national government’s financial statement, after grants, was interest paid on public debt, representing 13% of total expenses.
Social benefits accounted for 12% of national government expenses. The Department of Social Development dominated spending in this area. There was a 15% increase compared with 2019/2020, associated with a rise in payments of social grants to households (mainly children’s grants and social relief of distress grants) due to the COVID-19 pandemic.
There was an increase of 16% in ‘other’ payments from R91 billion in 2019/2020 to R106 billion in 2020/2021, mainly due to capital transfers paid to non-financial public corporations by the Department of Public Enterprises.
Goods and services decreased by 9% in almost all national government departments mainly because of lower costs of travelling and subsistence, training and development, and venues and facilities – mostly related to COVID-19 restrictions.
Figure 2 – Grants to the general government and international institutions
2019/2020 – 2020/2021 (R billion)
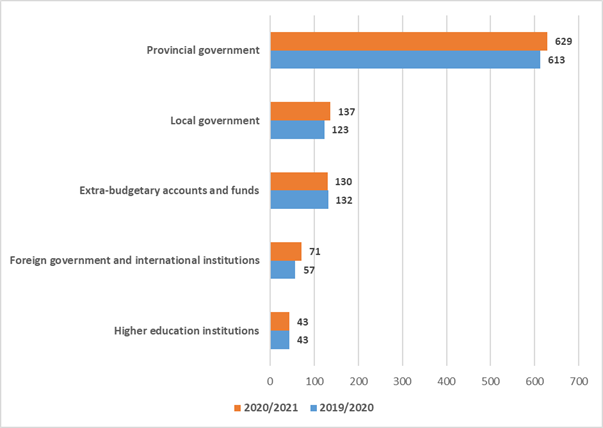
Source: Financial statistics of national government, 2020/2021
The provinces received nearly two-thirds of the R1,01 trillion in grants from national government. These funds are used to provide social services to citizens, e.g. health and education services.
The nation’s 257 municipalities accounted for 14% of grants, making up the second largest beneficiary group. These were followed by 255 extra-budgetary accounts and funds (13%) and foreign governments and international institutions (7%).
Note that the data reflected in this report cover national government departments only. Stats SA also publishes financial reports for the general government i.e. provincial, local, extra-budgetary accounts and higher education institutions during the year.
These reports are followed by a consolidated document in November that provides a complete overview of net government finances.1
For more information on national government finances, download the latest Financial statistics of national government release here.
1 To find out more on the financial situation of the South African government as a whole, you can access the latest summary here.
Source: Tax Statistics, 2021
Similar articles are available on the Stats SA website and can be accessed here.
For a monthly overview of economic indicators and infographics, catch the latest edition of the Stats Biz newsletter here.