
Foot-and-mouth: Where do the livestock live?
Foot-and-mouth disease is scary. The recent outbreak, identified in at least five provinces, has serious implications for the livestock industry. Stats SA takes a look at the revenue streams that might be affected, and identifies where vulnerable industries might be located.
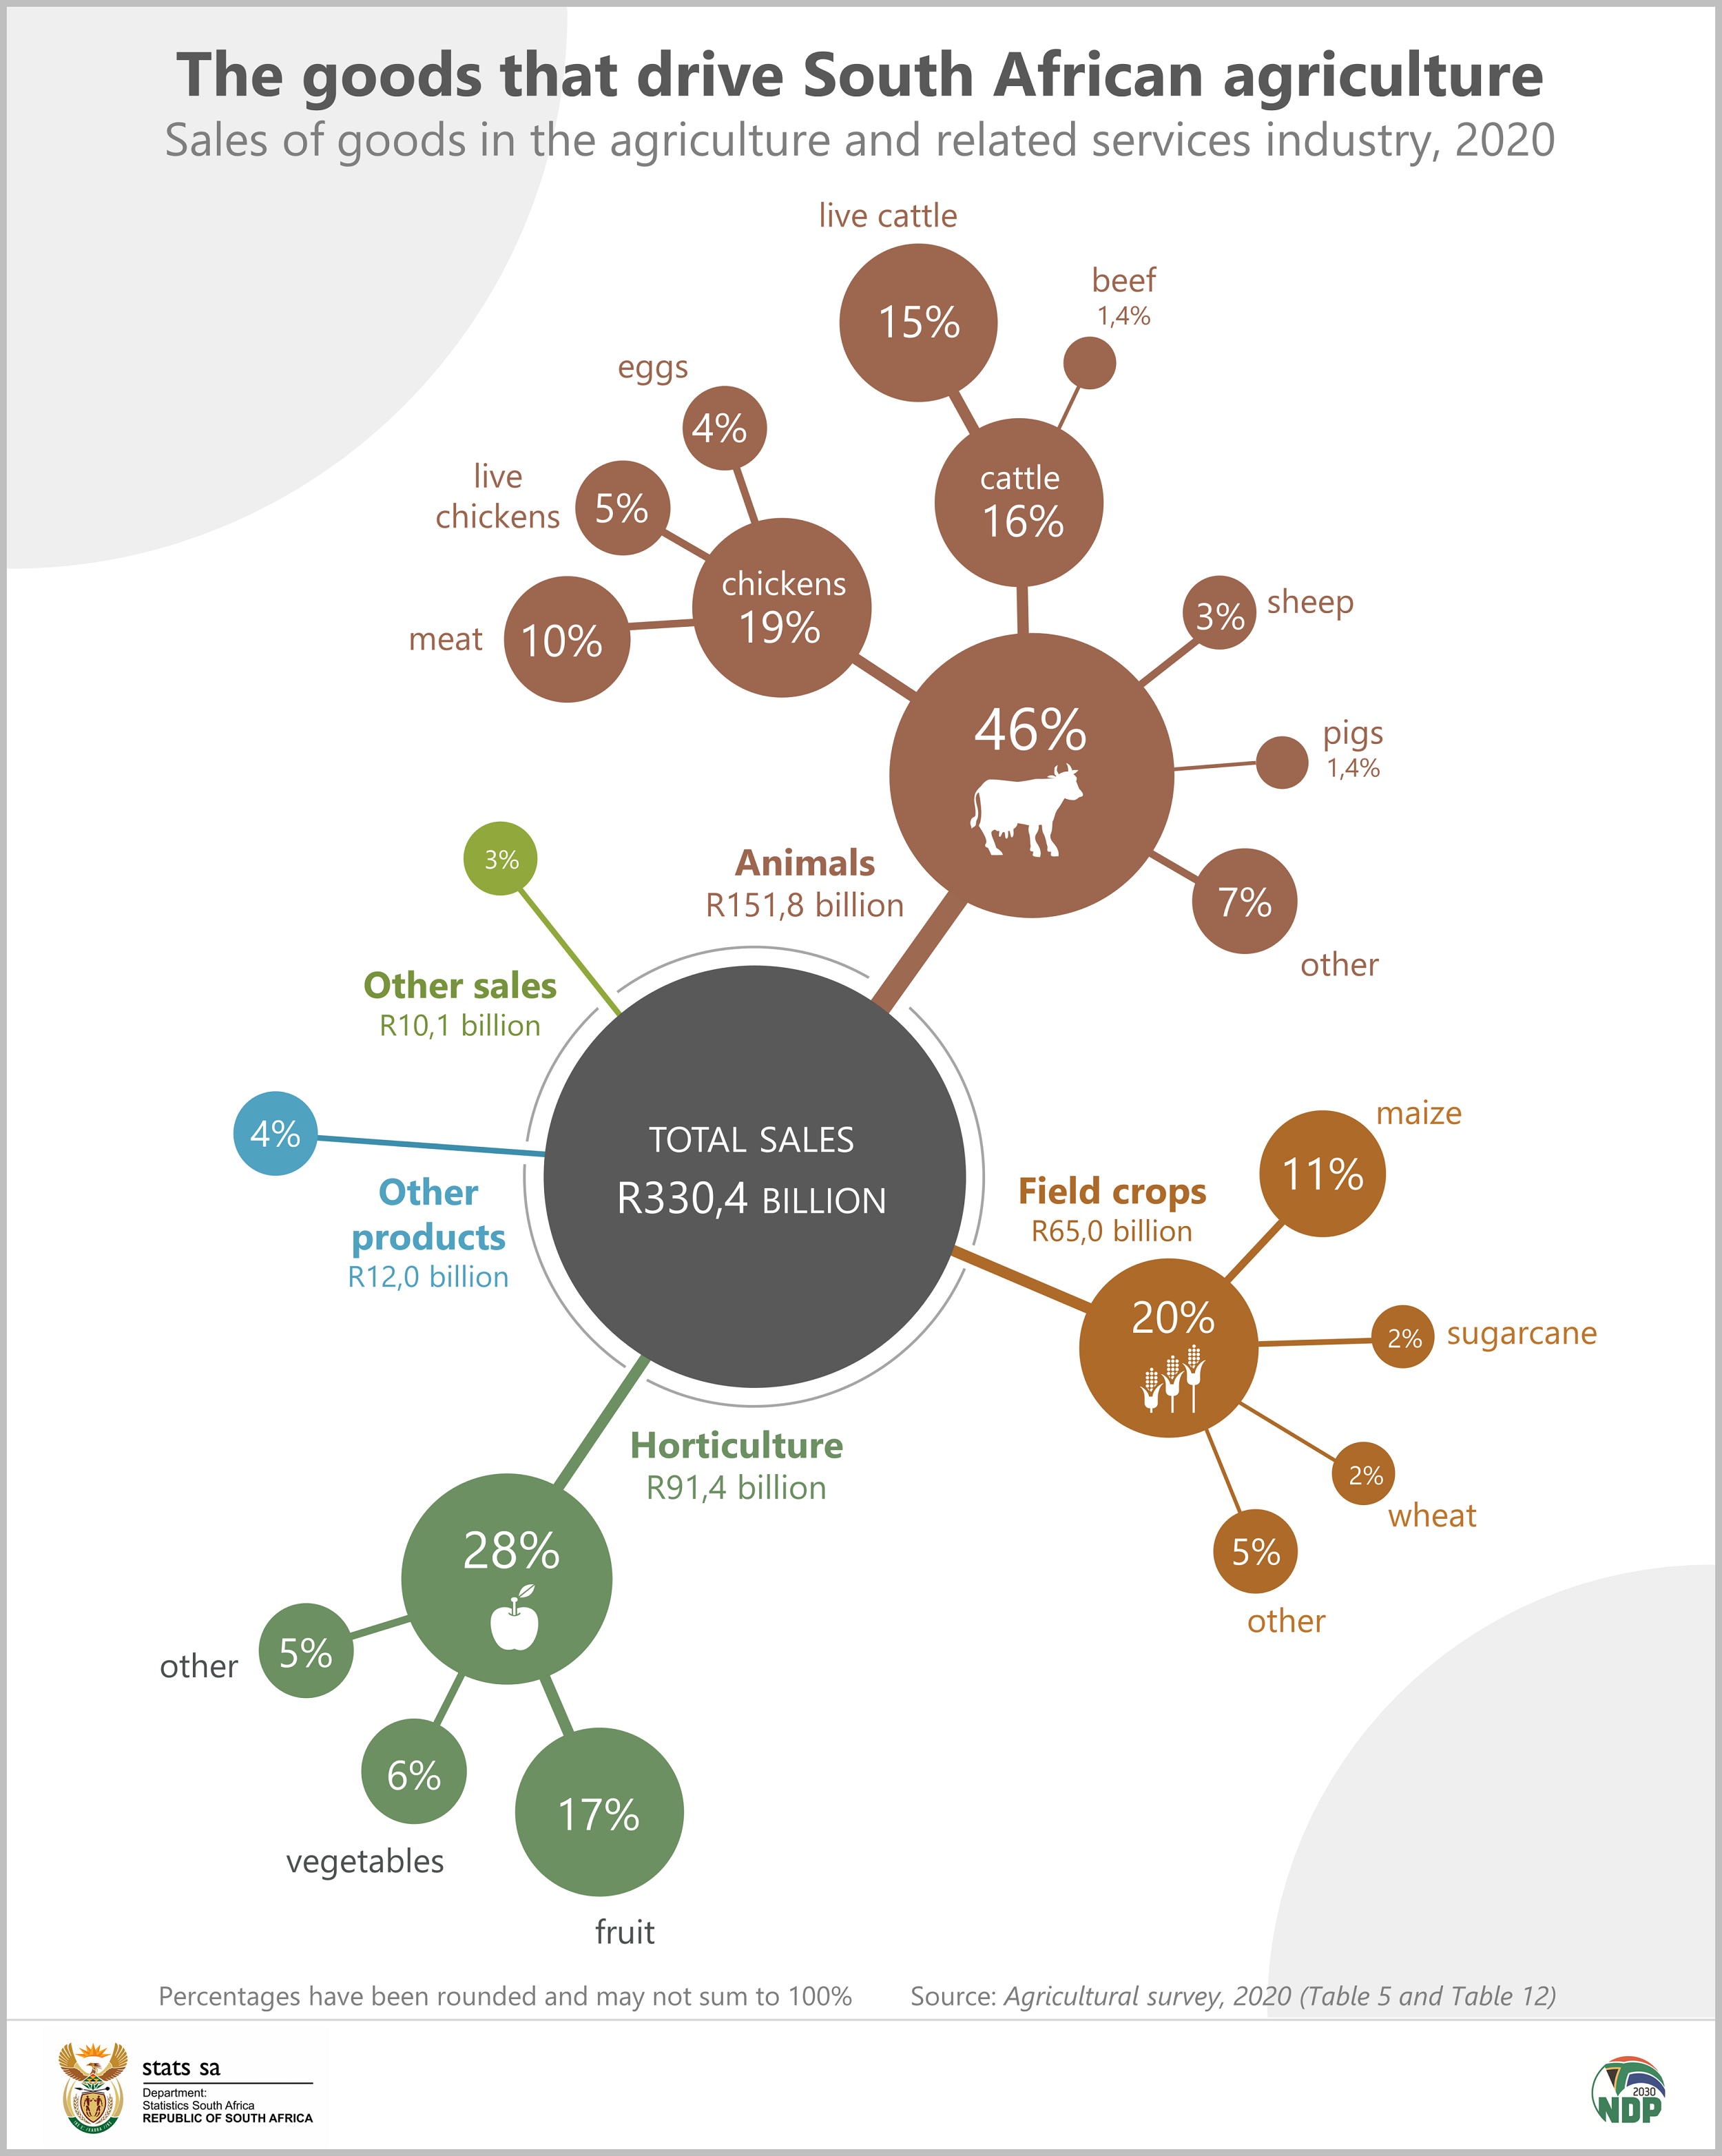
What products does agriculture depend on the most?
The disease is relentless. It spreads rapidly and is highly contagious. Livestock can catch foot-and-mouth from infected clothing, vehicles, feed, and equipment. On 11 April, the South African government announced that the country was grappling with 56 outbreak cases.1 China had already banned the imports of all South African cloven-hoofed animals and related products.2
How important are affected products to the local agriculture industry? The graphic below, from Stats SA’s latest agriculture survey, shows that the sale of cattle and their products accounts for 16% of total commercial agriculture revenue.3 Sheep account for 3% and pigs 1,4%.4
Irrespective of the size of their contributions, behind each of these products are supporting industries and jobs that depend on uninterrupted trade for economic survival. The maps below show that these industries are concentrated across various parts of the country.
Where are the animals located?
Yes, Stats SA counts animals too.
Whereas the annual agriculture survey is based on a sample, the 2017 Census of Commercial Agriculture (CoCA) was more extensive, covering all commercial farms.5 What makes the census dataset powerful is that it reports on a wide range of data by municipality. This includes a count of livestock.
There were 5,9 million head of cattle on South African farms in 2017, mostly concentrated in the provinces of Free State and Eastern Cape. Setsoto, which includes the town of Ficksburg, was the municipality with the largest cattle population.
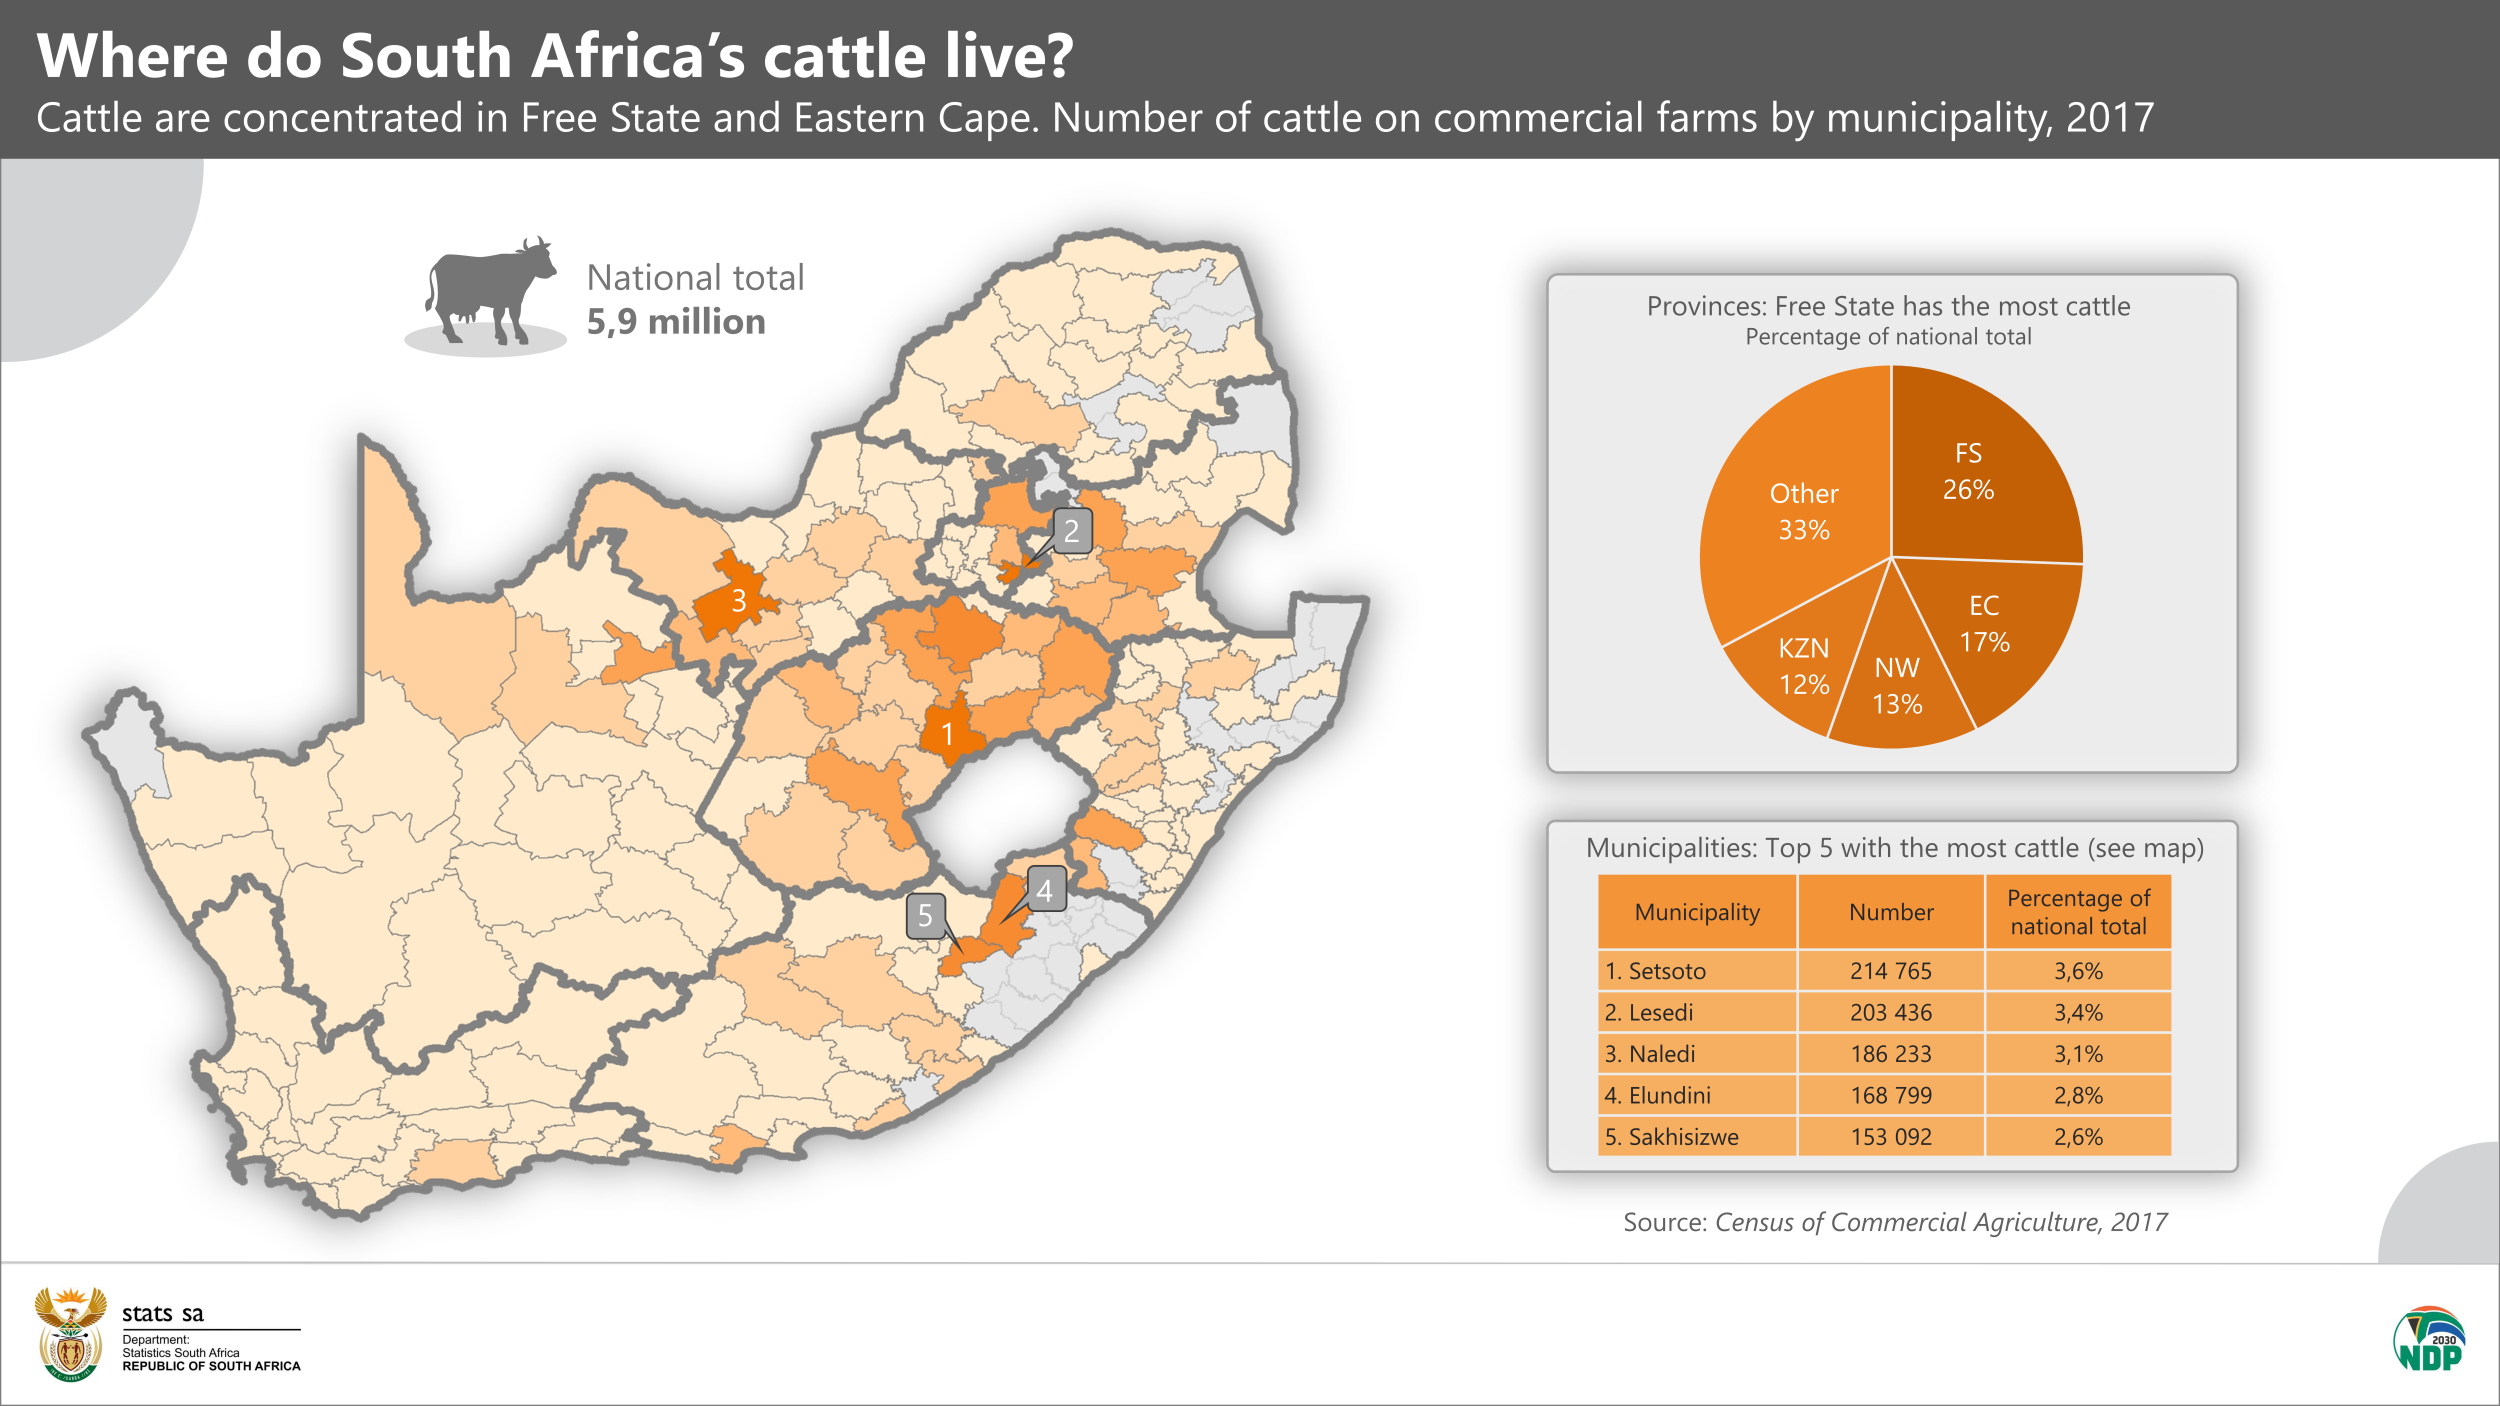
Of course, the data don’t provide an indication of informal ownership, as the scope of the census was commercial farms only. Despite this, the CoCA might have potential use in complementing other data sources to identify potential hotspots for disease.
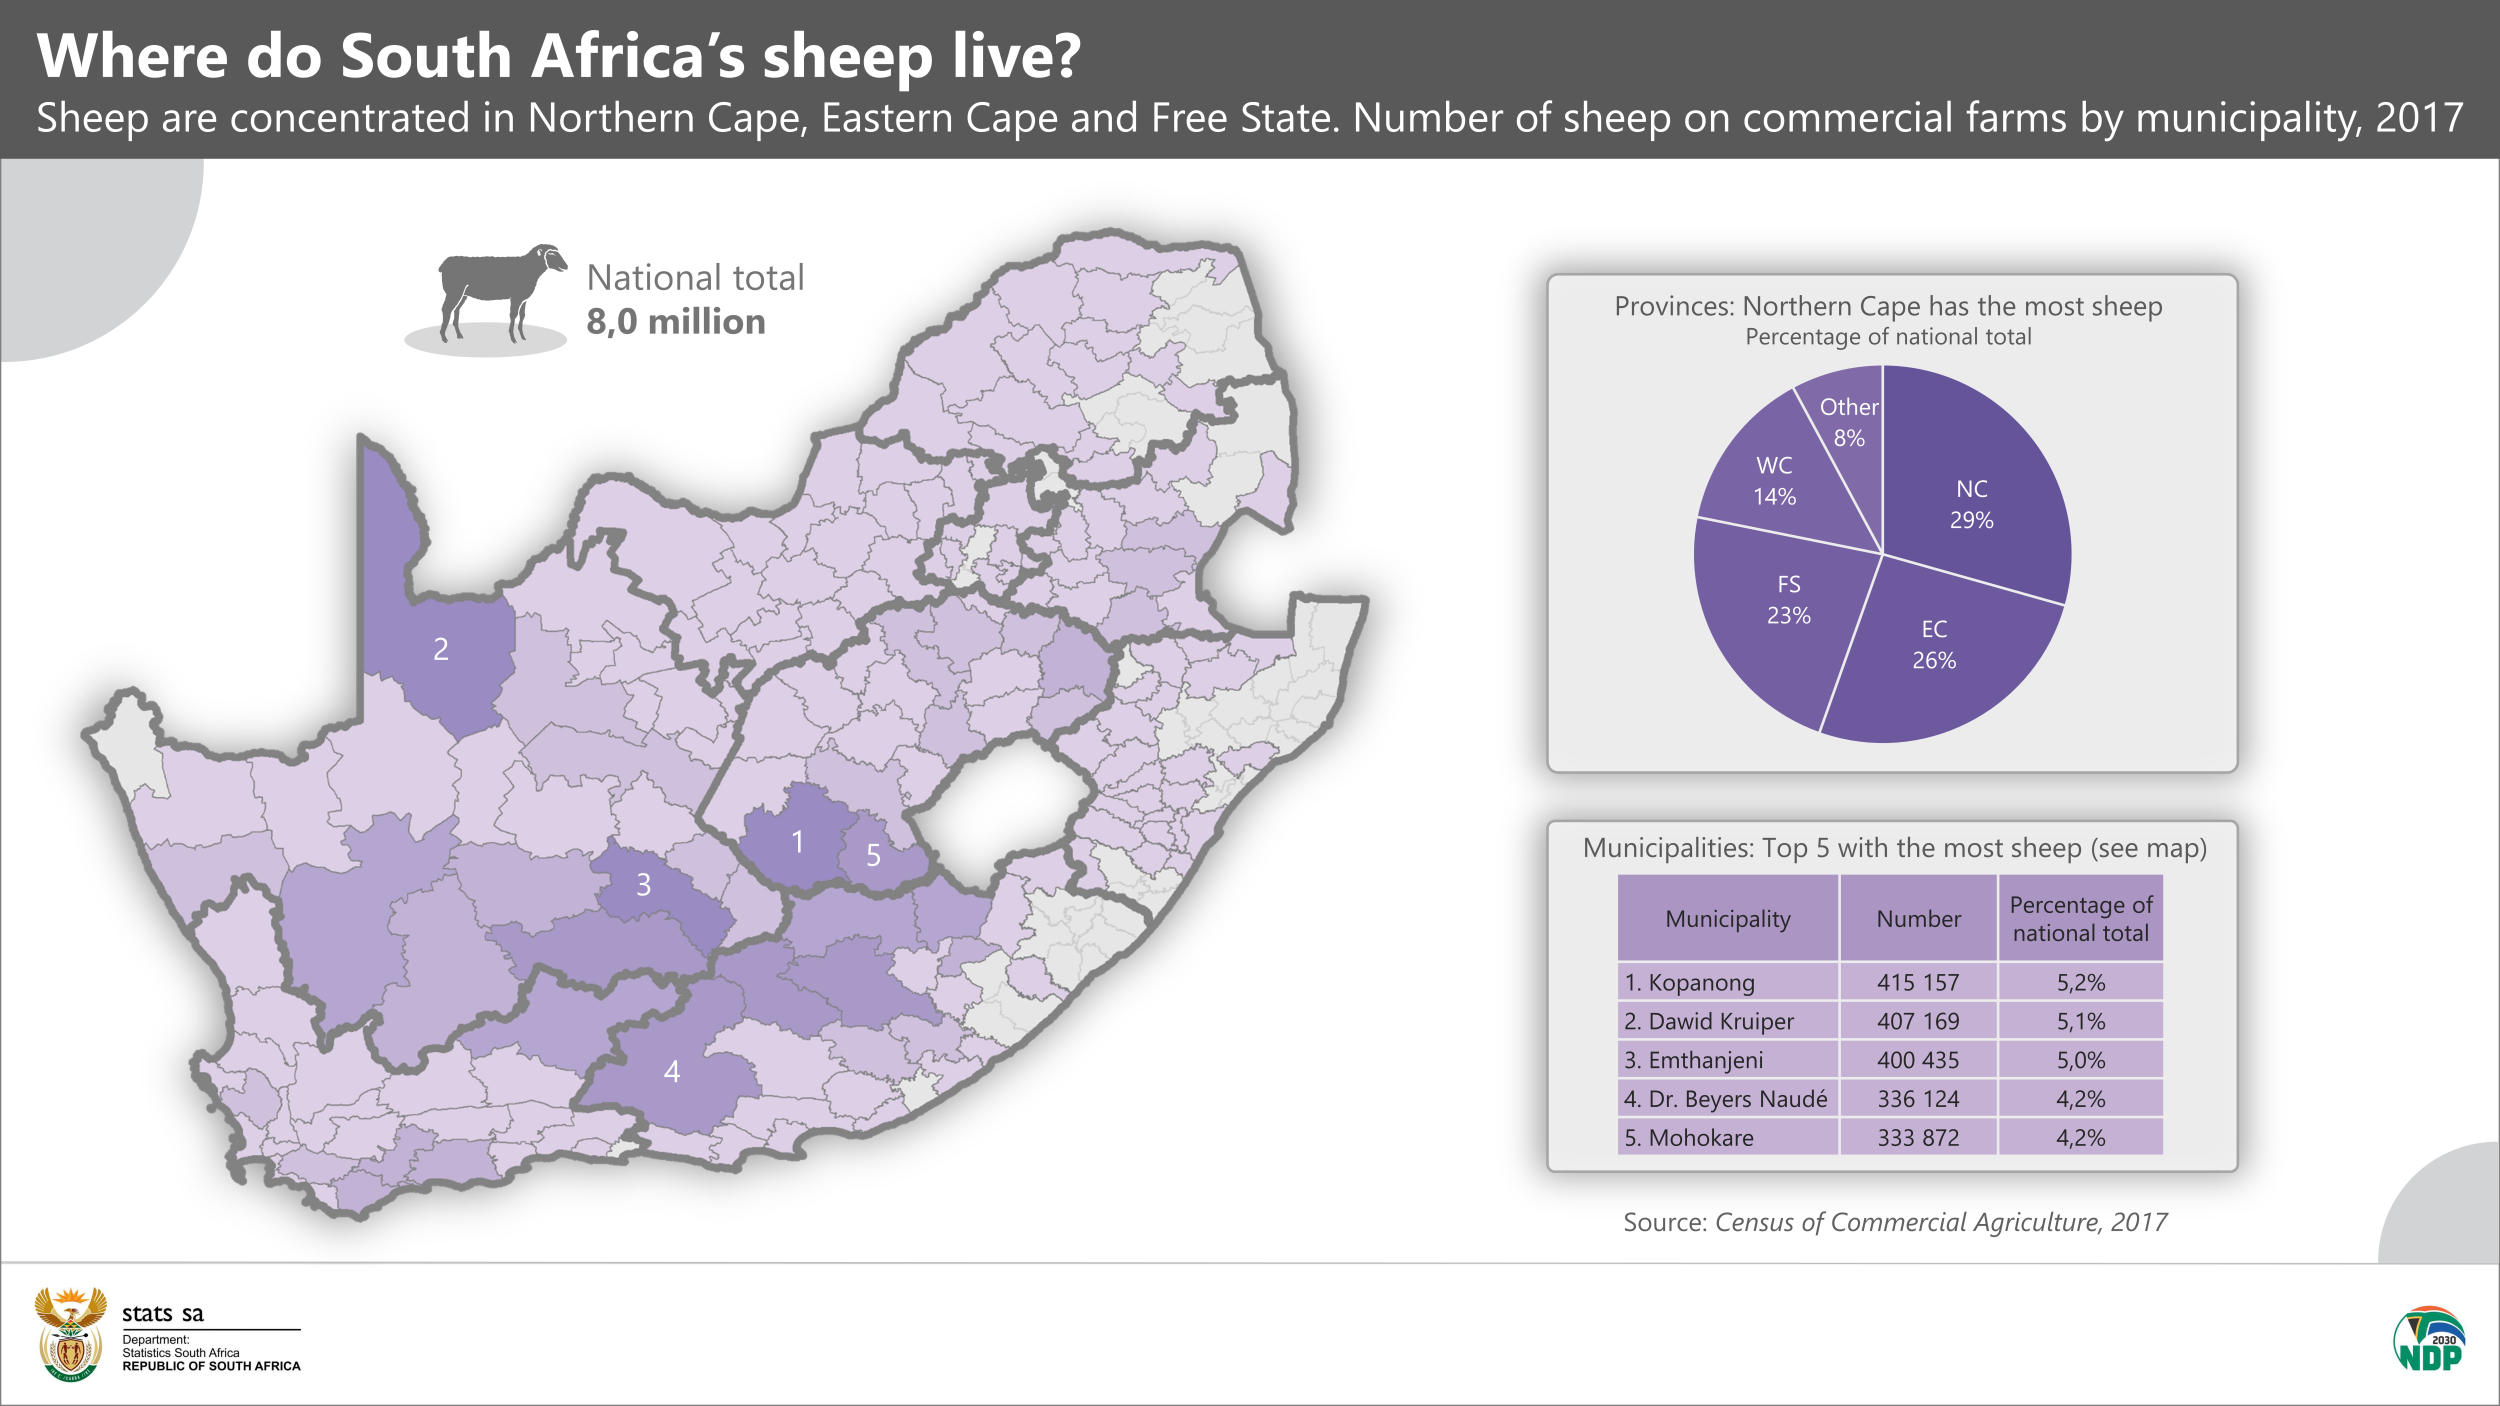
Most sheep on commercial farms were concentrated in a region covering parts of Northern Cape, Western Cape, Free State and Eastern Cape.
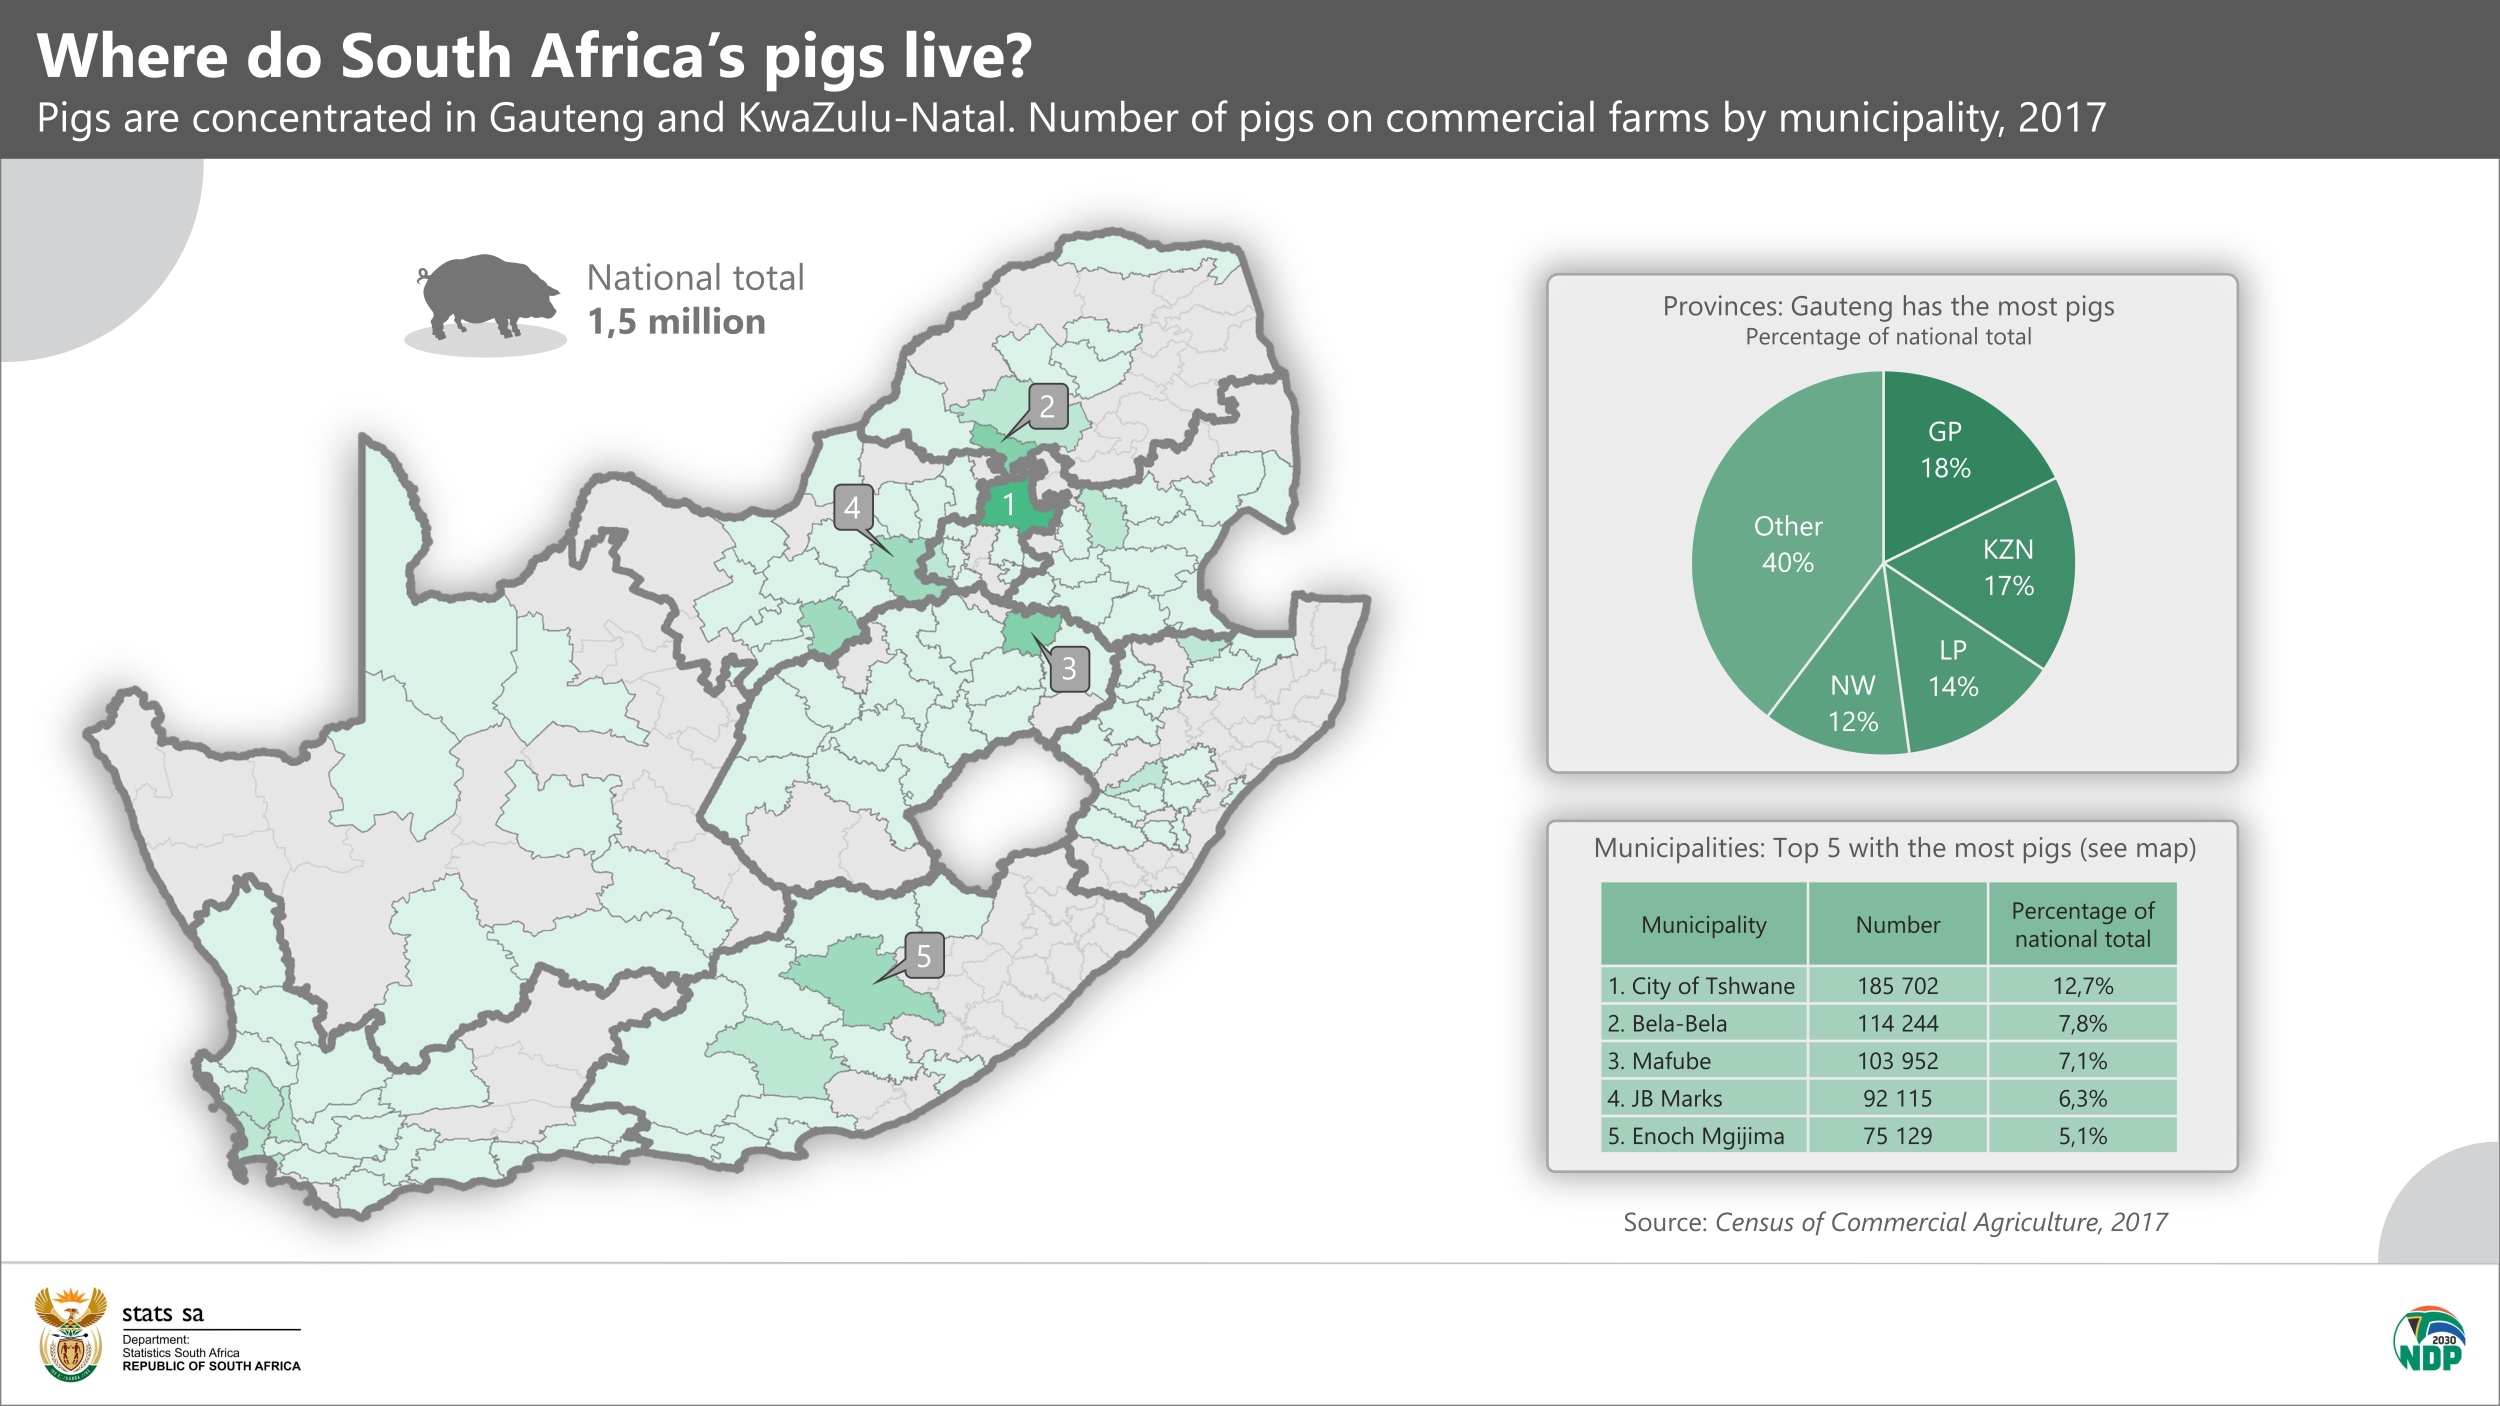
Gauteng, KwaZulu-Natal and Limpopo were home to half of South Africa’s commercially raised pigs in 2017. What’s interesting here is that a significant number – just over 185 000 – were located in the Pretoria region, in Tshwane metropolitan municipality. The concentration of pig farms in this region makes sense as the location provides easy access to the urban and high-income markets of Johannesburg and Pretoria.
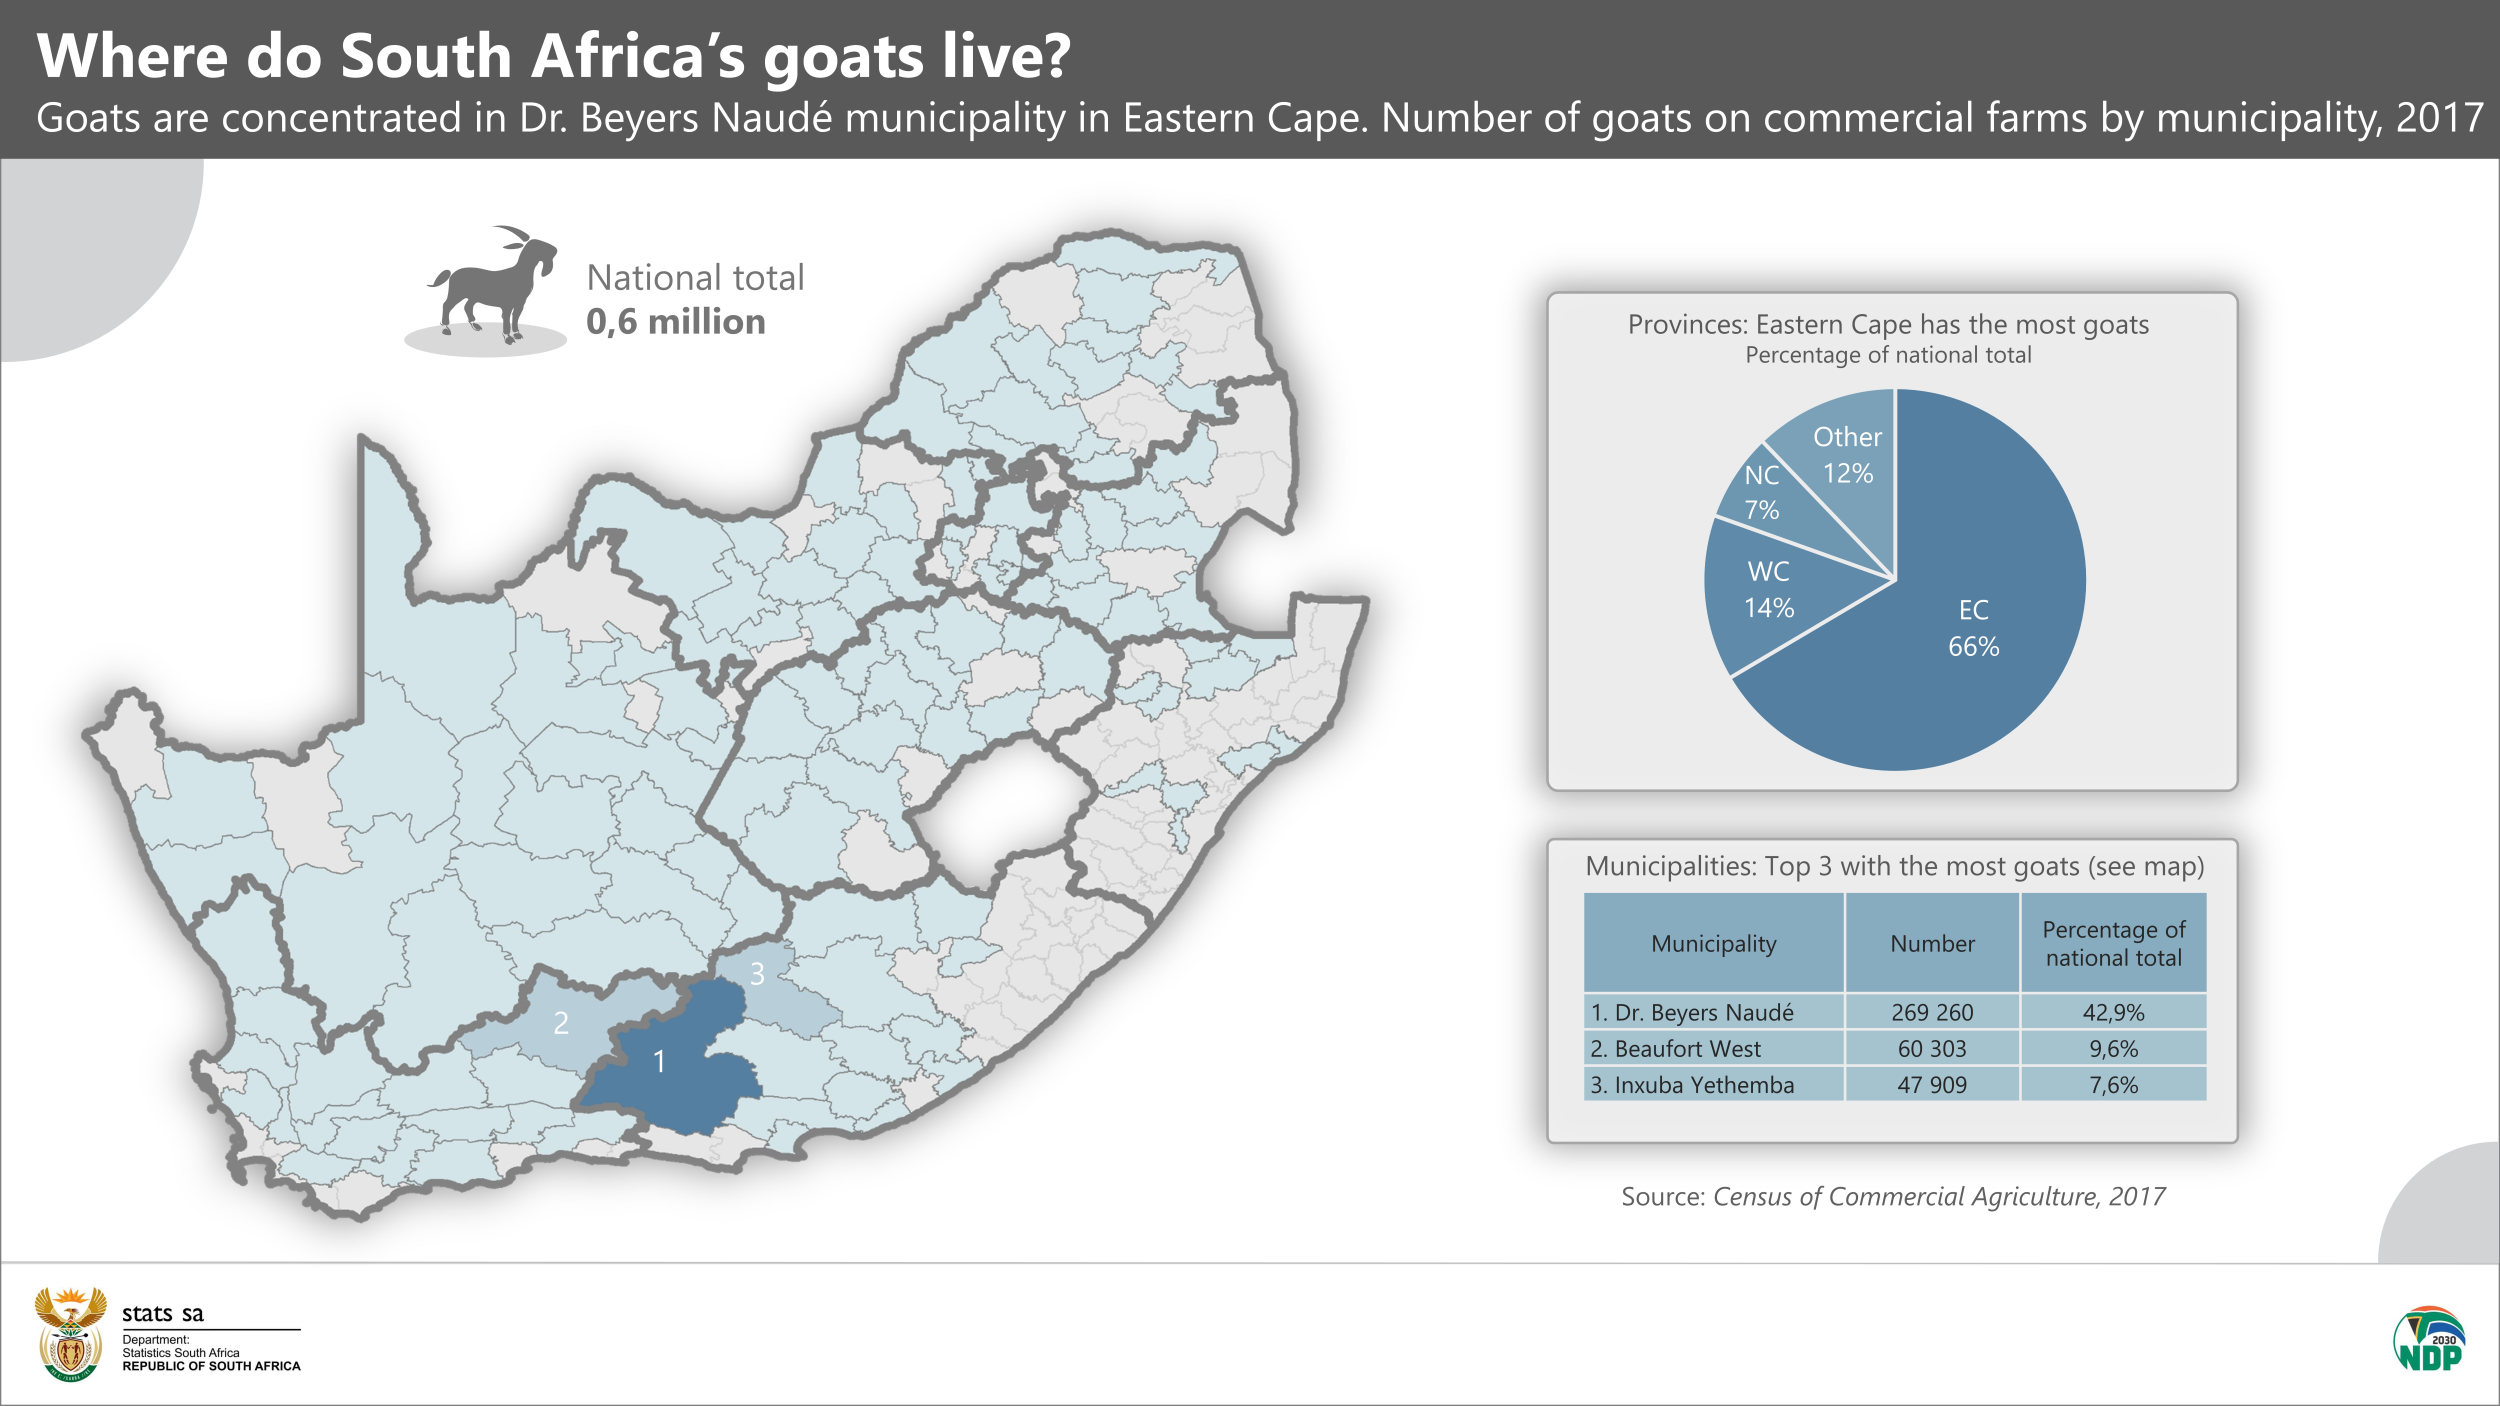
The country’s commercial goat population is the most spatially concentrated, with 60% of goats living in just three municipalities: Dr Beyers Naude and Inxuba Yethemba in Eastern Cape, and Beaufort West in Western Cape.
Controlling foot-and-mouth disease is key to protecting those industries that are most vulnerable. Information on commercial agriculture, such as sales and location data, can contribute towards an understanding of the risks from a potential outbreak.
1 United States Department of Agriculture, South Africa Attempts to Control Food and Mouth Disease Outbreaks (download here).
2 Daily Maverick, China ban hits SA wool industry while foot and mouth disease spreads to Free State and Gauteng (read here).
3 Stats SA, Agriculture survey, 2020 (download here).
4 Note that the data do not provide an overall sales figure for cloven-hoofed animals as a whole, as a few cloven-hoofed animals (e.g. antelope) are classified in the ‘other’ category together with other animals and other general products (e.g. milk).
5 For more information on the 2017 Census of Commercial Agriculture (CoCA), download the national report, media presentation and summary fact sheets here.
Similar articles are available on the Stats SA website and can be accessed here.
For a monthly overview of economic indicators and infographics, catch the latest edition of the Stats Biz newsletter here.