
Going with the flow: Tracking products through our economy
Economically, no country is an island. Just as a household cannot produce all that it needs on its own, South Africa depends on global trade for a range of goods and services.
Take crude petroleum. Figure 1 tracks oil-related transactions across our economy, showing where crude petroleum comes from and where it ends up. The supply (or production) side describes how crude petroleum is brought into the economy. Almost all of supply (90%) is imported while 10% is locally produced. What this shows is that South Africa depends a lot on the international community for this resource.
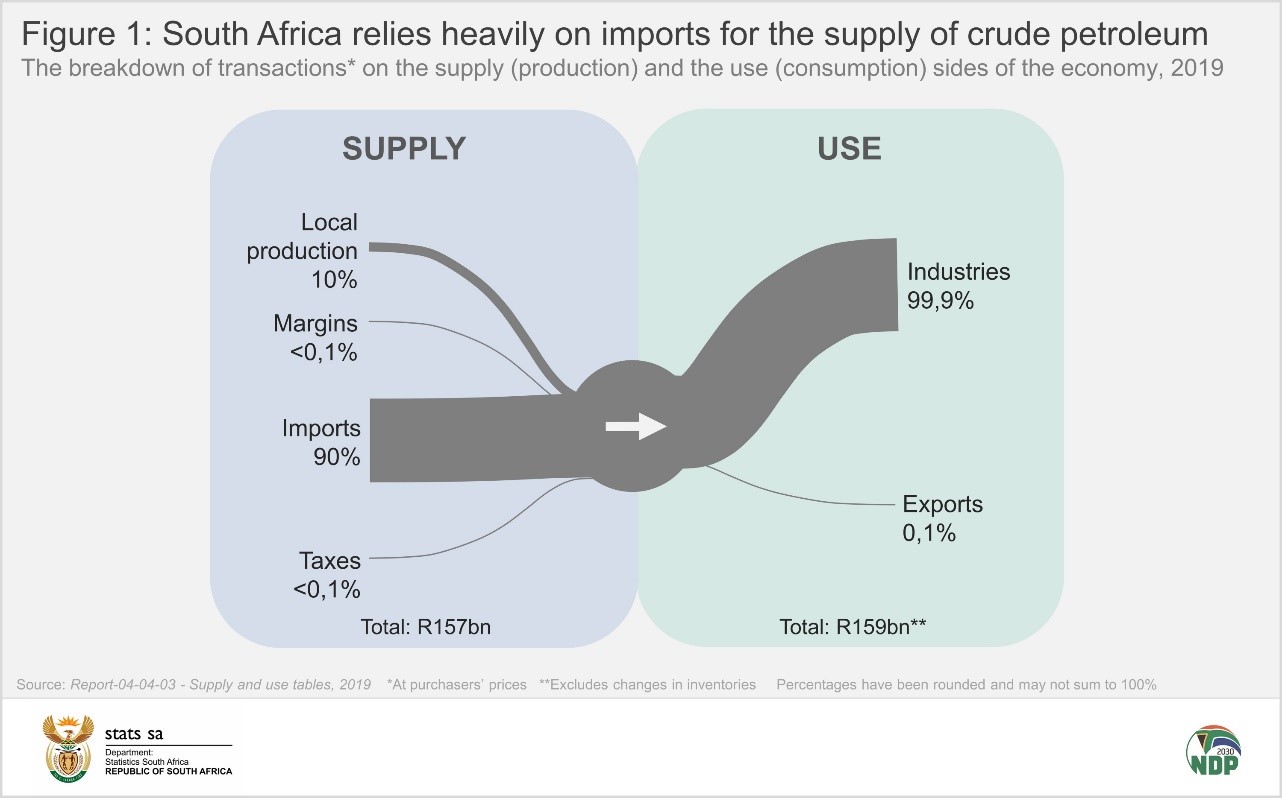
The use (or consumption) side describes where and how crude petroleum is used, either locally or exported to other countries. Almost all transactions on the use side are processed by local industries that use crude petroleum to produce other goods. Oil refineries are the main players here, turning crude petroleum into diesel, petrol, paraffin and other related products. Differences in supply and use values are mainly due to changes in inventories.
Relying on other nations
Let’s look at a few other examples. Not only does South Africa depend on imports of crude petroleum, but it also relies on the global community for other products such as medical appliances, special-purpose machinery, lifting and handling equipment, and aircraft (click on Figure 2 to enlarge).
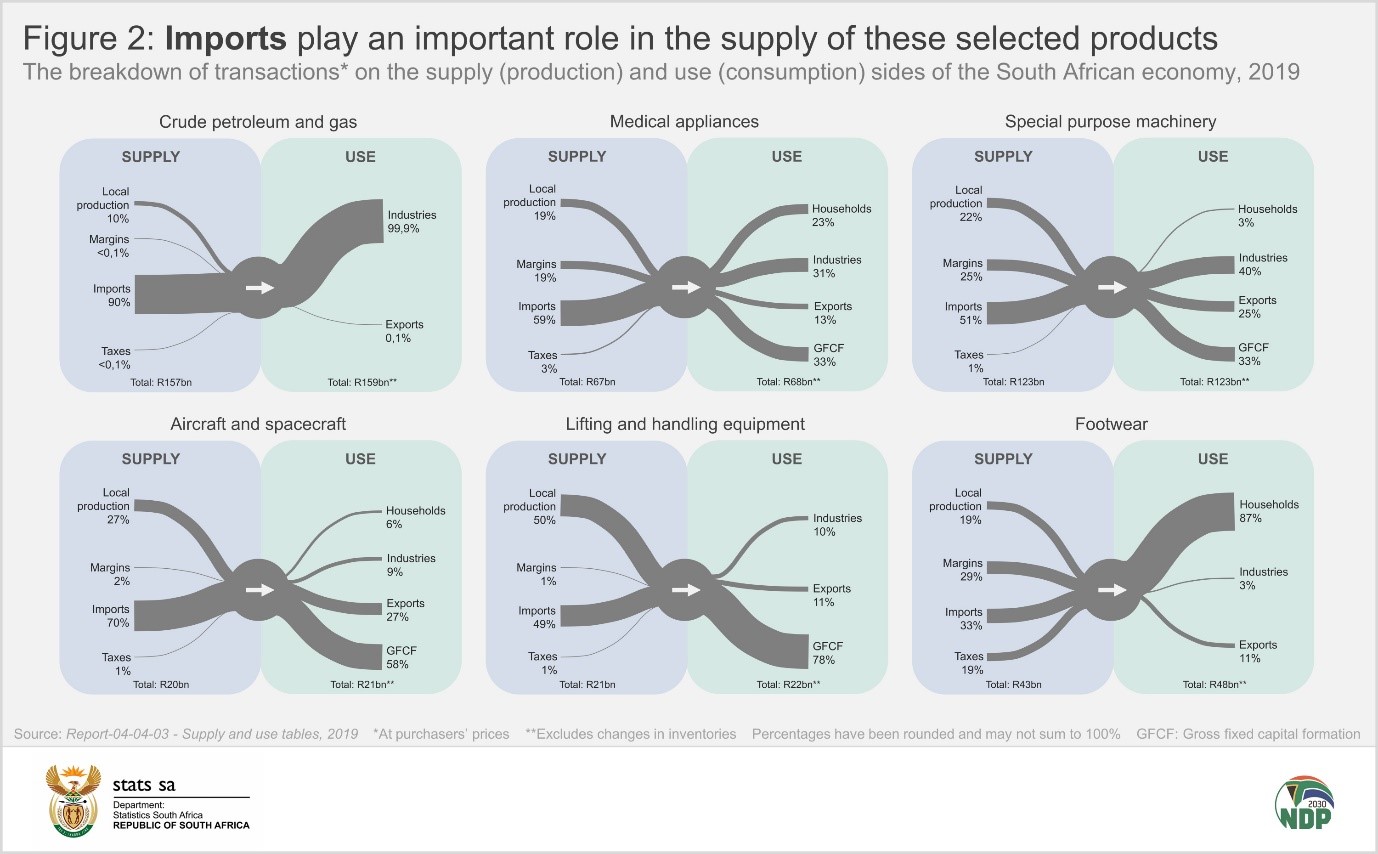
Notice the dominance of gross fixed capital formation (GFCF) on the use side for medical equipment, aircraft, and lifting and handling equipment. GFCF is a fancy term in the field of national accounts that describes brick-and-mortar type of investments in the economy, such as infrastructure development and spending on other fixed assets such as plant, machinery, land and vehicles.
Footwear might seem out of place here. Predominantly consumed by households on the use side of the economy, the country relies on imports more than local production to keep millions of feet protected.
These diagrams represent data from Stats SA’s latest supply and use tables (SUTs). The SUTs provide a wealth of data on transactions in the economy, covering 108 goods and services across 124 industries.
Exploring our trade strengths
What do the SUTs say about South Africa’s contributions to global trade? The first three diagrams in Figure 3 show the importance of mining. Basic precious metals, metal ores and coal are dominated by domestic production on the supply side. On the use side of the economy, basic precious metals and metal ores are mainly exported.
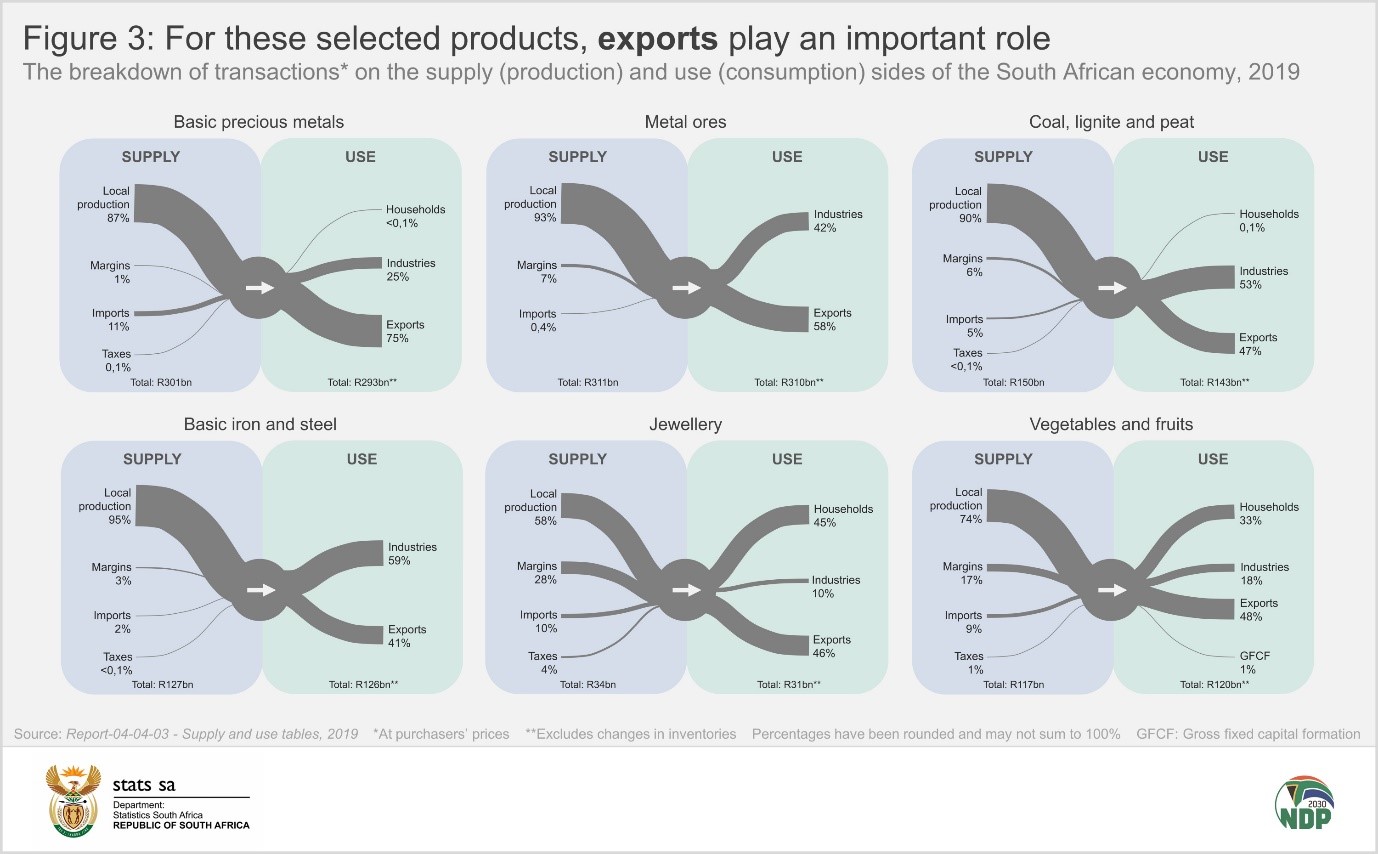
For coal there is an almost equal split between local industries and exports on the use side (and households representing a tiny amount). Investigating further, the data show that the domestic consumption of coal is dominated by the electricity sector and oil refineries.
Retail therapy
It might come as no surprise that certain products are dominated by household consumption. A few of these are shown in Figure 4.
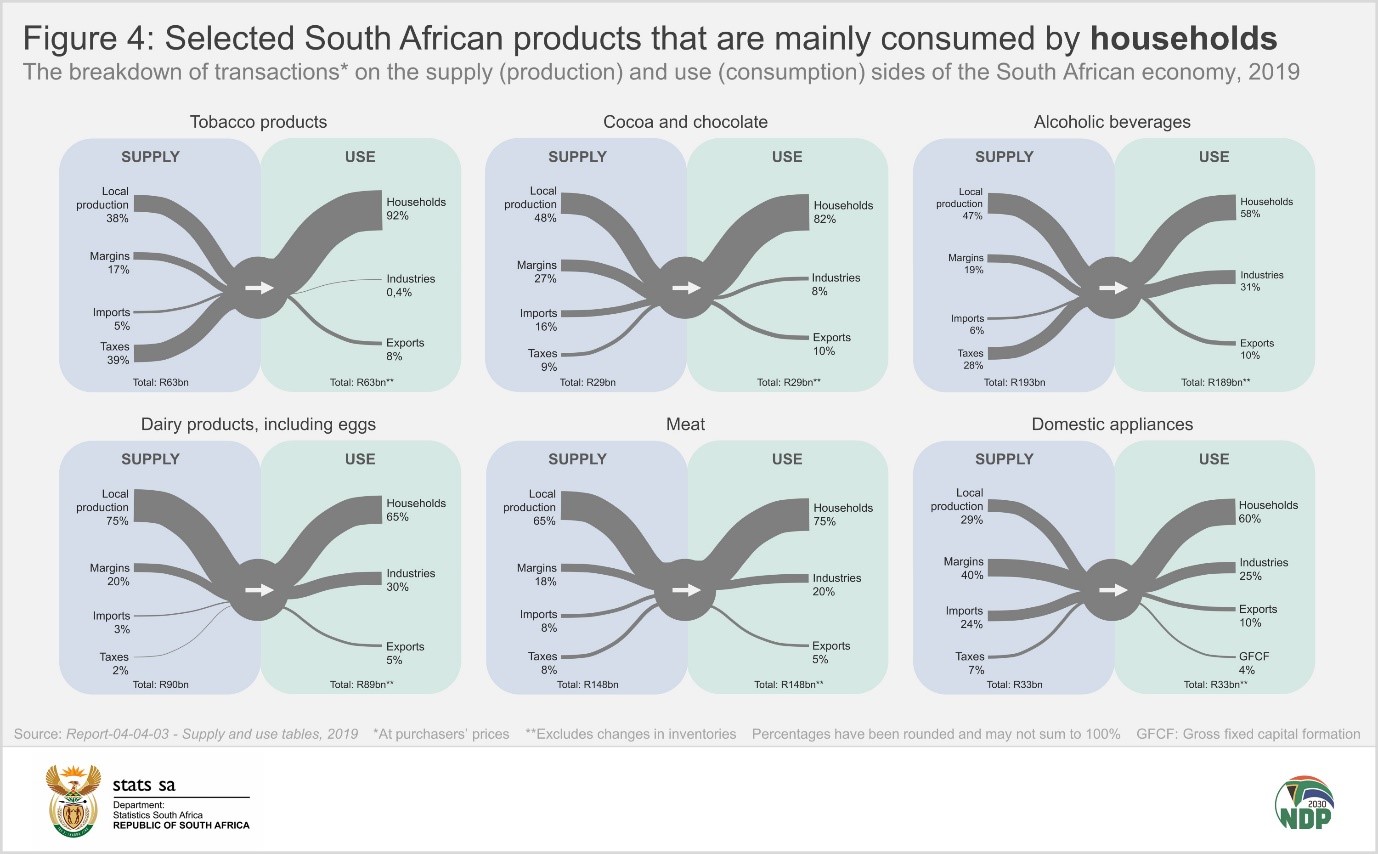
Domestic appliances are notable in carrying sizable margins1 on the supply side of the economy. In terms of tobacco products, notice the significant contribution of taxes2 on the supply side.
A bird’s-eye view: Another way to look at the data
Each diagram above shows how transactions for a particular product are distributed across both sides of the economy. To get an overall picture, another way to explore the data is to rank the rand values of products against one another (Figure 5).
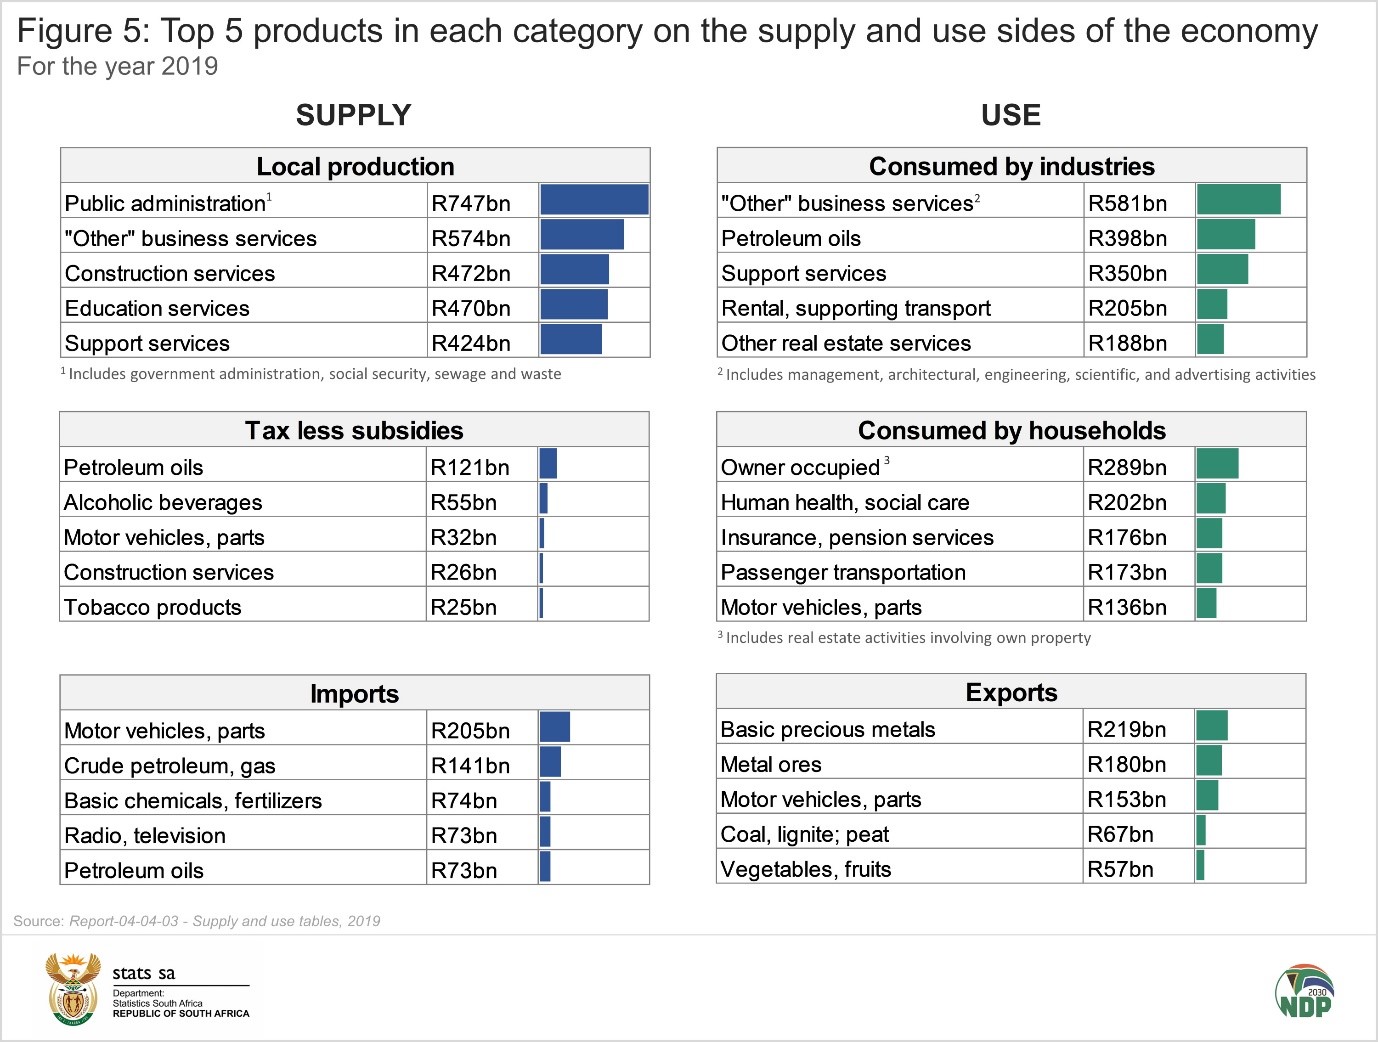
In terms of local production on the supply side, the most significant products are public administration and “other” business services. Petroleum oils account for the largest share of taxes less subsidies, followed by alcoholic beverages and motor vehicles. The automotive industry, which includes motor vehicles, plays an important role in both import and export markets.
Every economy has its own unique fingerprint, and South Africa is no different. The SUTs provide an indication of what drives activity on the supply side of the economy, and what stimulates consumption on the use side. These kinds of data provide insight into what South Africa is currently offering the world, and what our dependencies are. With war, global supply chain challenges, the threat of inflation, and market downturns, knowing our strengths and weaknesses will help us plan for (and eventually weather) the storms that come our way.
For more information, download the release and Excel files for the 2018 and 2019 SUTs here.
1 Margins include both trade and transport margins. A trade margin is the difference between the price that a merchant paid for a good and the price that the merchant later sold the good for. Transport margins represent freight transportation services when invoiced separately by the seller. These are transport charges paid separately by the purchaser to take delivery of products at a required time and place.
2 Taxes less subsidies on products. Generally the burden of such taxes falls on the end consumer, but they are recorded on the supply side as it is the producer’s responsibility to pay the tax over to government.
Similar articles are available on the Stats SA website and can be accessed here.
For a monthly overview of economic indicators and infographics, catch the latest edition of the Stats Biz newsletter here.