
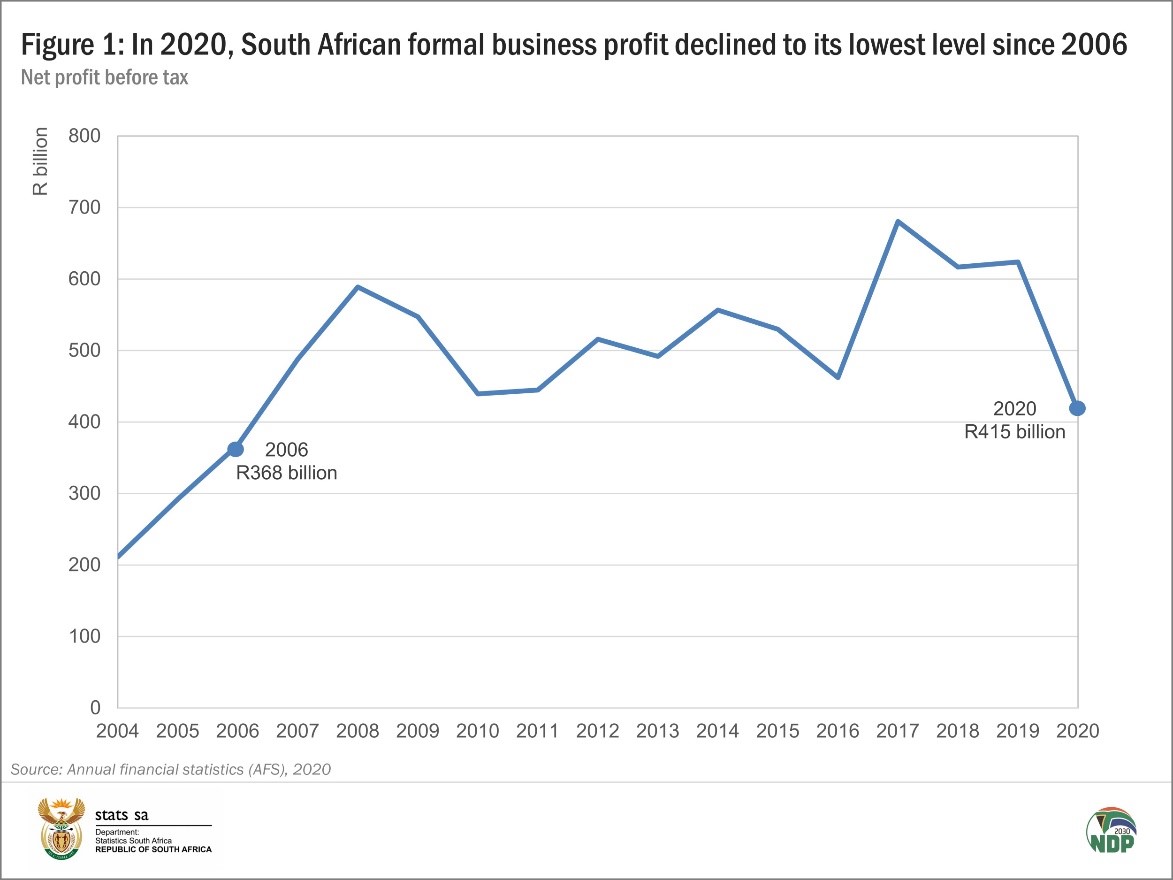
Pre-lockdown business profits fall to their lowest level in 14 years
Net profit before tax in the formal business sector tumbled by 33,4% in the financial year 2020 compared with 2019, with business services and manufacturing the hardest hit.
The data, from Stats SA’s latest Annual financial statistics (AFS) survey1 , which mostly covers the period before the lockdown, show that total net profit before tax fell to its lowest level since 2006, declining from R624 billion in 2019 to R415 billion in 2020. The reading in 2006 was R368 billion.
Net profit before tax refers to the surplus income that a business retains from all generated income less the expenses incurred in the business.
When referring to the year 2020, the survey covers the financial years of companies ending on any date between 1 July 2019 and 30 June 2020. Different businesses adopt different financial periods, so only a portion of companies surveyed had their financial years falling over the first three months of the national lockdown that began on 27 March 2020. In fact, 86% of companies’ financial years ended prior to the national lockdown, while 14% had financial years ending between April and June 2020.
Seven out of nine industries covered by the survey reported lower profit in 2020 compared with 2019 (Figure 2). Business services and manufacturing reported the largest decreases, with declines of R126,9 billion and R65,9 billion respectively. Electricity, gas and water supply and personal services recorded a rise.
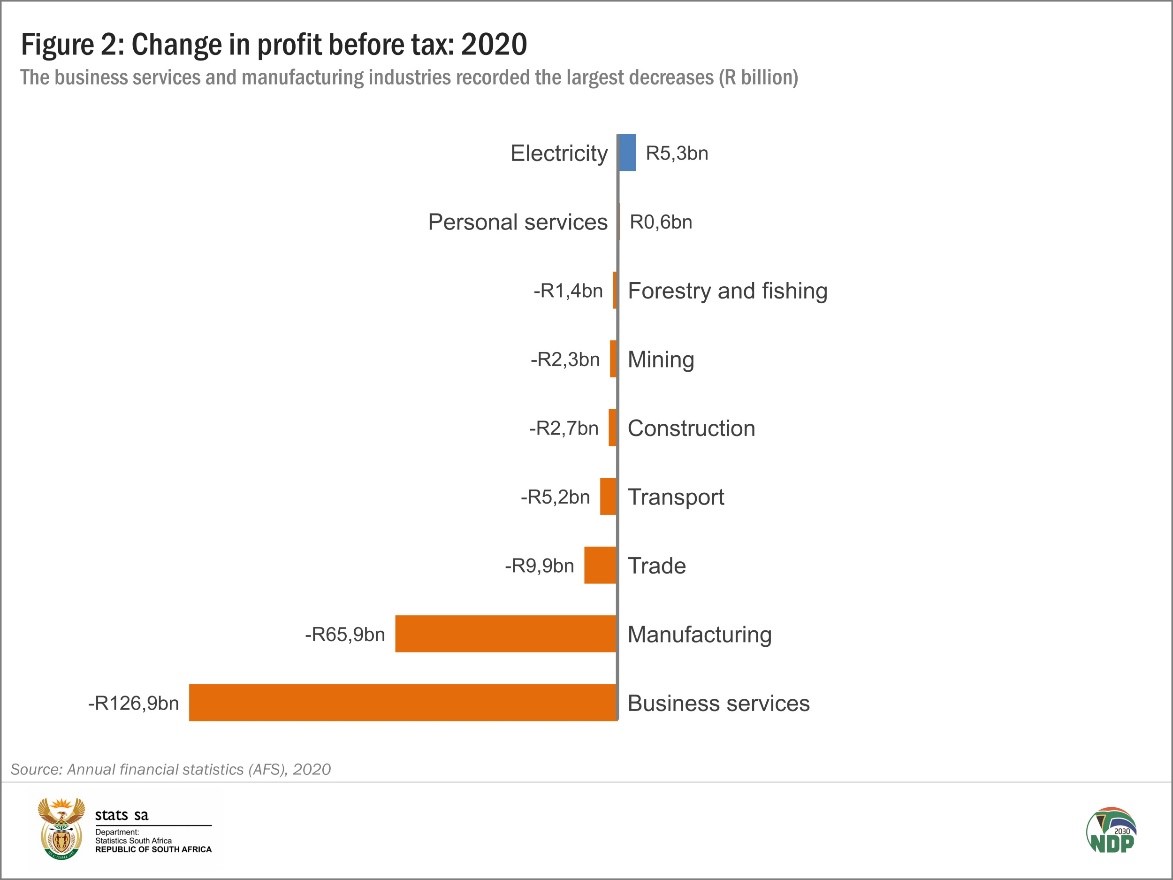
An increase in losses on assets, recognition of expenses related to International Financial Reporting Standards (IFRS) 162, as well as a rise in purchases were the main factors behind the lower profit figures for business services and manufacturing. The sectors within business services that reported the largest losses on assets were those involved in business and management consultancy activities and property owning and letting. Manufacturing recorded an increase of R13,9 billion in interest payments. This also contributed to lower profits in that industry.
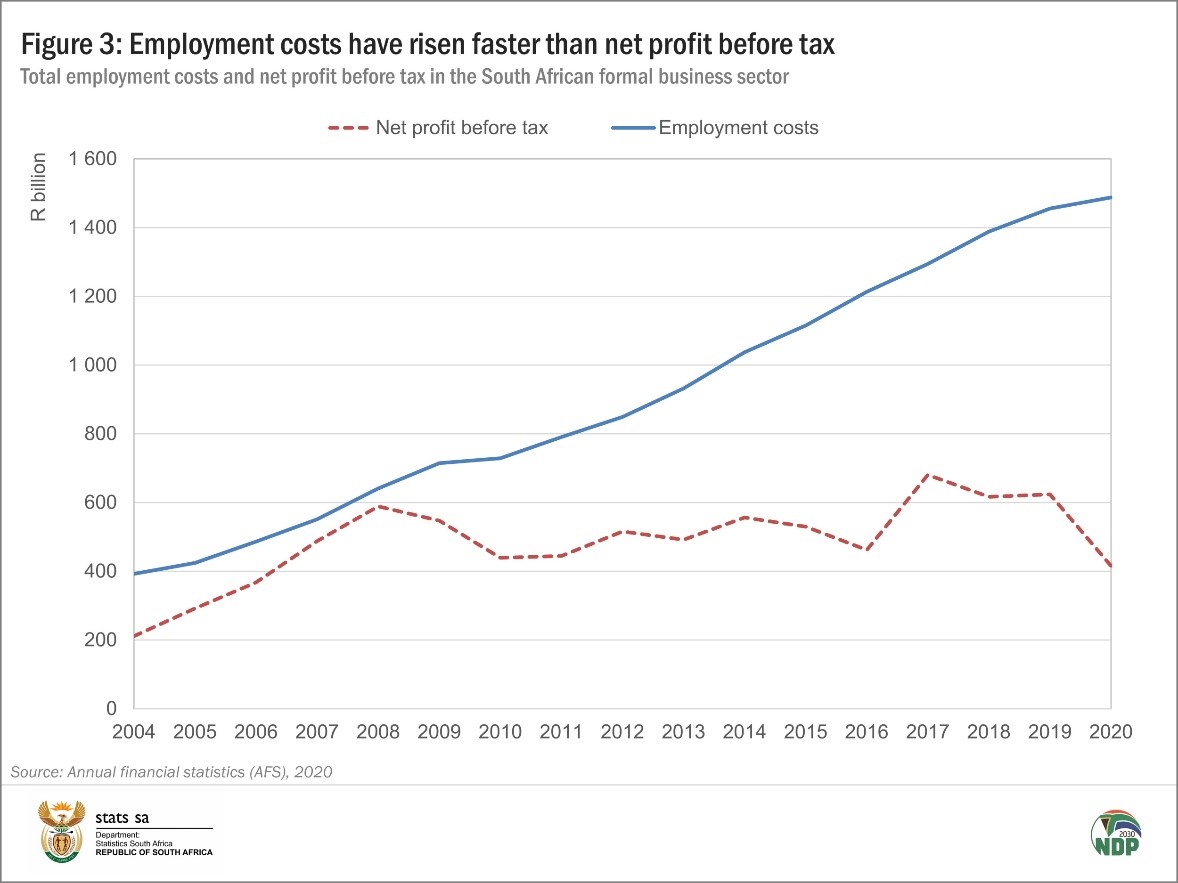
Figure 3 shows another interesting aspect from the time series data. Since 2008 employment costs have grown at a faster rate than net profit before tax. This wasn’t always the case, however. Prior to the 2008–2009 global financial crisis, profits rose the fastest. In 2020, employment costs accounted for just over 13% of total expenditure.
The decrease in profits in 2020 coincides with a relatively subdued rise in turnover. Total turnover in the formal business sector increased by 4,1% in 2020 compared with 2019, the lowest growth rate since the 2008–2009 global financial crisis when turnover tumbled by 6,5%. Between 2019 and 2020, turnover increased in six of the nine industries covered by the survey. The biggest increase was reported in electricity, gas and water supply (+12,4%), followed by mining and quarrying (+11,1%). The biggest decreases were reported in forestry and fishing (-4,3%) and construction (-4,3%).
For more information, download the Annual financial statistics, 2020 report here.
1 The AFS survey measures the financial health and performance of each industry, providing information on turnover, purchases, and capital expenditure. The report sources data from the financial statements of enterprises (i.e. private businesses and public corporations), and is in turn an important source for estimating annual gross domestic product (GDP). The AFS excludes agriculture and hunting; general government and educational institutions; and financial intermediation, pension funding, insurance and business services ‘not elsewhere classified’.
2 Note that the AFS 2020 report also includes the first estimates which relate to the International Financial Reporting Standards (IFRS) 16. IFRS 16 was issued in January 2016 and applies to annual reporting periods beginning on or after 1 January 2019. The application of the standard results in increases in values of various variables, including interest paid, depreciation and losses, and profits on revaluation of assets.
Similar articles are available on the Stats SA website and can be accessed here.
For a monthly overview of economic indicators and infographics, catch the latest edition of the Stats Biz newsletter here.