
Third wave of COVID and civil disorder pummel economy as GDP falls by 1,5%
Under the twin pressures of tighter COVID-19 lockdown restrictions and a spate of civil disorder in July, as well as several other headwinds, the South African economy contracted in the third quarter of 2021 (July–September).
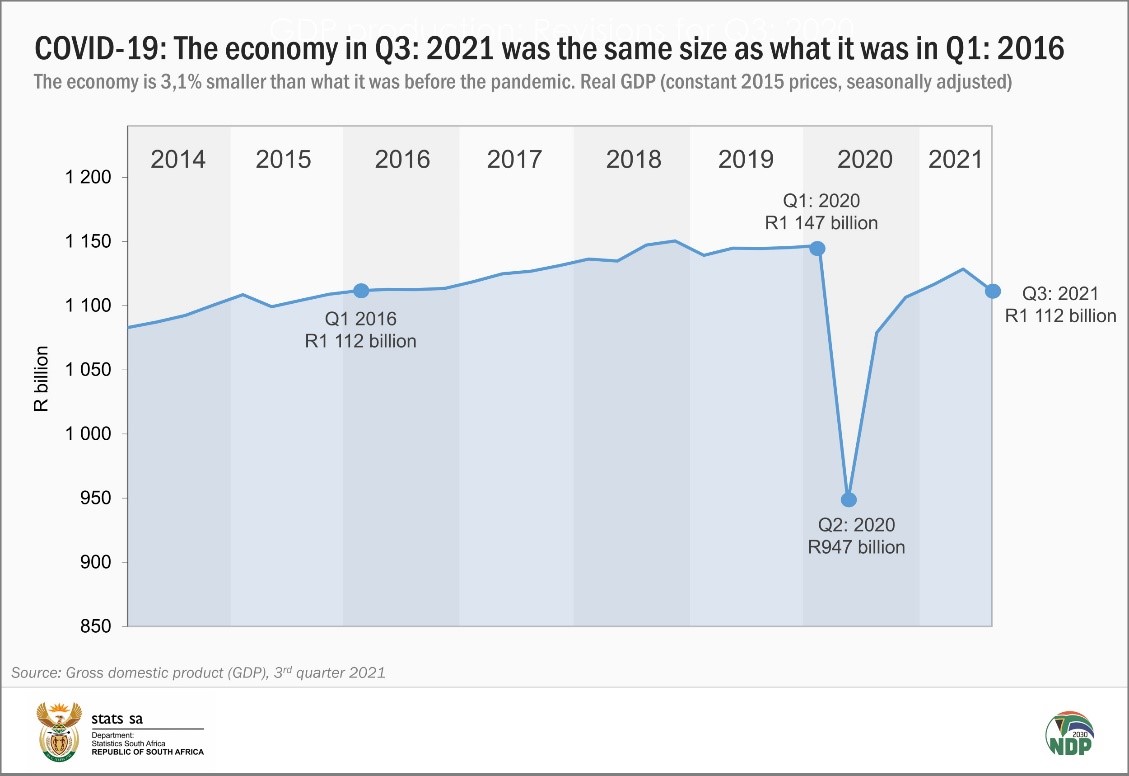
After recording four consecutive quarters of positive growth, real gross domestic product (GDP) slumped by 1,5%1, eroding some of the economic gains the country has made since the severe impact of COVID-19 in the second quarter of 2020. In the third quarter of 2021 the level of GDP was on par with the first quarter of 2016.
A double blow: civil disorder and lockdown
Six of the ten industries recorded a decline in production in the third quarter, with agriculture, trade and manufacturing the hardest hit.
The agriculture industry recorded its biggest drop in production since 2016, contracting by 13,6%. Together with a decline in the production of animal products, the industry in KwaZulu-Natal was dealt a major blow by the civil disorder in July. Maize, citrus and sugarcane farms recorded losses from fires set during the upheaval.
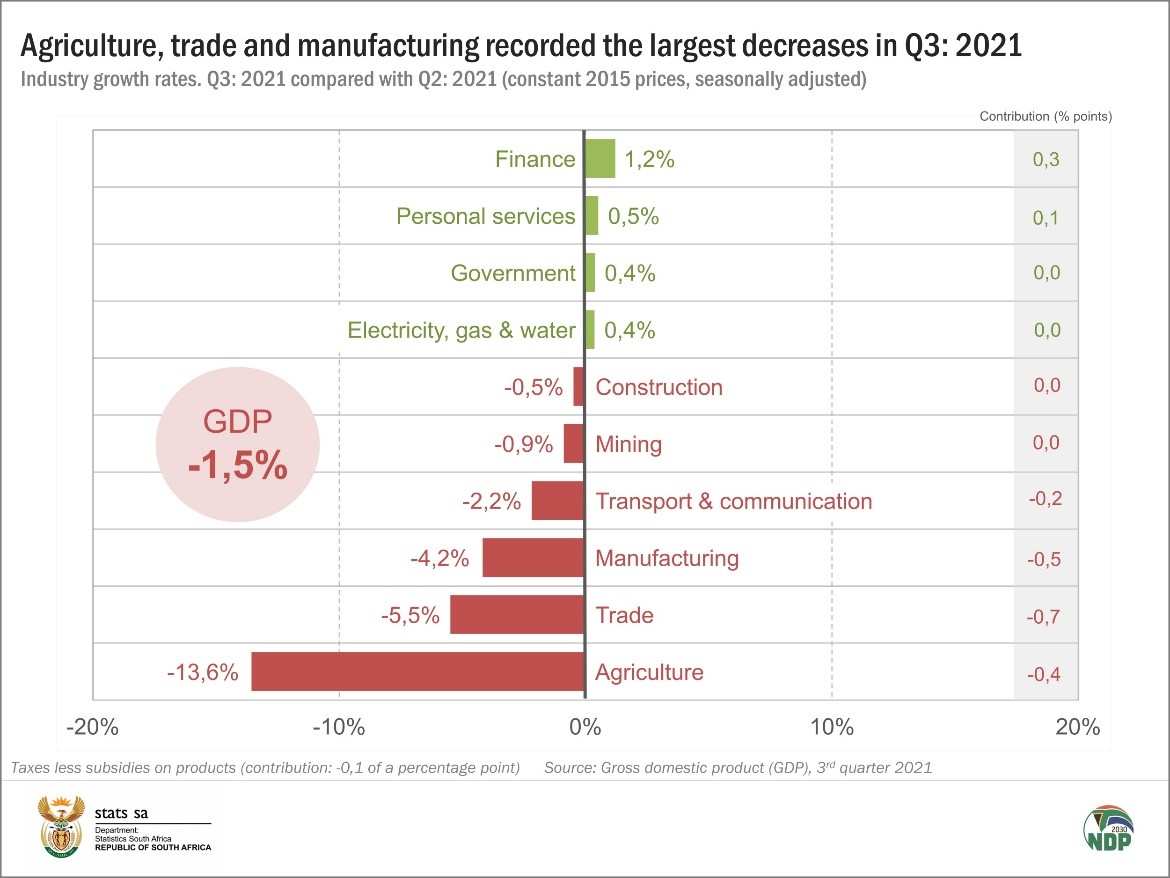
The trade industry shrank by 5,5%, with all trade sectors reporting losses. Wholesale, retail and motor trade were negatively affected by the widespread looting and destruction that gripped KwaZulu-Natal as well as Gauteng. Retail businesses were the most affected.
A cyberattack that disrupted operations at South African ports dealt a further blow to motor trade. In response to the rapid spread of the COVID-19 Delta variant, the country was on Alert Level 4 lockdown from 28 June to 25 July. This stymied growth in the tourist accommodation sector, as well as constricting restaurant and catering trade.
The manufacturing industry declined by 4,2%, dragged lower in the main by the civil disorder and global shortages of raw materials.
The transport and communications industry didn’t escape unscathed. Road freight transport into and out of KwaZulu-Natal was severely disrupted by the violence. Several domestic airlines recorded flight cancellations following leisure travel restrictions imposed by the Alert Level 4 lockdown.
Four industries managed to keep their heads above water. The finance industry increased economic activity by 1,2%. Personal services saw an uptick in economic activity on the back of increased spending on private healthcare and the roll-out of COVID-19 vaccines for those aged between 18 and 35 years. General government expanded by 0,4%, attributed to a rise in employment in local government and extra-budgetary accounts and funds.
Household spending and exports drive down expenditure on GDP
Stats SA also measures the expenditure side of GDP, providing an indication of total demand in the economy. This includes measures of household expenditure, government expenditure, investment (gross fixed capital formation and changes in inventories), and net exports.
Household final consumption expenditure decreased by 2,4%. The looting and closure of retailers in KwaZulu-Natal during the civil disorder resulted in food shortages. Many consumers struggled to buy basic supplies.
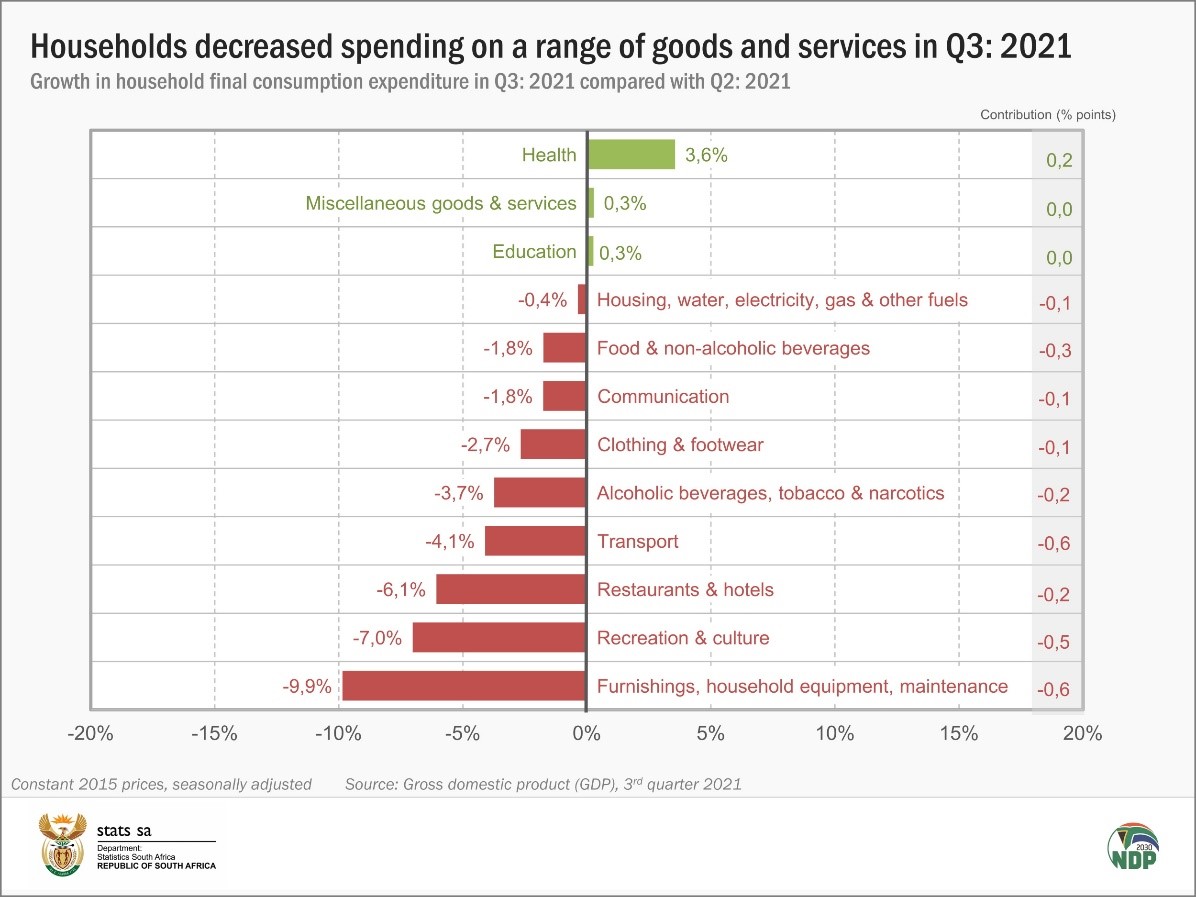
The Adjusted Level 4 lockdown restricted trading hours and limited restaurant activity. Declines in fuel sales and a decrease in the trade of furniture and appliances also contributed negatively to household expenditure growth.
Exports decreased by 5,9%. Shortages in parts disrupted the production and export of motor vehicles. The civil disorder in July also had an impact on manufacturers who struggled to transport goods to the Durban port.
For more information, download the Q3: 2021 GDP release and media presentation here.
1 Unless otherwise stated, growth rates are quarter-on-quarter, seasonally adjusted and in real (volume) terms. This is Stats SA’s second GDP release after the completion of its latest benchmarking and rebasing exercise. More information on this exercise is available here. Note that Stats SA no longer uses the annualised rate as the headline growth rate.
Similar articles are available on the Stats SA website and can be accessed here.
For a monthly overview of economic indicators and infographics, catch the latest edition of the Stats Biz newsletter here.