
Tourism in South Africa: a pre-COVID-19 benchmark
The tourism sector: economic importance, employment and expenditure. These are the three themes covered by a recent report examining the pre-pandemic (2019) status of the South African tourism sector. These data will provide an important benchmark for when comparable COVID-19-era data (2020) become available.
The Tourism Satellite Account (TSA) for South Africa report, released annually, draws from a range of data sources, from national accounts to surveys of international and domestic visitors, visitor arrival statistics, tourist accommodation data, and figures from the restaurant, fast-food and catering industry. Together, these rich sources of data provide insight into the role that tourism plays in South Africa.
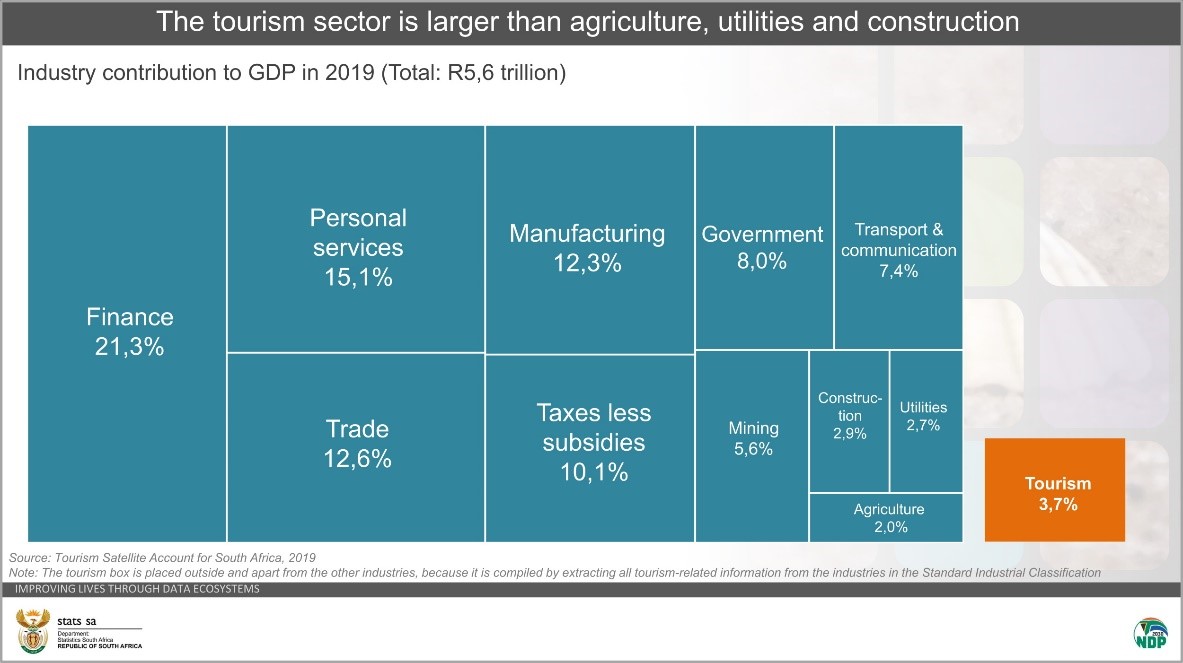
Economy: The tourism sector contributed 3,7% to GDP in 2019
Measured against other industries, the tourism sector is larger than agriculture, utilities (electricity, gas & water), and construction.1 Tourism activities and their associated tourism expenditure directly contributed R209 billion to the national economy in 2019.
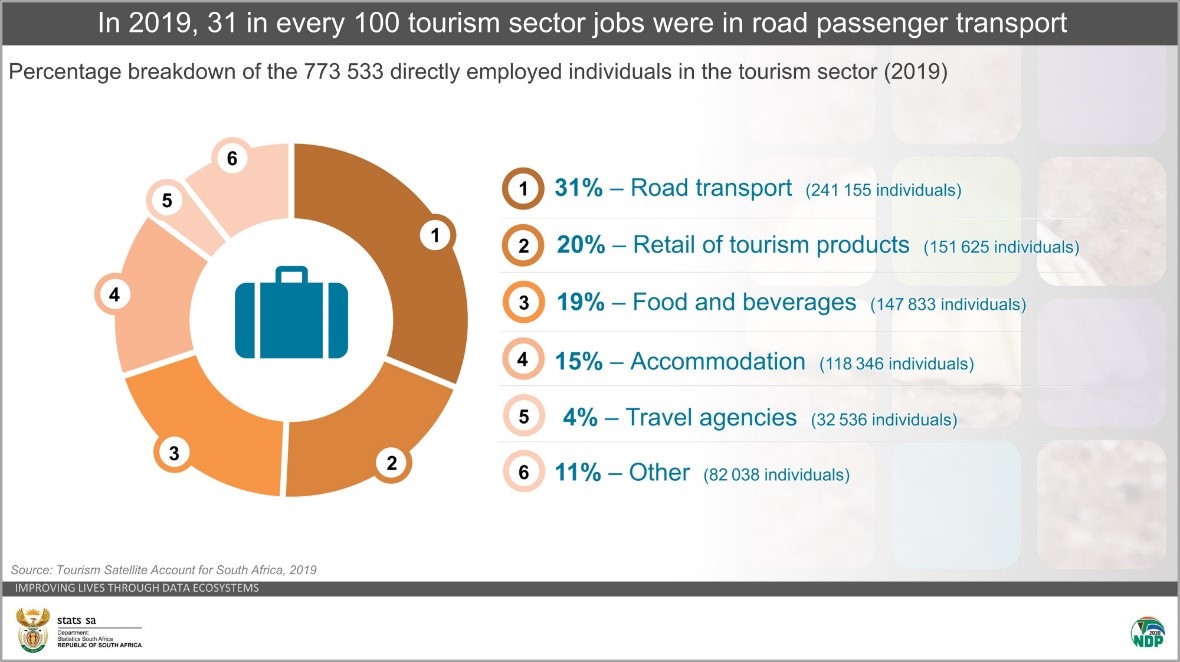
Employment: Tourism directly employed 4,7% of the total workforce
Tourism employed 773 533 people in the formal sector in 2019, which translates to about 1 in every 21 employed individuals.

Within tourism, the biggest contributor to direct employment was road passenger transport, accounting for almost a third of all jobs within the sector. Road passenger transport mainly includes activities related to taxis and buses that ferry domestic and non-resident visitors along and across the length and breadth of the country.
Expenditure: The spending habits of visitors
Jobs in the tourism sector depend on a steady stream of visitors2 and their related tourism expenditure. Internal (non-resident and domestic) visitors spent R451,5 billion in 2019, providing much needed money for the industry.
Domestic visitors accounted for the largest chunk of internal tourism expenditure, contributing 73% of the R451,5 billion. Non-resident visitors exploring our shores accounted for 27%.
Non-resident and domestic visitors spend their money in different ways within the domestic tourism sector. The biggest expenditure items on domestic visitors’ travel budget in 2019 were non-specific products, road passenger transport and air passenger transport.
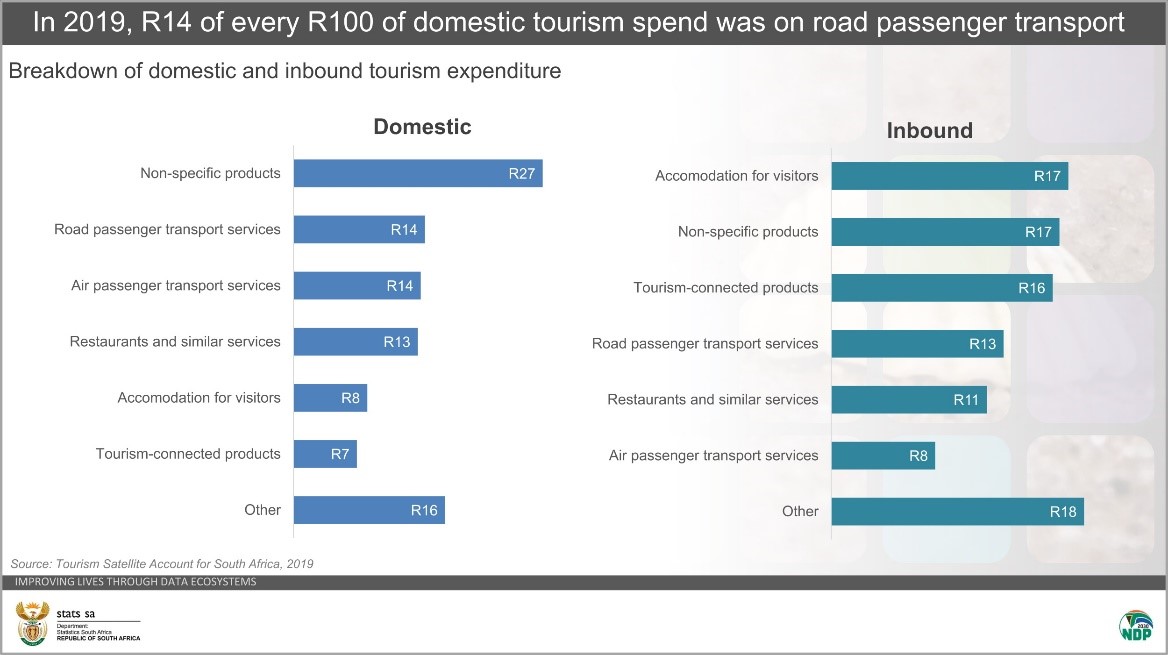
The top three expenditure items for non-resident visitors (i.e. inbound tourism expenditure) in 2019 were accommodation services for visitors, tourism non-specific products and tourism-connected products.
What are non-specific and tourism-connected products? The TSA categorises products into three general categories. Tourism-characteristic products (the first category) are those products that – if visitors suddenly stopped travelling – would cease to exist in a meaningful quantity, or whose consumption would be significantly reduced. A product is listed as a tourism-characteristic product if at least 25% of total domestic supply is purchased by visitors. A few of these are individually listed in the graphic above (e.g. accommodation for visitors, road passenger transport services, etc.)
Tourism-connected products (the second category) are products that are generally less orientated towards tourism. A tourism-connected product is distinct from a tourism-characteristic product in that visitors consume a smaller proportion (less than 25%) of domestic supply. These include general retail or “shopping” products, such as food, drink, clothing, and fuel.
Non-specific products (the third category) include all other products that are not tourism specific and of which only a very small portion of domestic supply is consumed by visitors (1,1% in 2019).
Additional facts from the report
- The year 2019 saw 14,8 million non-resident visitors gracing South African shores, down from 15,0 million in 2018. Of the 14,8 million, 31% were same-day visitors and 69% were tourists.
- Inbound tourism expenditure increased by 1,2% to R121,5 billion in 2019 compared with 2018.
- Outbound tourism expenditure increased by 1,3% to R84,8 billion in 2019 compared with 2018.
- South Africa had a positive tourism trade balance with the rest of the world in 2019 (R36,7 billion).
- Domestic tourism expenditure increased by 71,0% to R330 billion in 2019 compared with 2018.
Tourism remains a vital cog in the South African economy, providing a livelihood for thousands of people. There is no doubt that the COVID-19 pandemic in 2020 and 2021 has had an impact on the tourism sector. The next release of the TSA will cover data for the year 2020. So watch this space!
On a technical note
The TSA is highly integrated with the surveys and related data sources on which it depends, including the national accounts. Since the release of the TSA 2018 figures in November 2019, there have been revisions and methodological changes to the source data. In particular, Stats SA rebased and benchmarked gross domestic product (GDP) estimates, resulting in a revision of the entire GDP-related time series. As part of the exercise, new supply and use tables (SUTs) time series were also developed. These changes have carried through to the TSA.
For more information, download the Tourism Satellite Account for South Africa, 2019 report here.
1 In the industry contribution diagrams, the tourism box is placed outside and apart from the other industries, because it is compiled by extracting all tourism-related information from the industries in the Standard Industrial Classification.
2 A visitor is a traveller who takes a trip to a place outside their usual environment, for less than a year, for any purpose other than to be employed at the place visited. A visitor can either be a same-day visitor, who visits a place for less than one night, or a tourist, whose trip includes an overnight stay.