
An overview of government spending
Total South African government spending flirted with the R2 trillion mark in the 2019/20 financial year, according to data published by Stats SA.
The data, recently published in the Financial statistics of consolidated general government statistical release, covers the period before the COVID-19 pandemic, providing a benchmark for when comparable pandemic-era data become available.
The South African government spent R1,97 trillion in 2019/20, representing a 10% rise from the R1,79 trillion recorded in 2018/19.1 The release consolidates data from various other surveys published during the year, covering 707 institutions that include national and provincial government departments, municipalities, extra-budgetary accounts and funds, and higher education institutions.
General public services, education and social protection the biggest spending items
The graphic below (Figure 1) illustrates what government spent money on in 2019/20. The bubbles represent functions, and the larger the size of the bubble, the higher the expenditure on the function.
General government’s biggest expenditure items in 2019/20 were general public services, education and social protection. Together, these three items accounted for almost 60% of total spending (click on the image to enlarge).
Figure 1: South African general government expenditure (2019/20)
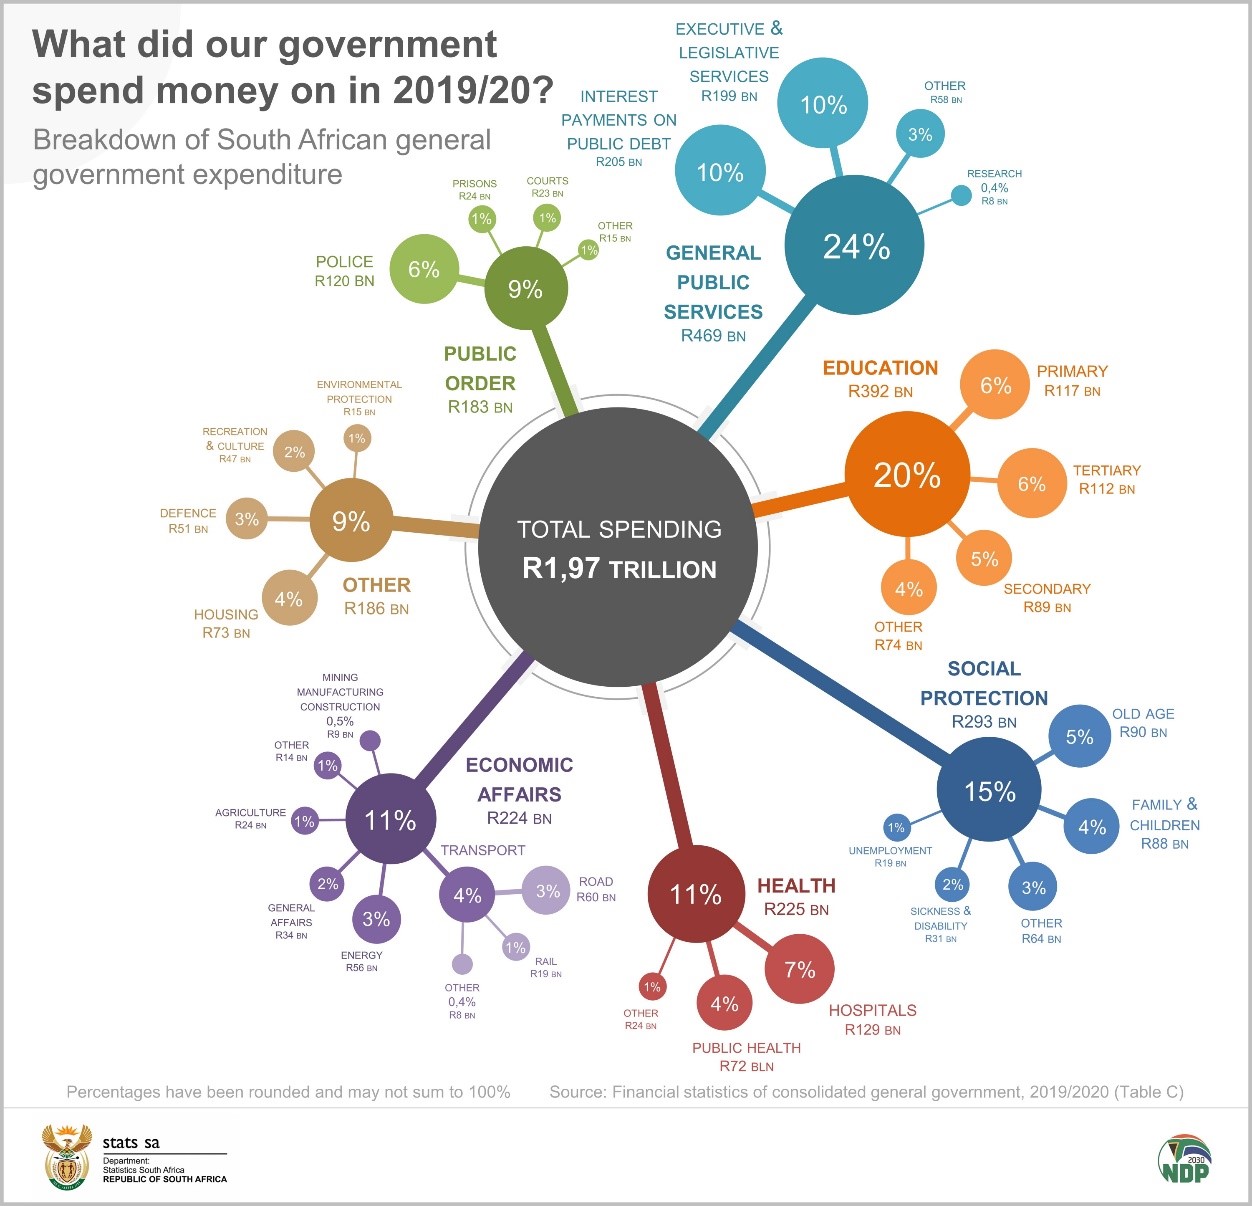
Looking at the very top of the graphic, you might wonder what the smaller bubble of executive and legislative services entails. This is a sizable function that accounted for R199 billion (or 10%) of total spending. Executive and legislative services include costs mainly related to the administration of parliament, the provincial legislatures and mayoral offices.
Just to the left of this component is interest payments on public debt. In 2019/20, South Africa owed almost R3,2 trillion in gross loan debt, according to National Treasury, giving rise to substantial interest payments.2 Figure 1 shows that interest payments accounted for 10% (or R205 billion) of total expenditure. This is more than what government spent on public order (police, prisons and courts), and about the same as the expenditure on primary and secondary education combined.
Eskom, social grants and debt payments the biggest cost drivers in 2019/20
Government spent an additional R182,8 billion in 2019/20 compared with 2018/19. The matrix below breaks this down and provides a snapshot of what drove spending higher (in red) and what government spent less money on (in blue).
Figure 2: Change in government expenditure by government institution and function
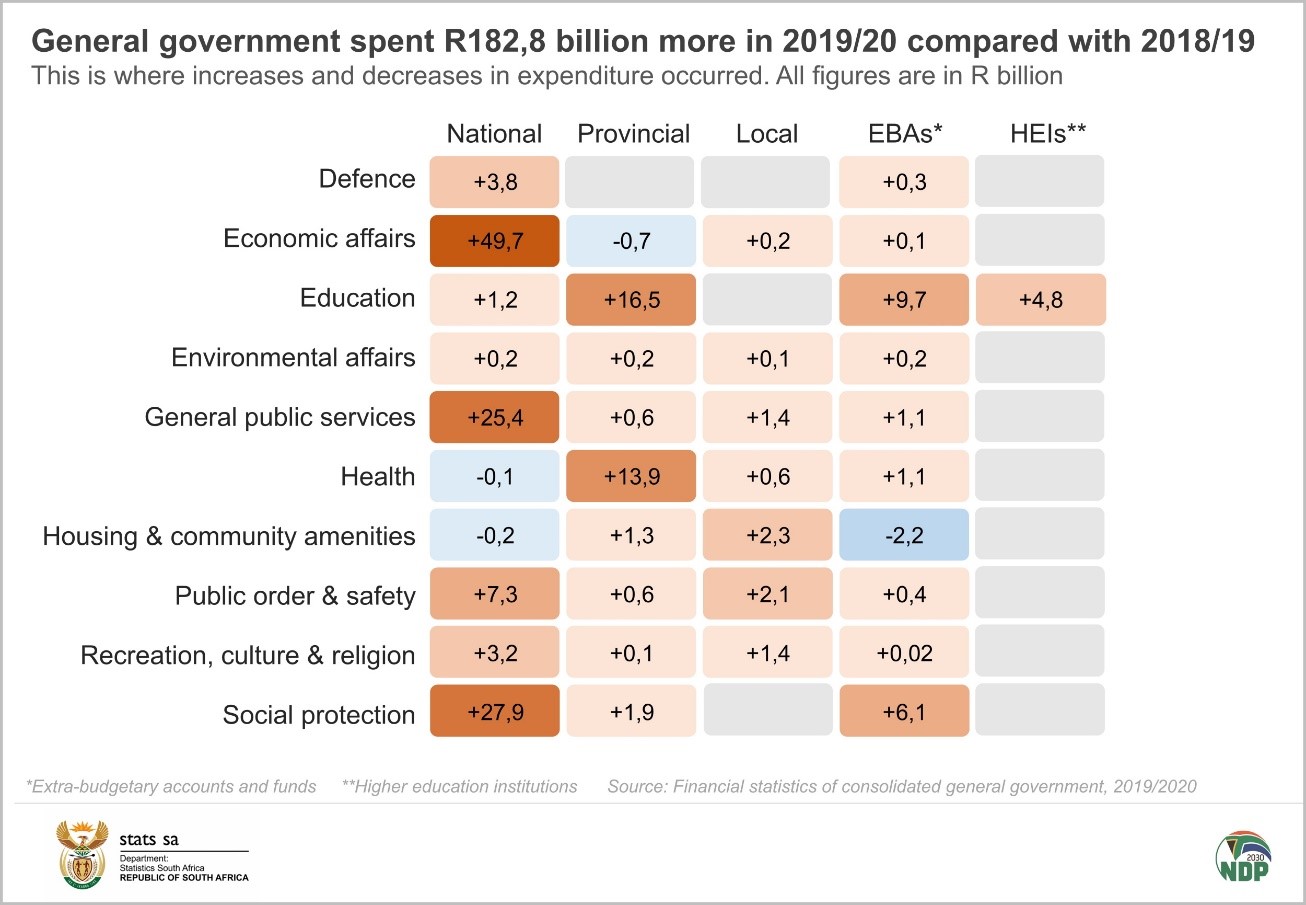
Economic affairs was the most significant factor that pushed overall government spending higher in 2019/20. National government expenditure on economic affairs jumped by R49,7 billion. A large capital transfer from the Department of Public Enterprises to Eskom was a significant contributor to this rise.
General public services under national government increased by R25,4 billion. This was mainly due to a rise in interest payments on public debt (up by R22,9 billion or 12,6%).
Provincial government increased spending on education by R16,5 billion, driven largely by spending on educational services by Gauteng and KwaZulu-Natal.
The Water Trading Entity recorded a decline in operating expenditure in 2019/20, contributing to the R2,2 billion decrease listed under extra-budgetary accounts and funds (housing and community amenities).
For more information, download the Financial statistics of consolidated general government statistical release and time series data here.
1 When interpreting these figures, note that the data published in the Financial statistics of consolidated general government statistical release (a) are adjusted for the reference period 1 April – 31 March and (b) in order to compare across all levels of government, data were converted from an accrual basis of recording to a cash basis of recording.
2 National Treasury. 2020 Budget Review, Table 10 (view here).