
A deep dive into the price of fuel
Note: The original version of this article, published on 1 December 2021, was based on fuel price adjustments announced by the Department of Mineral Resources and Energy (DMRE) on 29 November. On 1 December, the DMRE made changes to these adjustments. This article was revised on 2 December 2021 to reflect these changes.
Fuel prices hit a record high this December. Stats SA provides a breakdown of what you are paying at the pump, where this money is going, and the impact on consumer inflation.
Petrol price: one-third goes to levies and taxes
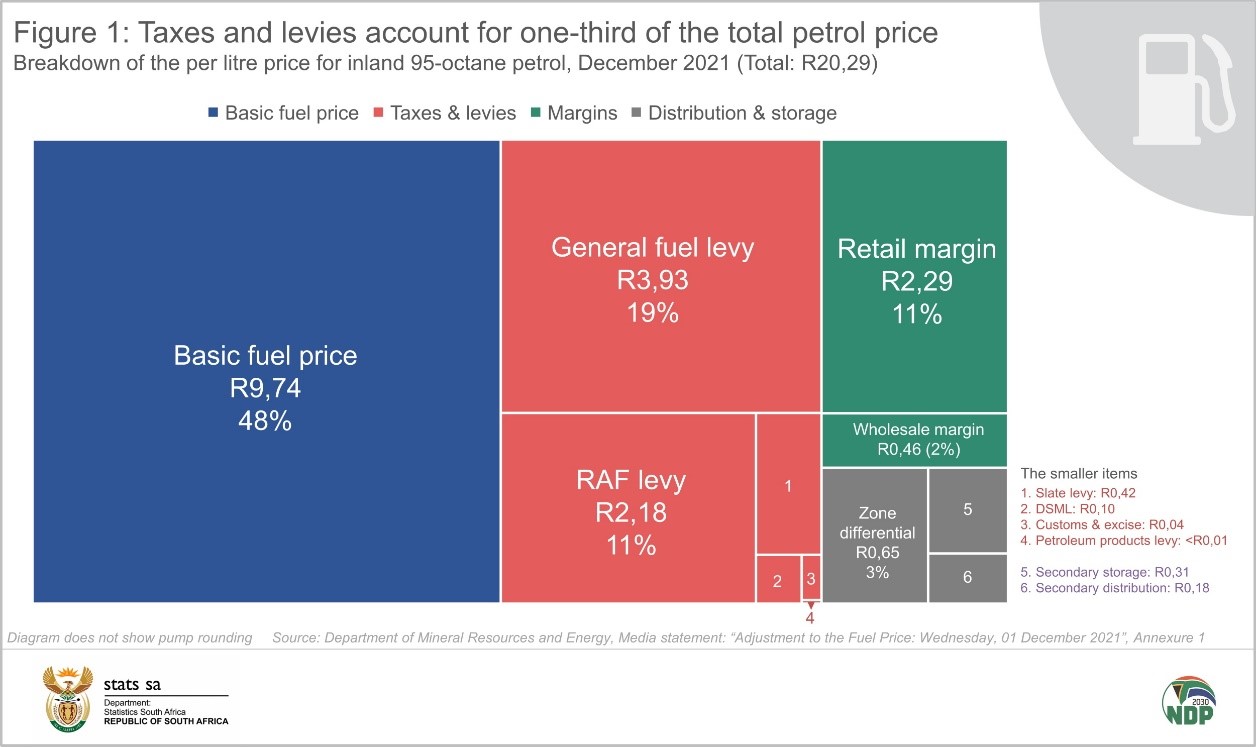
Trying to make sense of all the elements that make up the fuel price can be quite daunting. There are up to 13 different charges, depending on the type of fuel and where you happen to live. Currently, the price for inland 95-octane petrol stands at R20,29 per litre (December 2021). According to the Department of Mineral Resources and Energy1, this price consists of these four broad elements:
- Basic fuel price: R9,74 (48%)
- Taxes and levies: R6,67 (33%)
- Retail and wholesale margins: R2,74 (14%)
- Storage and distribution costs: R1,14 (6%).
The basic fuel price is related to the costs of purchasing petroleum products from international markets, and the costs related to shipping these products to South Africa. This cost is largely influenced by the international price of crude oil and the R/$ exchange rate.
All other elements making up the petrol price are local in nature. These include taxes, levies, margins, and storage and distribution costs (Figure 1).2
Steaming ahead: the rise in the RAF levy
The two biggest levies are the general fuel levy and the Road Accident Fund (RAF) levy. The general fuel levy is a tax on each litre of fuel. The RAF levy is a source of revenue for the RAF that is responsible for compensating victims of motor vehicle accidents.
What is immediately evident from the time series chart below (Figure 2) is that the basic fuel price fluctuates more than the general fuel levy and RAF levy. This is because the basic fuel price is set every month by the Department of Mineral Resources and Energy. Changes to the general fuel levy and RAF levy are announced once a year during the National Budget Speech (click on the image to enlarge).
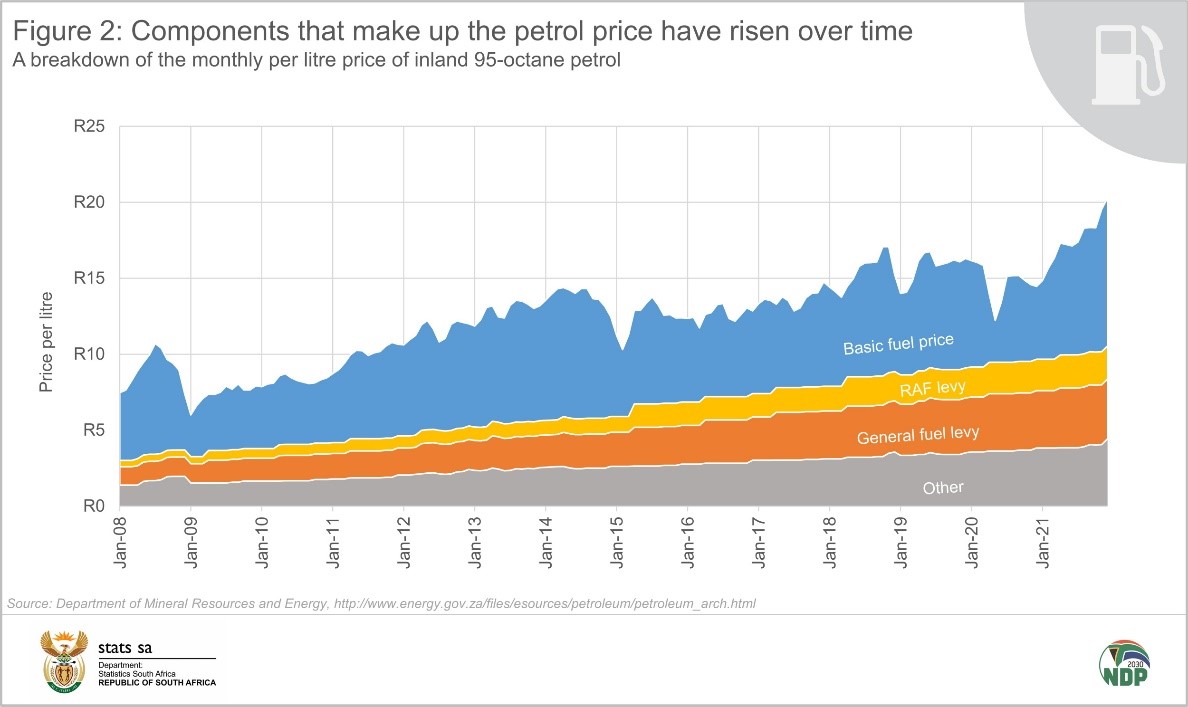
Figure 2 also shows that all components have increased over time. To get a better idea of which components increased faster, Figure 3 shows how the components have increased relative to one other.
The RAF levy has increased by 425% since January 2008, outpacing the general fuel levy (up 225%) and the basic fuel price (up 119%).
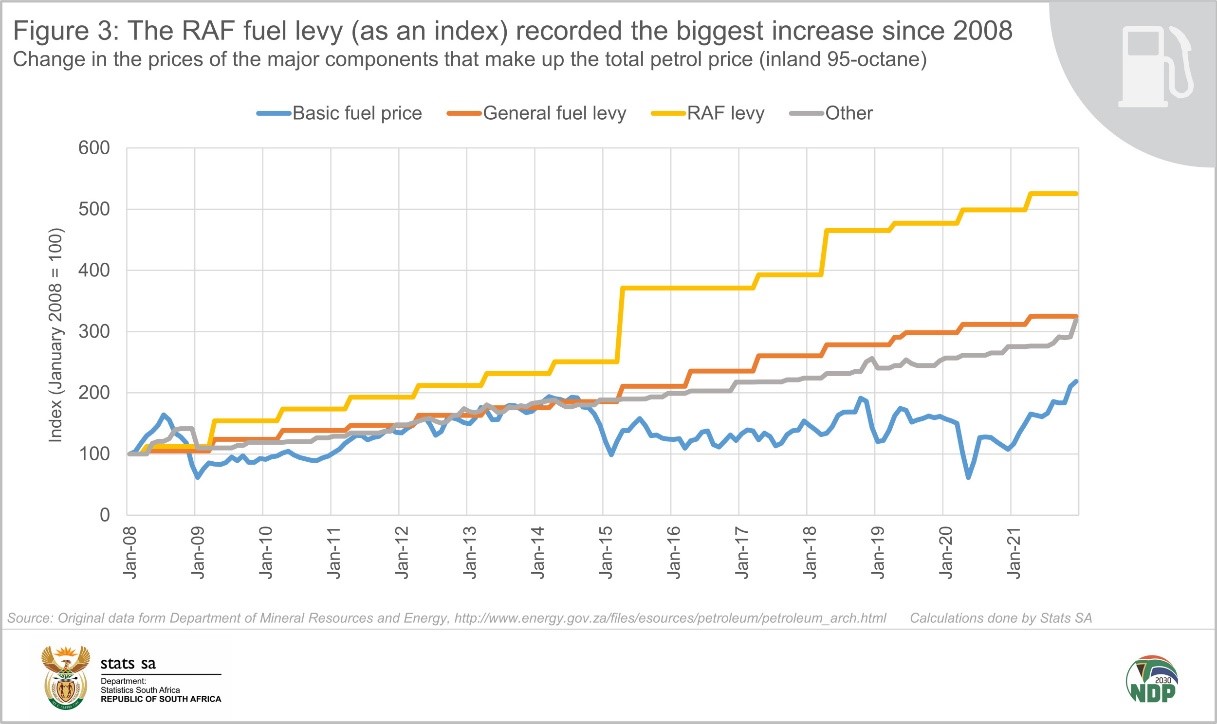
Notice the jump in the RAF levy in April 2015. Following an announcement by the Minister of Finance that February, the levy was increased by 50c (up 48%) on 1 April, jumping from R1,04 to R1,54.3 This higher than usual increase was partly mitigated in 2016 when no increase was announced. The other big rise was in April 2018, when the RAF levy was increased by 30c, from R1,63 to R1,93.4
Where do these levies go?
The RAF levy currently stands at R2,18 per litre of petrol. In the 2019/20 fiscal year, the levy generated R41,2 billion for the RAF. The levy is the Fund’s primary means of income, accounting for 99,8% of total revenue. According to the RAF’s annual report5, 93% of the income from the levy was used to pay claims. A total of 304 962 payments were made in 2019/20.
The general fuel levy generated R80 billion for government in 2019/20, accounting for about 6% of total tax revenue.6 It’s not the biggest source of revenue for government, but it brings in more money than customs duties or alcohol and tobacco excise duties.
Money from the general fuel levy flows into the National Revenue Fund together with revenue from all other taxes. There is a portion of the general fuel levy that is specifically set aside and transferred to South Africa’s eight metropolitan municipalities. In 2019/20, this amounted to R13,2 billion.7
The impact on the value of fuel sales and inflation
An increase in the fuel price, whether from rising taxes or from an increase in the basic fuel price, has an impact on the economy. Fluctuating fuel prices show up in two of Stats SA’s datasets. Figure 4 shows how the value of fuel sales in the motor trade industry generally follows changes in the fuel price. Generally, a higher petrol price results in a rise in the value of sales.
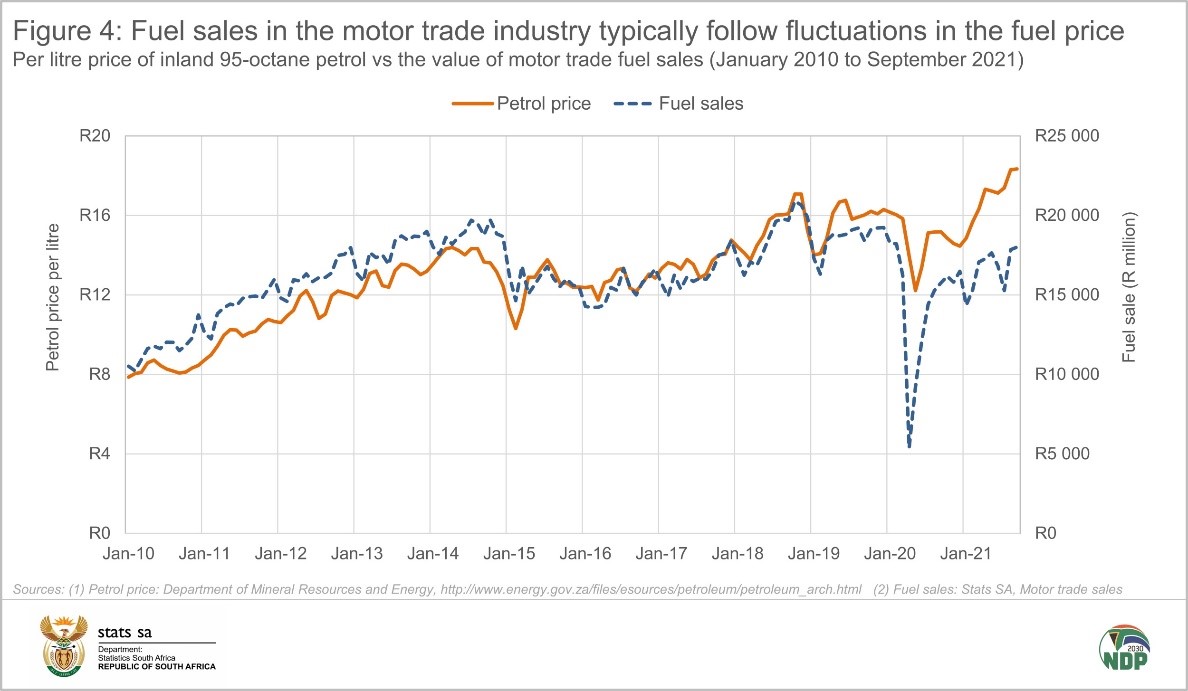
The steep fall in fuel sales in April 2020 was the result of lower fuel prices as well as a sharp drop in economic activity related to COVID-19. In the third quarter of 2021, the motor trade industry generated R51,1 billion from fuel sales, a 12,5% rise from R45,4 billion recorded in the third quarter of 2020.8
Higher fuel prices place upward pressure on consumer inflation. Figure 5 compares overall consumer inflation (blue line) with what inflation would have been if the direct influence of fuel was removed (orange line).9 Those periods where the orange line does not closely follow the blue line indicate the noticeable impact of changing fuel prices on overall inflation.
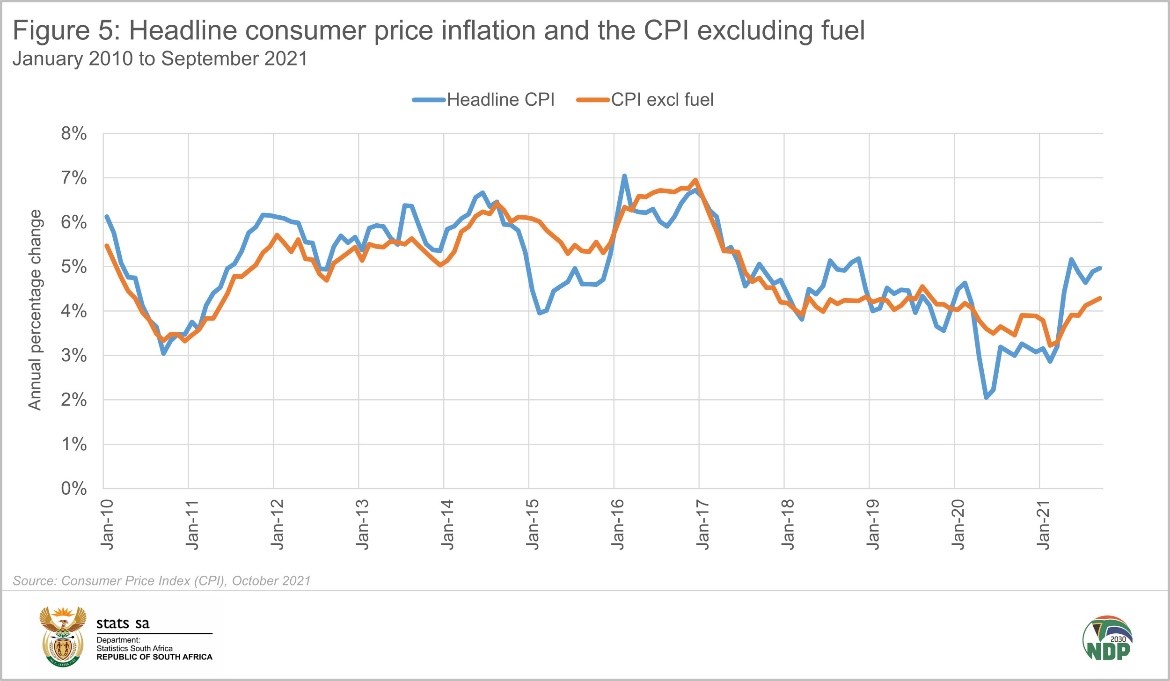
For example, in 2017, the CPI excluding fuel curve follows the headline rate, indicating a subdued impact from fuel prices. In contrast, consumer inflation increased noticeably in 2018 without a similar rise in the CPI excluding fuel curve. That year saw major increases in fuel prices (Figure 4) that bit significantly into the pockets of motorists.
During the early days of the COVID-19 pandemic in 2020, tumbling fuel prices contributed significantly to the fall in overall inflation in May that year, pushing the headline rate to its lowest reading since September 2004. The CPI excluding fuel line has lagged behind the headline rate in 2021, indicating the influence of rising fuel prices on consumer price inflation.
1 Department of Mineral Resources and Energy. Petrol price archive (click here).
2 Department of Mineral Resources and Energy. Adjustment to the Fuel Price: Wednesday, 01 December 2021. Annexure 1 (click here).
3 National Treasury. National Budget Speech 2015, page 21 (click here).
4 National Treasury. National Budget Speech 2018, page 11 (click here).
5 Road Accident Fund. Annual Report, 2020, page 19 (click here).
6 National Treasury. Section 32 Tables, Table 1 (click here).
7 National Treasury. 2021 Medium term budget policy statement, Table 4.6 (click here).
8 Stats SA. Motor trade sales, September 2021. Table B (click here).
9 Stats SA. Consumer Price Index (CPI), October 2021 (click here).
Similar articles are available on the Stats SA website and can be accessed here.
For a monthly overview of economic indicators and infographics, catch the latest edition of the Stats Biz newsletter here.