
The decline in public-sector infrastructure spending
A simple picture can tell a striking story. The bell-shaped chart below shows the rise and subsequent decline of South African public-sector infrastructure investment.
Capital expenditure represents the money that is spent on construction, machinery, equipment, land, buildings and other fixed assets. This form of investment has an impact on communication, travel, logistics and the provision of services.
What is notable about Figure 1 is that public-sector capital expenditure has steadily waned since 2016, declining by R82 billion. This represents a decrease of 29%, according to Stats SA’s latest Capital expenditure by the public sector report.
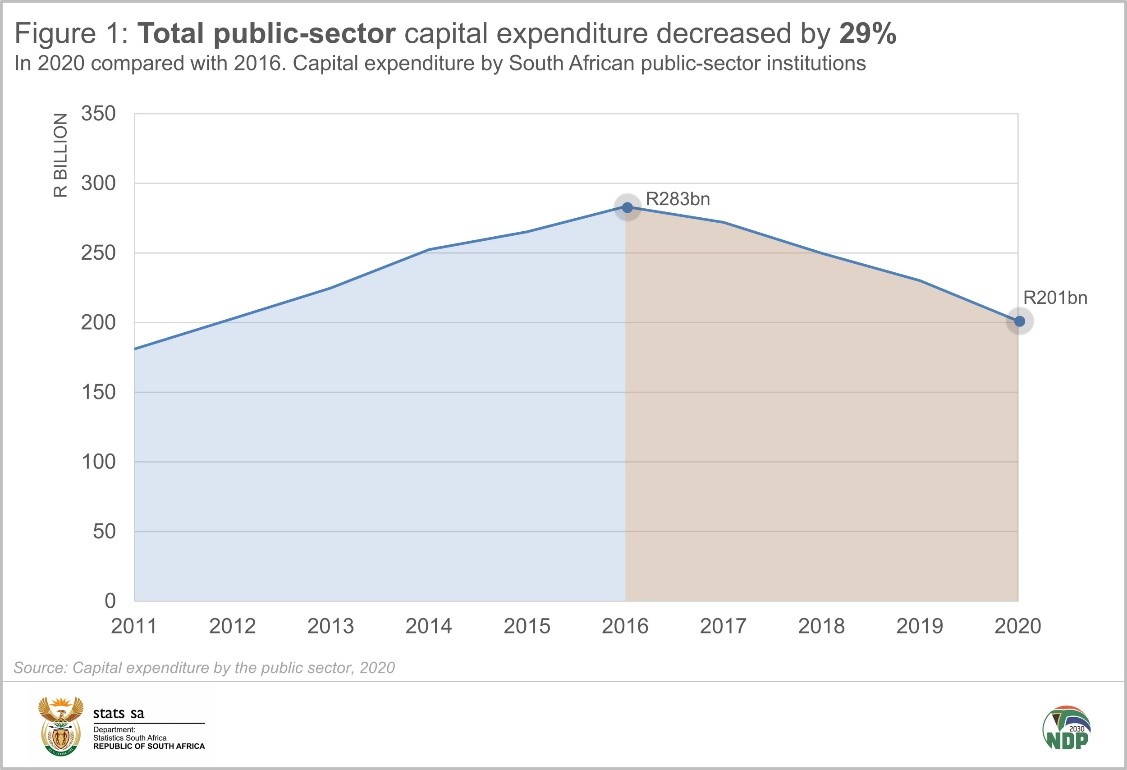
Public-sector institutions spent about the same amount of money on fixed assets in 2020 than they did in 2012.
There are 752 institutions in the public sector. These include public corporations, national and provincial government departments, municipalities, extra-budgetary accounts and funds (EBAs), and higher education institutions. In 2020, public corporations accounted for the bulk of public-sector capital expenditure (38%), followed by municipalities (27%) and provincial government (16%). Higher education institutions contributed the least (3%).
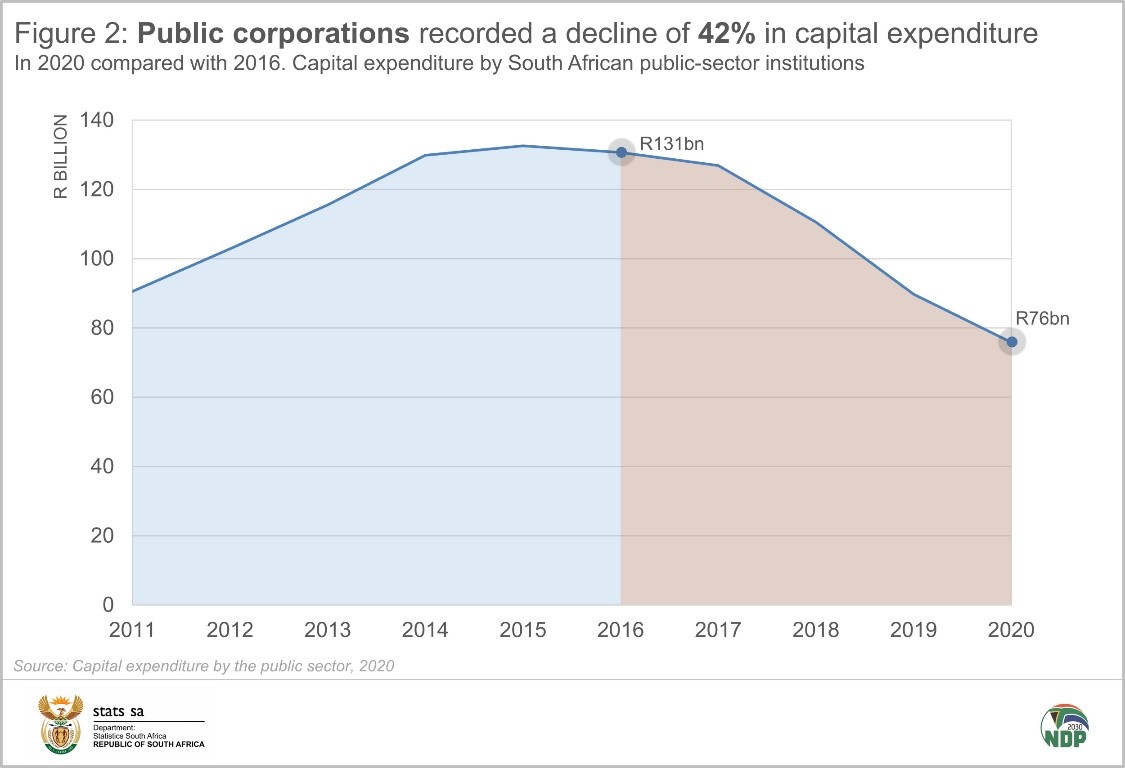
The time series chart for public corporations (Figure 2) follows a similar shaped curve, with capital expenditure declining by 42% since 2016. Public corporations curtailed their spending from R90 billion in 2019 to R76 billion in 2020. The decline in 2020 was largely attributed to Eskom that reduced spending across all capital expenditure types.
After recording a brief recovery in 2019, local government capital expenditure declined in 2020 (Figure 3) as municipalities reduced their spending on construction, plant & machinery, and leased assets. According to the data, 148 of South Africa’s 257 municipalities cut back on capital expenditure in 2020.

Municipalities provided various reasons for the decrease in 2020. A number of municipalities indicated that they had spent less due to the completion of large-scale construction projects that were active in 2019. On the more concerning side, other municipalities indicated that the decrease in capital expenditure was the result of project delays related to a range of issues, such as procurement delays, the COVID-19 pandemic and protest action.
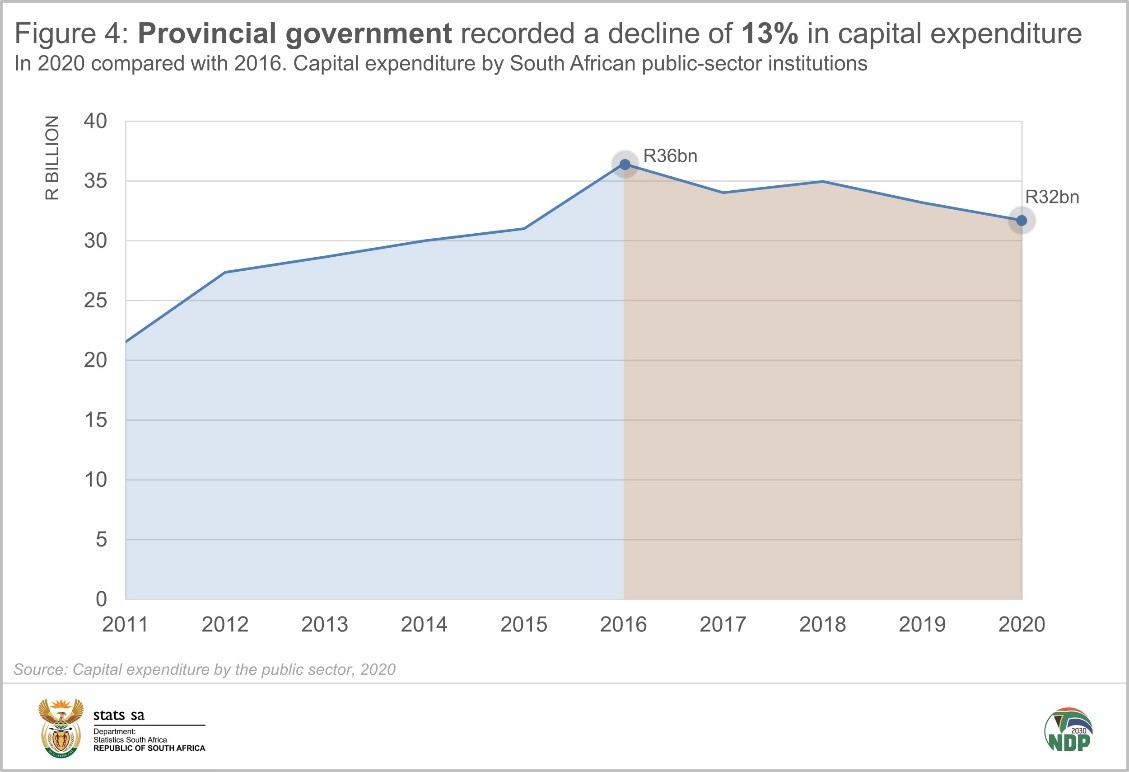
South Africa’s provincial government departments recorded a 13% decrease in capital expenditure in the 2016–2020 period (Figure 4). The KwaZulu-Natal Department of Transport recorded the biggest decline in capital expenditure in 2020 as the entity scaled back on new construction projects.
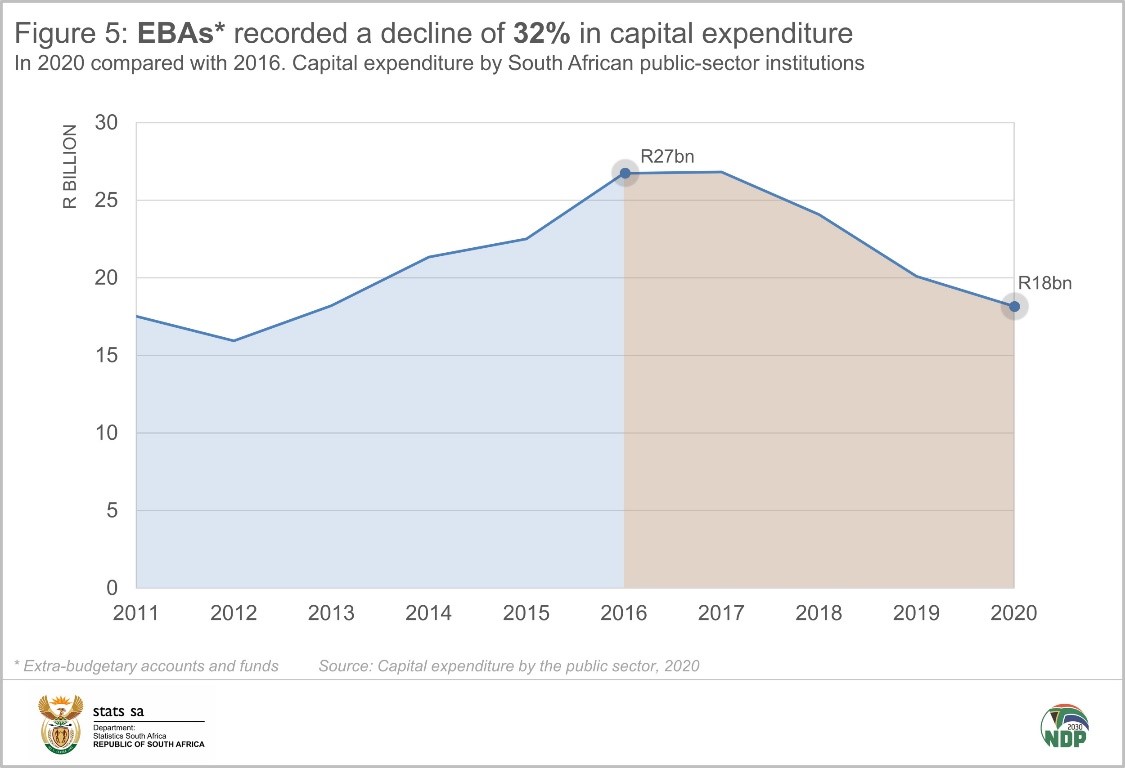
Since 2016, EBAs have registered a 32% fall in capital expenditure (Figure 5). In 2020, capital expenditure declined by R1,9 billion compared with 2019. The South African National Roads Agency (SANRAL) was the major contributor to this decrease. The entity recorded a decline of R2,1 billion as it scaled back on new construction works.
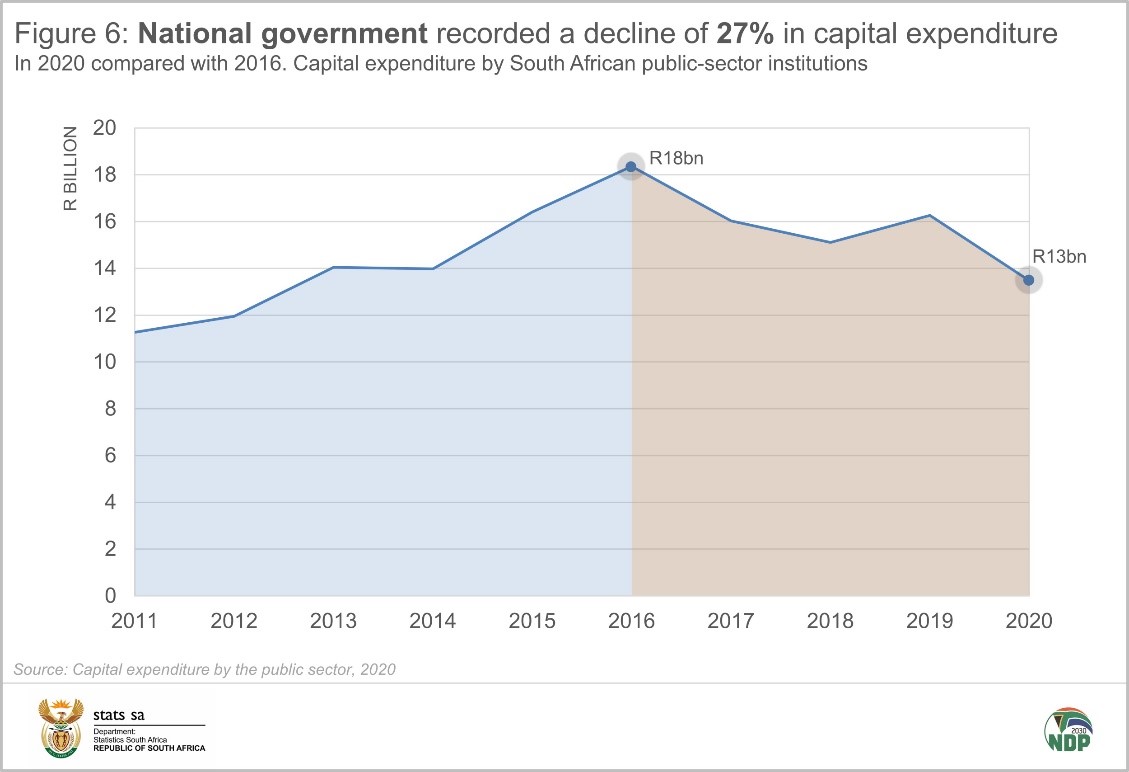
National government departments registered a 27% decrease in the 2016–2020 period (Figure 6). The sharp decline in 2020 was largely a result of decreased spending by the National Department of Water Affairs.
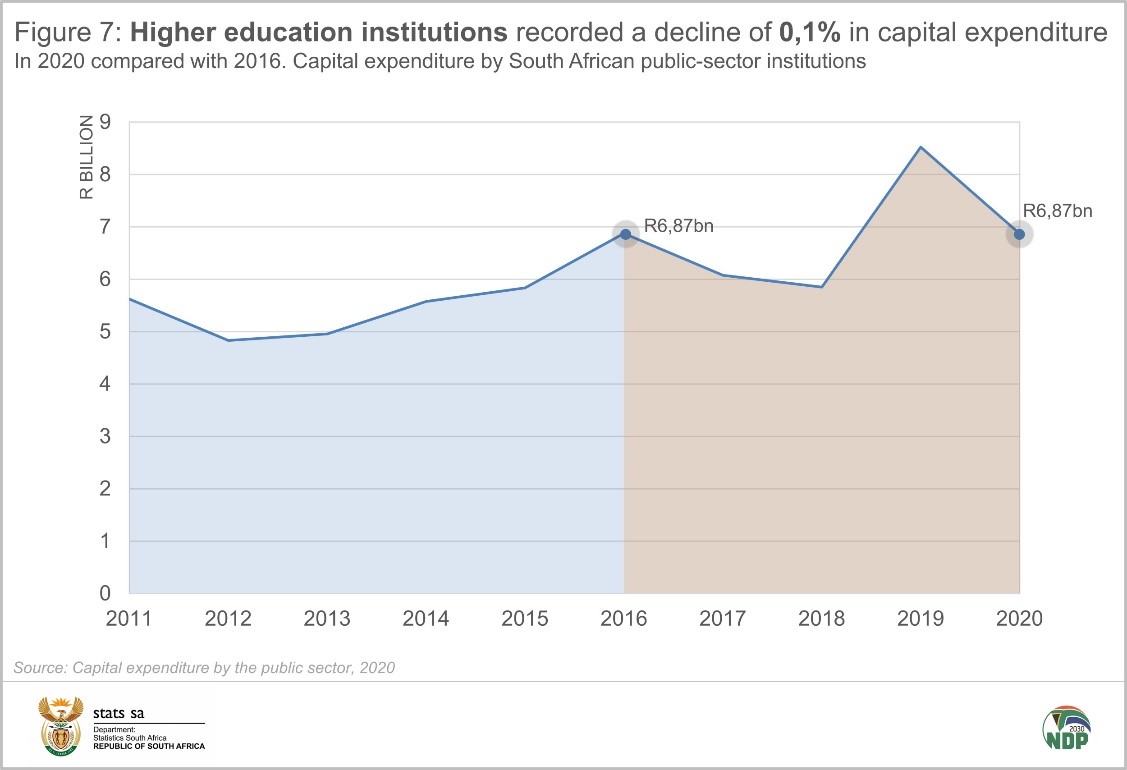
South Africa’s higher education institutions spent less on fixed assets in 2020 compared with 2016, but only by a marginal -0,1% (Figure 7). In 2020, however, higher education institutions recorded a sharp decline of R1,7 billion. The Vaal University of Technology was a major contributor to this fall, recording a decrease in spending on leased assets.
For more information, download the Capital expenditure by the public sector, 2020 report and unit data here.
Similar articles are available on the Stats SA website and can be accessed here.
For a monthly overview of economic indicators and infographics, catch the latest edition of the Stats Biz newsletter here.