
A decline in tuition fees dents higher education revenue
The COVID-19 pandemic and subsequent lockdown restrictions in 2020 impacted the finances of higher education institutions. There was a subdued increase in revenue, stifled by a decline in the collection of tuition fees. Higher education institutions spent less money, largely on the back of lower operational costs.
Total revenue increased, but only marginally
The amount of revenue received or generated by South Africa’s 26 higher education institutions increased by 1,0% in 2020 compared with 2019, rising from R89 billion to R90 billion. This is according to the latest Financial statistics of higher education institutions report.1 This rise is far lower than the increases recorded in 2019 (7,4%), 2018 (12,5%) and 2017 (9,5%).
Higher education institutions receive the bulk of their revenue from government grants and tuition fees. Grants contributed R46 billion in 2020, a rise of 8,4% from R42 billion in 2019. Not to be confused with social grants, government grants are financial transfers across government entities. Higher education institutions receive funding in the form of grants from the Department of Higher Education and Training (DHET).
Grants contributed just over half of total revenue in 2020.
Revenue from tuition fees declined
In contrast to government grants, the amount of revenue collected in the form of tuition fees decreased in 2020 compared with 2019, from R29 billion to R28 billion. This is the first year since 2006 – when Stats SA started publishing this data series – that there has been a decline in the amount of tuition fees collected. In 2020, 18 of the 26 higher education institutions recorded a decrease.
The top four institutions that collect the most revenue in the form of tuition fees are shown in the chart below. Of the four, the University of South Africa, which is predominantly a distance-learning institution, is the only institution that recorded a jump in tuition fees in 2020. This rise was largely due to an increase in the number of students that enrolled that year.2
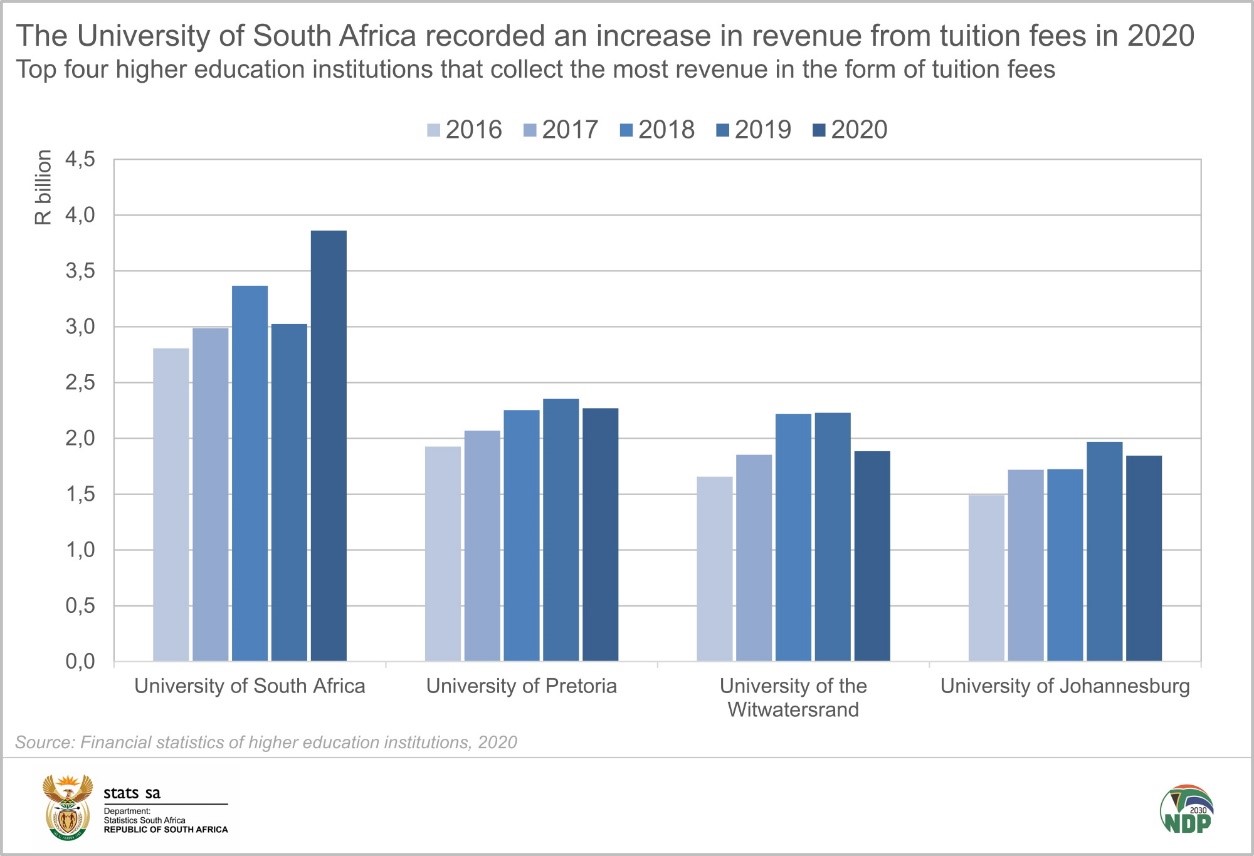
The other three institutions in the graph recorded a decrease in revenue collected from tuition fees in 2020, with declining accommodation revenue a common theme. The decline recorded by the University of Pretoria was mostly due to the university granting rebates to students on accommodation fees.3 The University of the Witwatersrand experienced a decrease in short course revenue, due to subdued demand, and a decline in revenue from accommodation.4
Operational costs were lower
In contrast to the rise in revenue, higher education spending was down, with expenses declining from R73 billion in 2019 to R70 billion in 2020. The biggest expenditure items on the budget in 2020 were compensation of employees and purchases of goods and services. Employee compensation increased by 4,7%, rising to R46 billion from R44 billion.
Purchases of goods and services decreased, however, falling by 20,8% (R24 billion to R19 billion). According to the data, 19 of the 26 institutions spent less on goods and services, largely due to lower operational costs related to travel, printing, telephone services, water, and electricity.
The chart below shows the top four institutions that spend the most on goods and services. All four institutions recorded a decline in expenses related to goods and services in 2020. The decrease recorded by the University of Pretoria was largely due to lower operating expenses on a range of items, such as printing, stationery, entertainment and travel.5
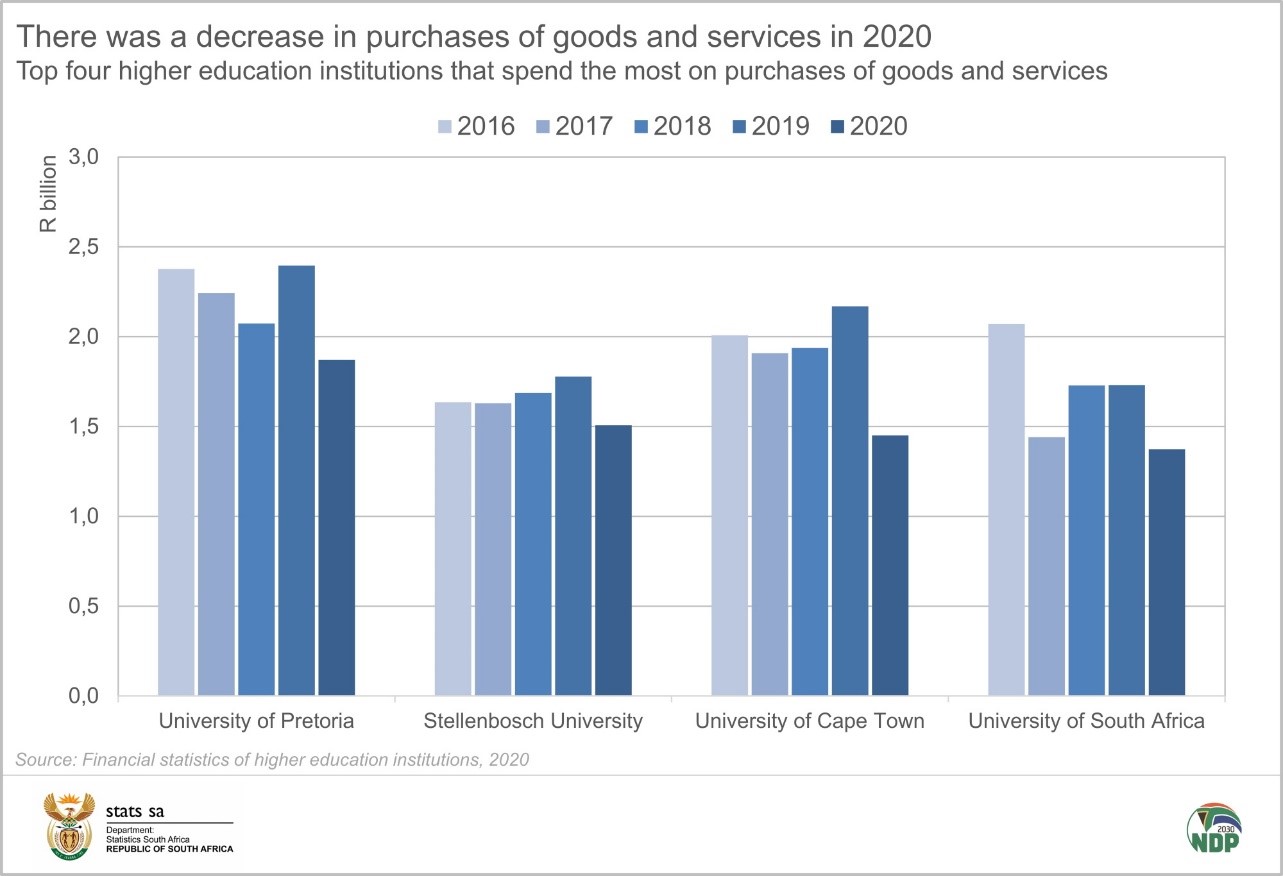
Stellenbosch University recorded a decrease in spending on travel, accommodation and utility costs6 while the University of Cape Town spent less on items such as travel, water and electricity.7 The University of South Africa recorded lower costs related to examinations (venue hire, printing and invigilators).8
For more information, download the Financial statistics of higher education institutions release here.
1 The report is based on data that comply with Government Finance Statistics 2014 principles, presented on a cash-flow basis.
2 University of South Africa, Annual Report 2020, page 39 (available here).
3 University of Pretoria, Annual Review 2020, page 61 (download here).
4 University of the Witwatersrand, Annual Report 2020, page 170 (download here).
5 University of Pretoria, Annual Review 2020, page 62 (download here).
6 Stellenbosch University, Annual Integrated Report 2020, page 49 (download here).
7 University of Cape Town, Annual Report 2020, page 162 (download here).
8 University of South Africa, Annual Report 2020, page 216 (available here).
Similar articles are available on the Stats SA website and can be accessed here.
For a monthly overview of economic indicators and infographics, catch the latest edition of the Stats Biz newsletter here.