Five facts about the electricity, gas & water supply industry (2019)
We are all keenly aware of the electricity challenges our country is facing. Here are five key facts from Stats SA’s latest report on the industry, covering data on the nation’s energy mix, electricity production, and employment.
The Electricity, gas and water supply industry report for 2019 covers the results of a large sample survey of the industry. This survey was conducted previously in 2006, 2010, 2013 and 2016.
- South Africa is generating less electricity
One eye-catching result from the report is that the industry produced less electricity in 2019 than it did in 2010, recording a decline of 2%.
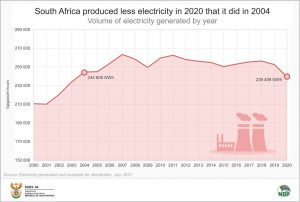
This is confirmed by the monthly Electricity generated and available for distribution release, which provides a more comprehensive time series. This release shows how national electricity production has slowed since 2018, with the country producing less electricity in 2020 than it did in 2004.
The latest figures from this release, for July 2021, show that the country generated 144 039 GWh of electricity in the first seven months of 2021. This is 5% more than what was generated in the first seven months of 2020, but 3% less compared with the same period in 2019.1
- The industry employs fewer people that it did in 2016
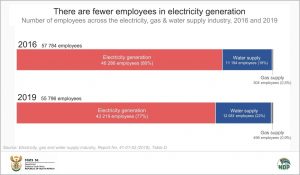
Turning our attention back to the Electricity, gas and water supply industry report for 2019, the industry recorded a net loss of 2 000 employees in 2019 compared with 2016. This decline occurred in electricity generation that saw its workforce shrink by just over 3 000 employees. Water and gas supply both recorded a rise in the number of employees over the same period.
Electricity, gas & water supply is one of two industries that recorded a decline in the number of jobs over this period. The other industry was construction, according to Stats SA’s Quarterly Employment Statistics (QES) survey.2
- Our energy mix is slowly shifting away from coal
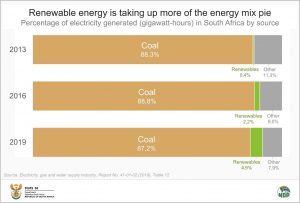
Eskom, South Africa’s dominant producer of electricity, recently announced an investment plan to transition away from coal and towards wind and solar power.3 Coal continues to dominate South Africa’s energy mix, but in recent years it has given some ground away to other energy sources.
Renewables (water, wind and sun) contributed 0,4% to the volume of electricity generated in 2013, rising to almost 5% in 2019.
Coal’s contribution edged lower over the same period, from 88,3% to 87,2%. If we go back further, coal’s contribution was 92,8% in 2006.
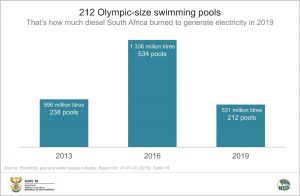
There is something notable about the energy mix data from the 2016 survey. That year, there was extensive use of diesel, highlighting the extent to which the county was relying on open cycle gas turbines at that time. South Africa used the equivalent of 238 Olympic-size pools of diesel in 2013, increasing to 534 Olympic-size pools in 2016. This decreased to 212 Olympic-size pools in 2019.
- Municipalities are the biggest customers
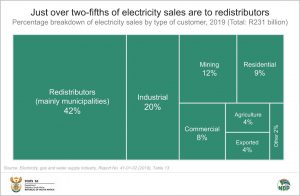
Redistributors of electricity were the biggest customers of electricity in 2019. Redistributors are enterprises that buy electricity from producers and then resell that power to their own customers, such as homes, businesses and other institutions.
- The industry recorded a financial loss in 2019
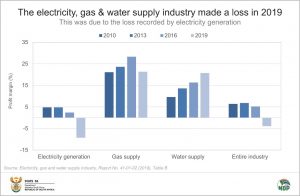
The profit margin for the electricity, gas & water supply industry was -3,9% in 2019, the lowest recorded in four of the survey years. The electricity generation sector recorded a loss of R21 billion that year, mainly due to a significant rise in depreciation and amortisation, as well as increased spending on interest. The gas supply sector recorded the highest profit margin in 2019 (21,3%).
For more information, download the report and media presentation for Electricity, gas and water supply industry, Report No. 41-01-02 (2019) here.
1 Stats SA, Electricity generated and available for distribution, July 2021 (available here).
2 Stats SA, Quarterly Employment Statistics (QES), March 2021.
‘QES Details_BreakDown_200909_202103’ Excel file (available here). The data for Q2: 2019 were compared with Q2: 2016.
3 News24, Eskom mulls spending R106 billion on wind and solar projects. 30 August 2021 (available here).


