
Municipal dependence on national government financing
What makes Stats SA’s Financial census of municipalities report so interesting is that it provides an idea of how financially dependent municipalities are on national government. The latest data show that the share of income that municipalities generate on their own has increased slightly since 2017, but there is more to this finding than meets the eye.
Municipalities generate or receive income from a variety of sources. These can be grouped into two broad categories: municipalities can either actively generate their own income (via property taxes, service charges, traffic fines, etc.)1 or, alternatively, other institutions can fund municipal revenue, either via government grants & subsidies (financial transfers from national government) or in the form of public donations and contributions.
The mix between these two sources can provide a rough measure of the extent to which a municipality depends on the state. A municipality that generates a high proportion of its own income can bode well for its financial sustainability. It can also free up financial resources that government can use elsewhere.
The national figure looks promising, but not too fast!
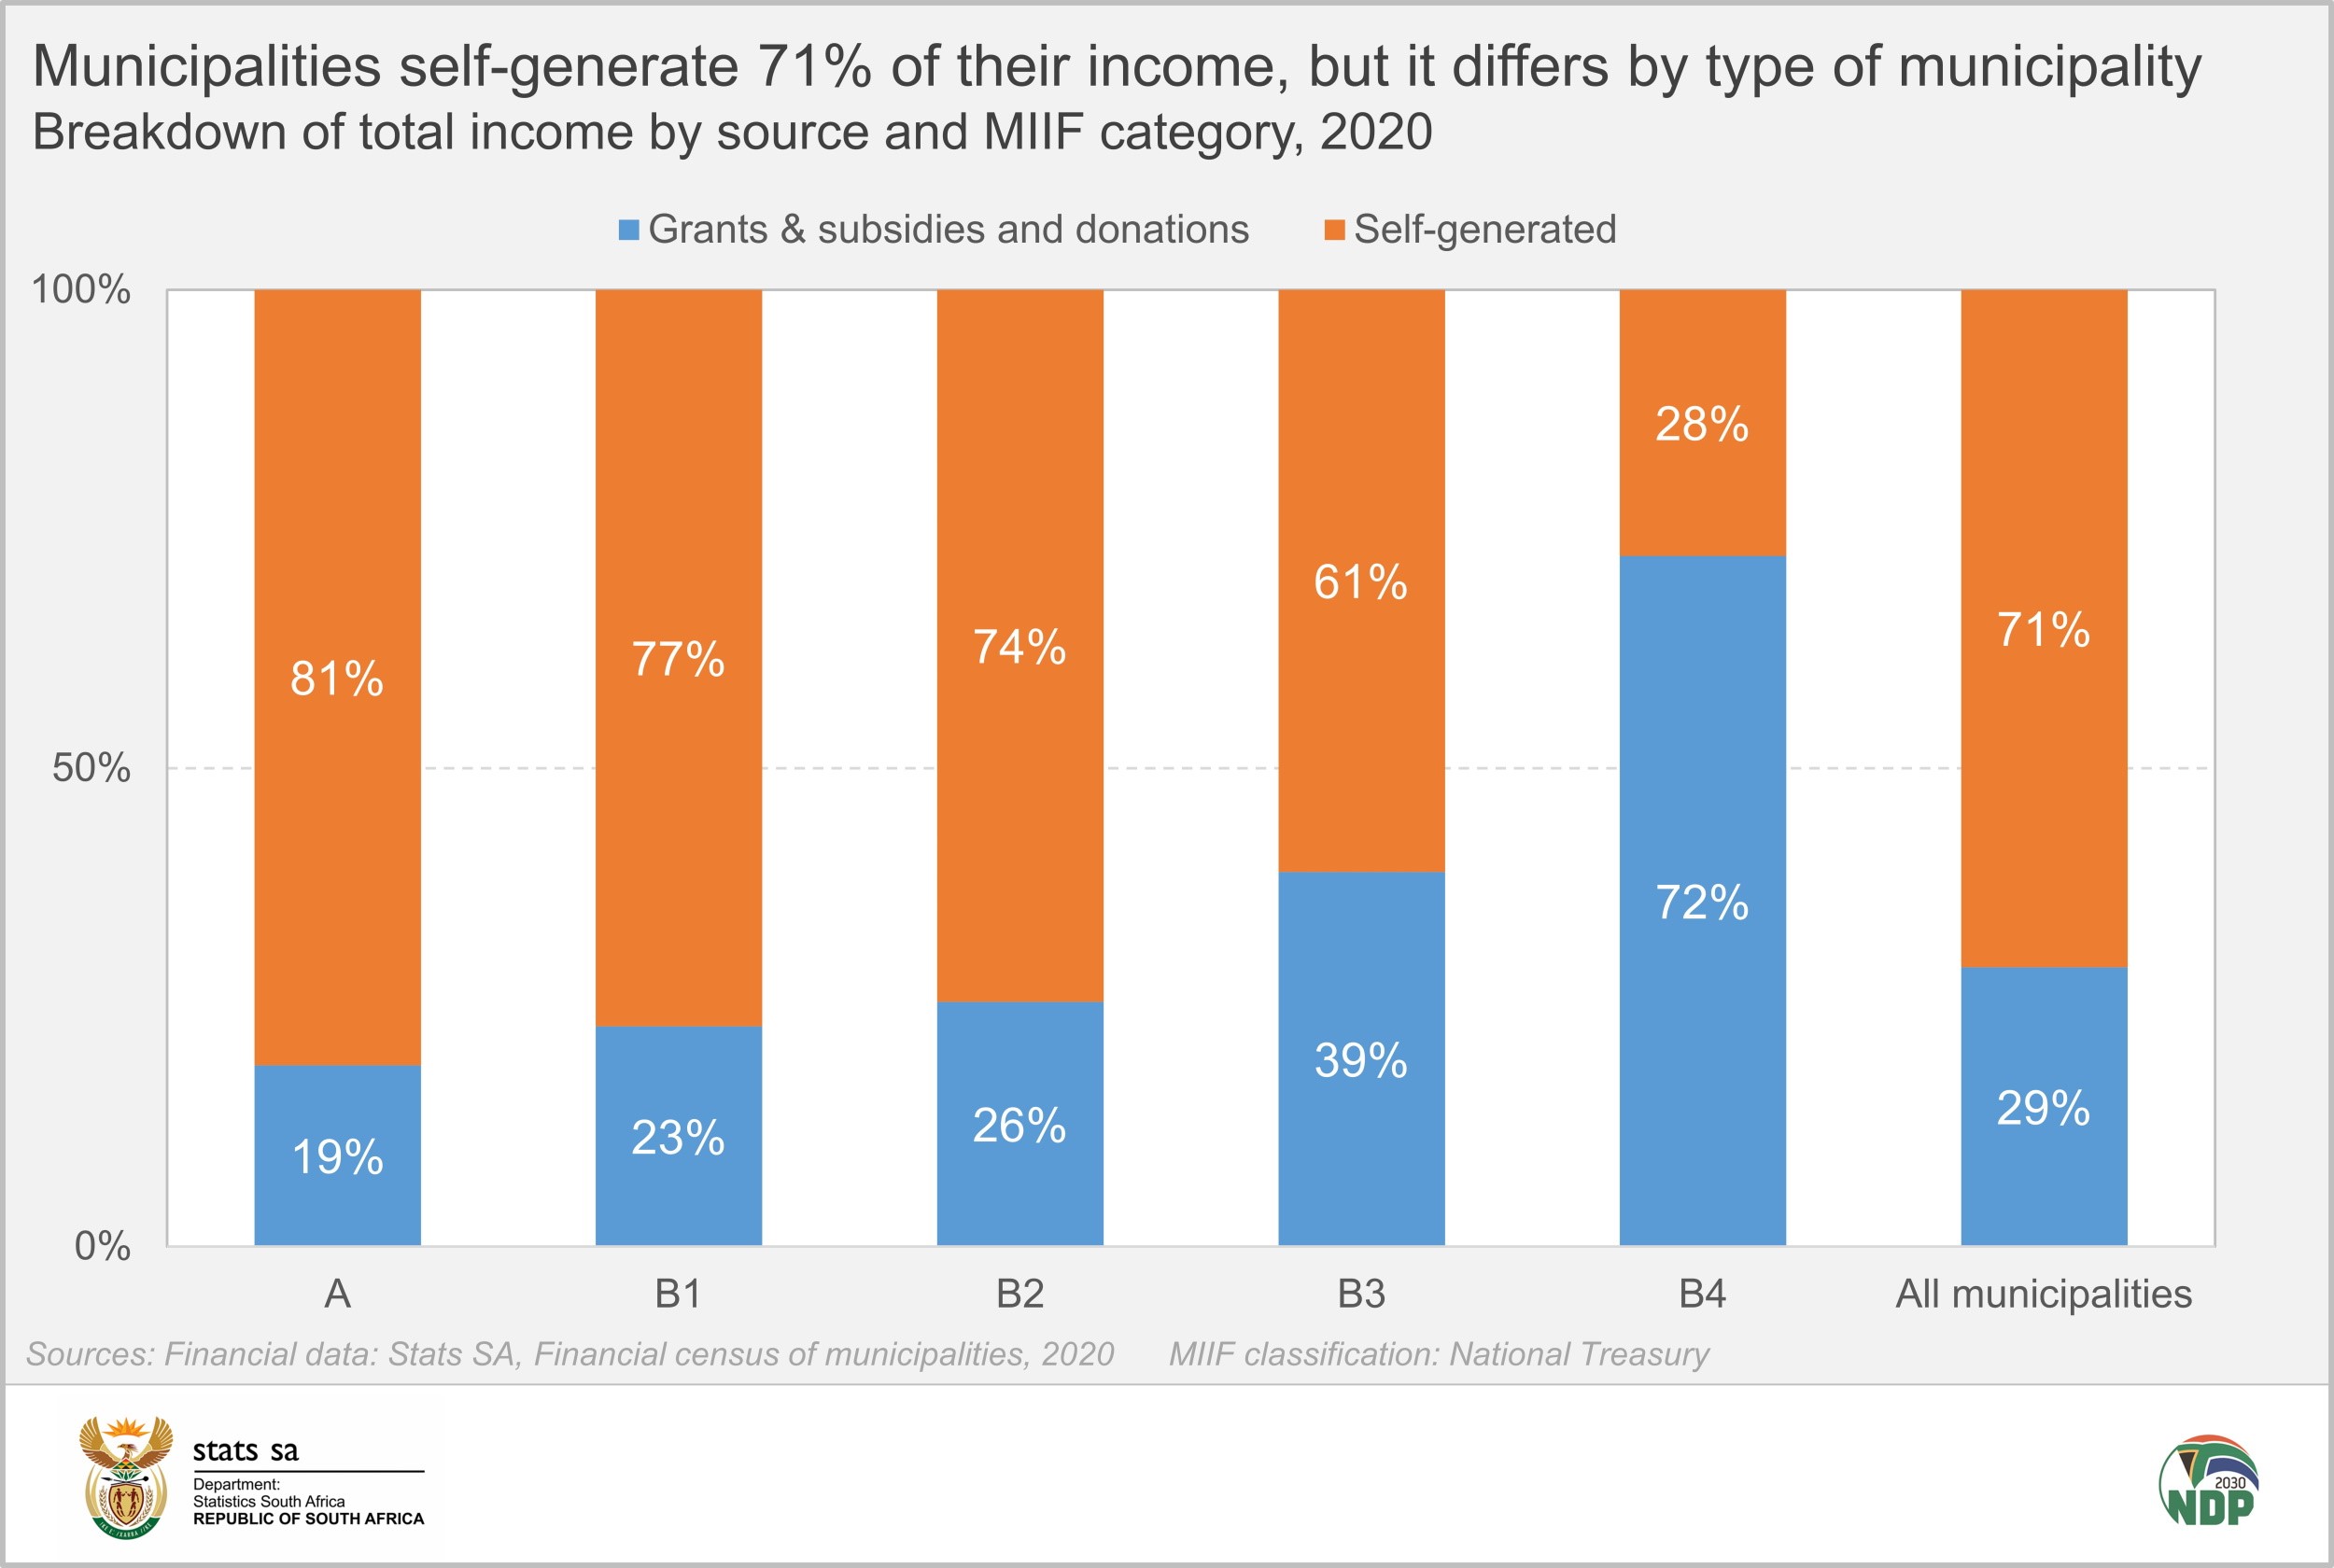
If we consider all 257 municipalities, 71% of total income in 2020 was self-generated. The remaining share (29%) was from government grants & subsidies, as well as from donations and contributions.
The figure of 71% might seem relatively high, but – as is often the case with data analysis – the devil is in the details.
Rural and urban municipalities in perspective
For a more nuanced view, we turn to the classification from the Municipal Infrastructure Investment Framework (MIIF). Developed by the Department of Cooperative Governance and Traditional Affairs, together with the Development Bank of South Africa, this framework categorises local and metropolitan municipalities into five groups: metropolitan municipalities (A), secondary cities (B1), municipalities with a large town as its core (B2), municipalities with small towns (B3), and municipalities that are predominantly rural (B4). District municipalities are allocated the designations C1 (those that are not water service providers) and C2 (those that do provide water as a service).2
An important aspect to consider is that South Africa’s eight largest cities dominate the municipal financial landscape, accounting for almost 60% of total municipal income. These urban centres generate a large proportion of their own income, skewing the national picture.
Data from the Financial census of municipalities report fitted to the MIIF categories shows that in 2020, metropolitan (A) councils self-generated 81% of their income, compared with 28% recorded by rural (B4) municipalities.
How has this changed over time?
Boundary changes for the current municipal structure, consisting of 257 municipalities, were adopted during the 2016 elections and reported on for the first time in the Financial census of municipalities report for 2017.
As a group, municipalities self-generated 71% of their income in 2020, a rise of 1 percentage point from 70% in 2017.
The map below shows this for all local and metropolitan municipalities. Blue-coloured municipalities are those that recorded a rise in the share of self-generated income. Red-coloured municipalities recorded a fall in the share of self-generated income.
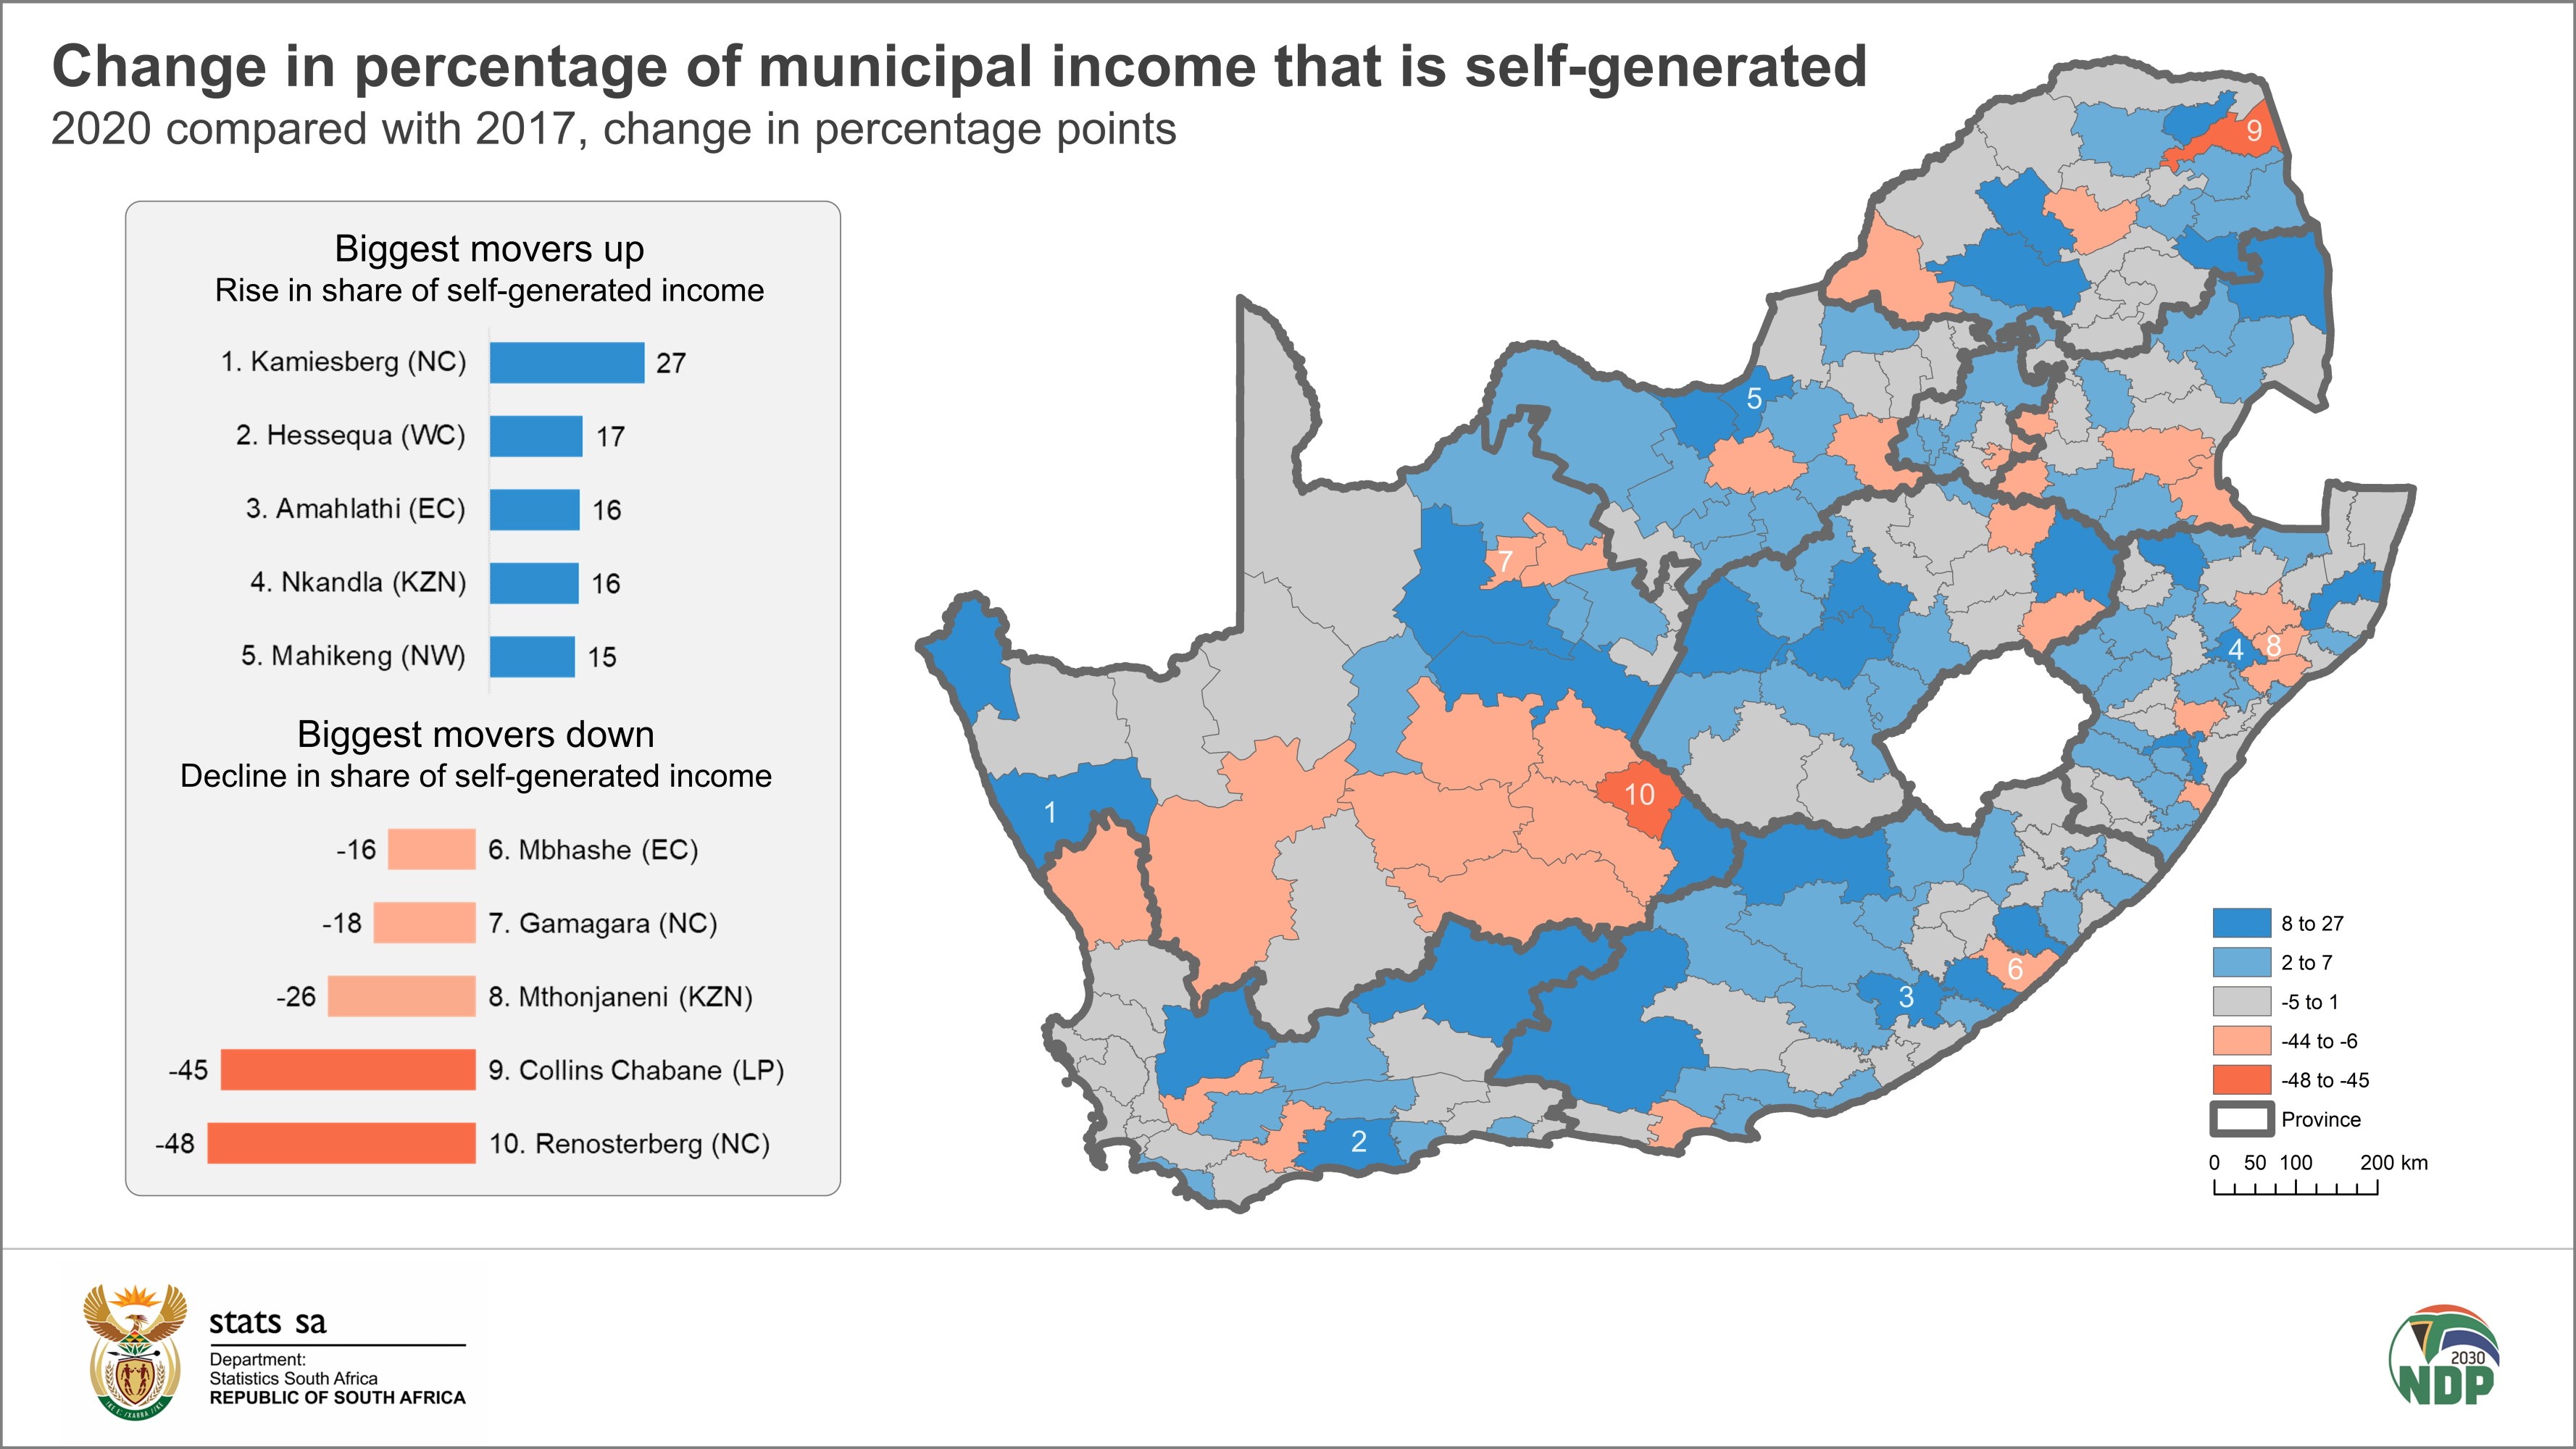
The three municipalities that registered the biggest increases (i.e. in share of self-generated income) over this period were Kamiesberg (Northern Cape), Hessequa (Western Cape) and Amahlathi (Eastern Cape). The three local municipalities that registered the biggest decreases were Renosterberg (Northern Cape), Collins Chabane (Limpopo) and Mthonjaneni (KZN).
Of course, the above analysis can only point us to those municipalities where large movements have occurred. More in-depth analysis of the data for these municipalities is required to draw firm conclusions on the state of their financial well-being.
As a final step, we look at these changes through the lens of the MIIF framework. The chart below shows percentage point changes for each of the five categories. B2 municipalities and metropolitan (A) councils recorded the biggest increases in the share of self-generated income.
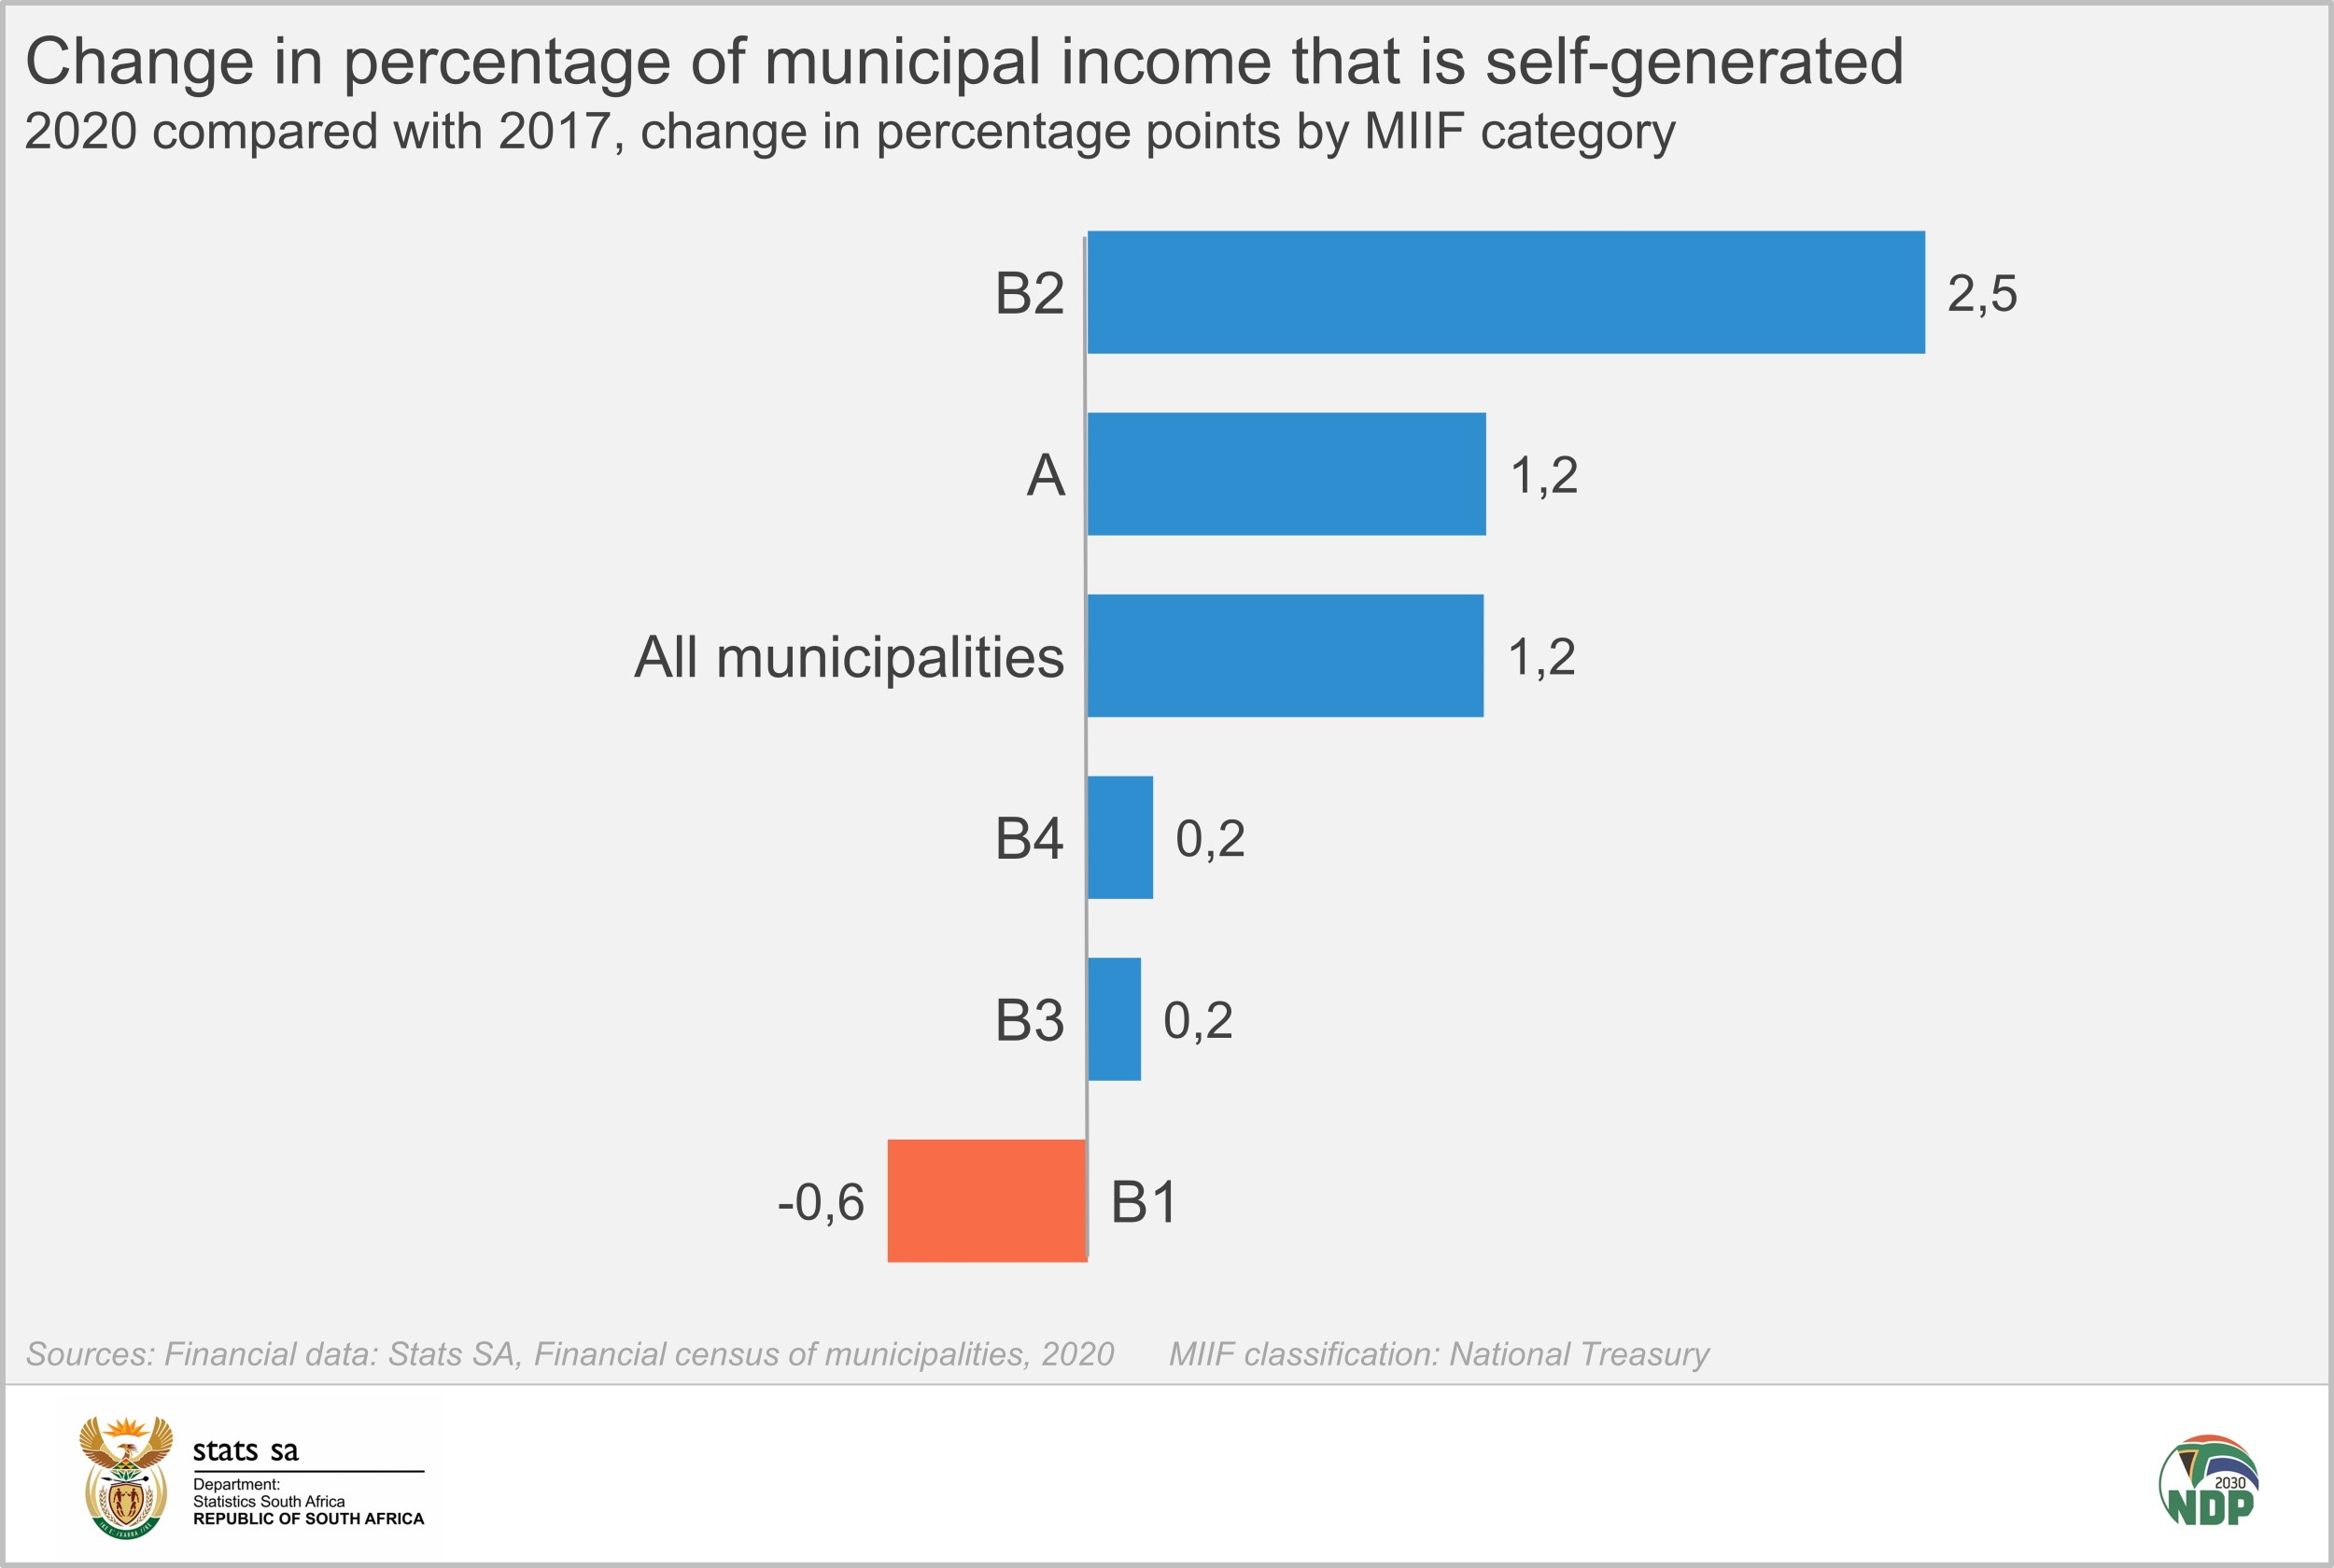
B1 municipalities, those with a large town as its core, recorded a decrease.
Exploring government grants & subsidies
Government grants & subsidies include two forms of intergovernmental fund transfers, namely general purpose (i.e. unconditional) and specific purpose (i.e. conditional) grants. Municipalities can use unconditional grants for a variety of purposes at their own discretion. Conditional grants, on the other hand, are transferred to municipalities with the specific condition that the funds are used for maintaining infrastructure, such as roads, pipes, and wastewater treatment plants.3
Local government is the third biggest recipient of grants & subsidies, after provincial government and extra-budgetary accounts & funds, according to Stats SA’s Financial statistics of national government release.4
For more information, download the latest Financial census of municipalities report here.
1 The Constitution of the Republic of South Africa (Section 229) grants municipalities the authority to charge for services.
2 Development Bank of South Africa, The Municipal Infrastructure Investment Framework (MIIF 7), Round 7 (2009 – 2010): A capital investment perspective (download here). A list of municipalities categorised by the MIIF classification is accessible here from National Treasury.
3 Mahabir J and Mabena N (2015) Identifying the funding constraints in municipal capital investments. Available: www.ffc.co.za (accessed 19 July 2020).
4 Stats SA, Financial statistics of national government, 2019/2020. Figure 3 (download here).