
A breakdown of national government spending in 2019/20
With government spending in the spotlight, new data from Stats SA provide an update on the extent and pattern of national government expenditure. The South African national government spent R1,73 trillion in 2019/20, according to the latest Financial statistics of national government report. This is 12% higher than the R1,54 trillion recorded in 2018/19.
This figure excludes capital expenditure and represents expense cash flows recorded by all 47 national government departments. The data (which are for national government only) cover the period 1 April 2019 to 31 March 2020. This is before the COVID-19 pandemic had any real impact on the economy.
The 12% rise in expenses was driven largely by increased allocations of money to other organisations, most notably in the form of financial transfers (referred to as grants) to provincial government and extra-budgetary accounts & funds, and capital transfers to public corporations.
In fact, financial grants to other spheres of government dominated national government expenses, accounting for 56% (R968 billion) of the R1,73 trillion.
Provincial government was the main beneficiary of these grants, receiving almost two-thirds of the R968 billion. This might seem like a lot, until you consider that the provinces are responsible for driving the country’s health and education programmes. These require a great deal of financial resources.
As a group, South Africa’s 255 extra-budgetary accounts & funds – which includes entities such as the South African Revenue Service and the National Student Financial Aid Scheme – was the second biggest beneficiary, accounting for 14% of grants. The country’s 257 municipalities accounted for 13%, followed by foreign organisations (6%) and tertiary education institutions (4%).
On the other side of the coin, National Treasury was the main benefactor of these grants, responsible for transferring 61% of the R968 billion, as illustrated in the graphic below. As mentioned above, a large portion of this amount was transferred to provincial government departments.
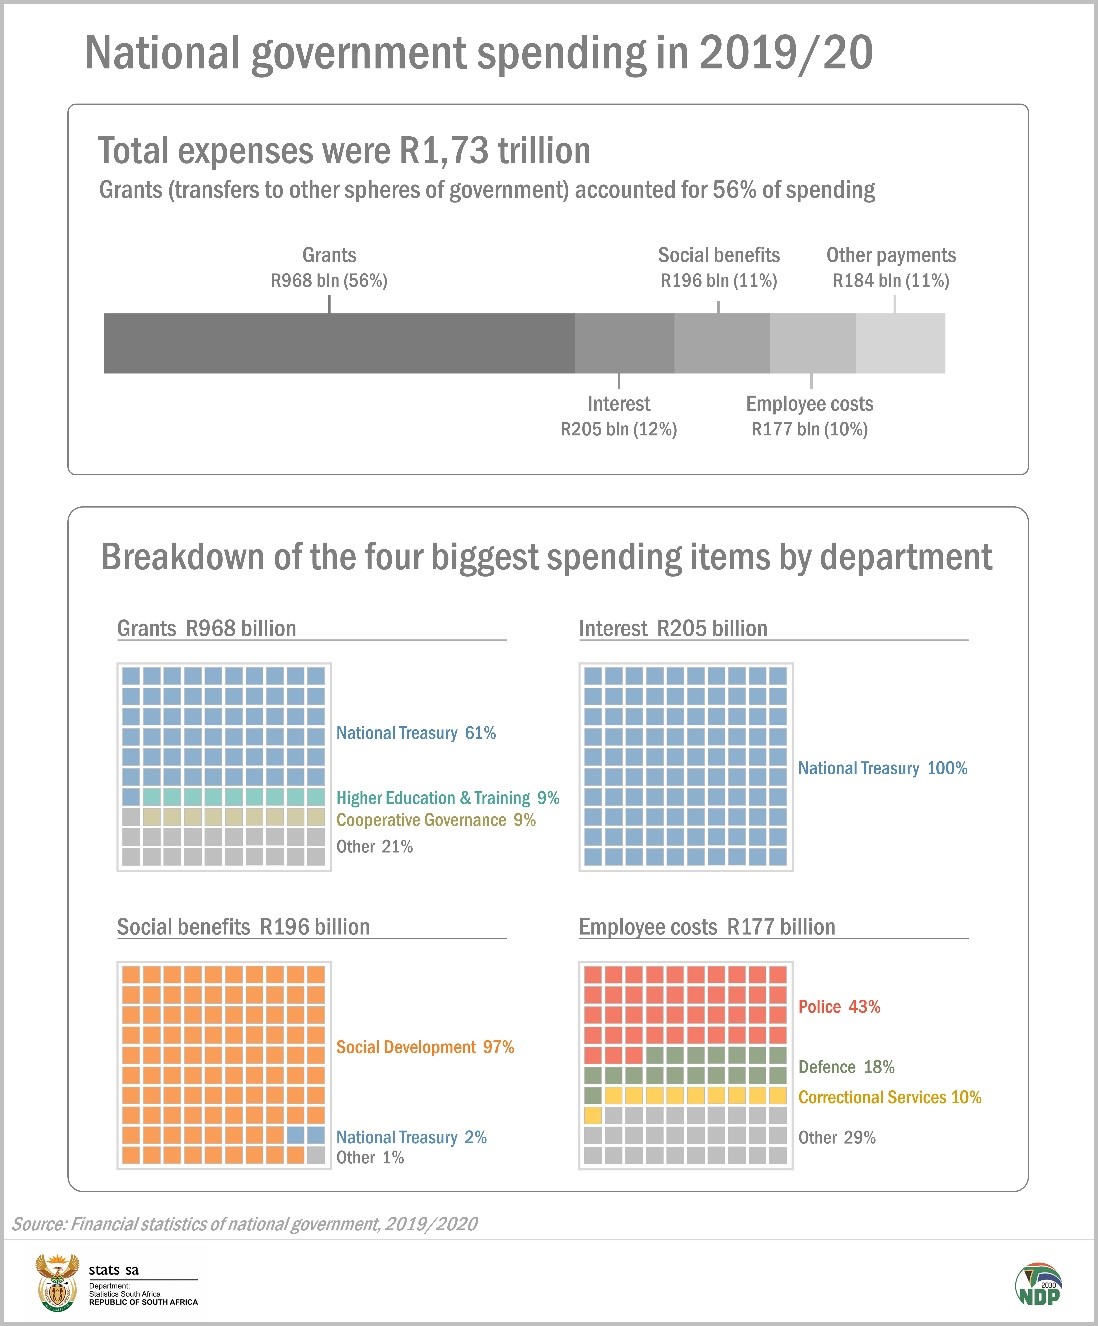
After financial grants, the second biggest expense item on national government’s financial statement was interest paid on public debt, accounting for 12% of total expenses. National Treasury dominates this item too, responsible for almost the entire (99,9%) amount. There was a 13% rise in interest paid compared with 2018/19.
Social benefits accounted for 11% of national government expenses. The Department of Social Development dominated spending in this category. There was a 17% increase compared with 2018/19, associated mainly with a rise in payments of social grants to households.
Departments involved in safety and security dominated spending on employee costs. South Africa’s police services accounted for 43% of the national government wage bill, followed by the Department of Defence (18%) and the Department of Correctional Services (10%). The other 44 national government departments accounted for 29%.
Note that the data reflected in this report cover national departments only. Stats SA also publishes financial reports for other levels of government (i.e. provincial, local, extra-budgetary accounts) and higher education institutions during the year. These reports are followed by a consolidated document in November that provides a complete overview of net government finances.1
For more information on national government finances, download the latest Financial statistics of national government release here.
1 To find out more on the financial situation of the South African government as a whole, you can access the latest summary here .
Similar articles are available on the Stats SA website and can be accessed here .
For a monthly overview of economic indicators and infographics, catch the latest edition of the Stats Biz newsletter here.