
The peaks and troughs of municipal income
For many of us who are fortunate enough, things just work. Turn on a tap, and water flows. Flip a switch, and there is light. We often take for granted the extremely complex system that provides us with services every day.
Local government is a vital cog in this system. South Africa’s 257 municipalities are tasked with ensuring that communities across the country receive a variety of services, including sewerage & sanitation, water, electricity and refuse removal. Details on the provision of these services are covered in Stats SA’s recent Non-financial census of municipalities report.1
Such a wide-ranging system requires a great deal of financial resources. Generally, local government receives the bulk of its money from two main sources. First, from national and provincial government who transfer money to municipalities on a regular basis (referred to as grants and subsidies or transfers). Secondly, from homeowners, businesses and industries who pay service charges and property rates.2
Stats SA’s Quarterly financial statistics of selected municipalities report provides regular updates on the state of municipal finances, covering data from the largest 130 municipalities.3
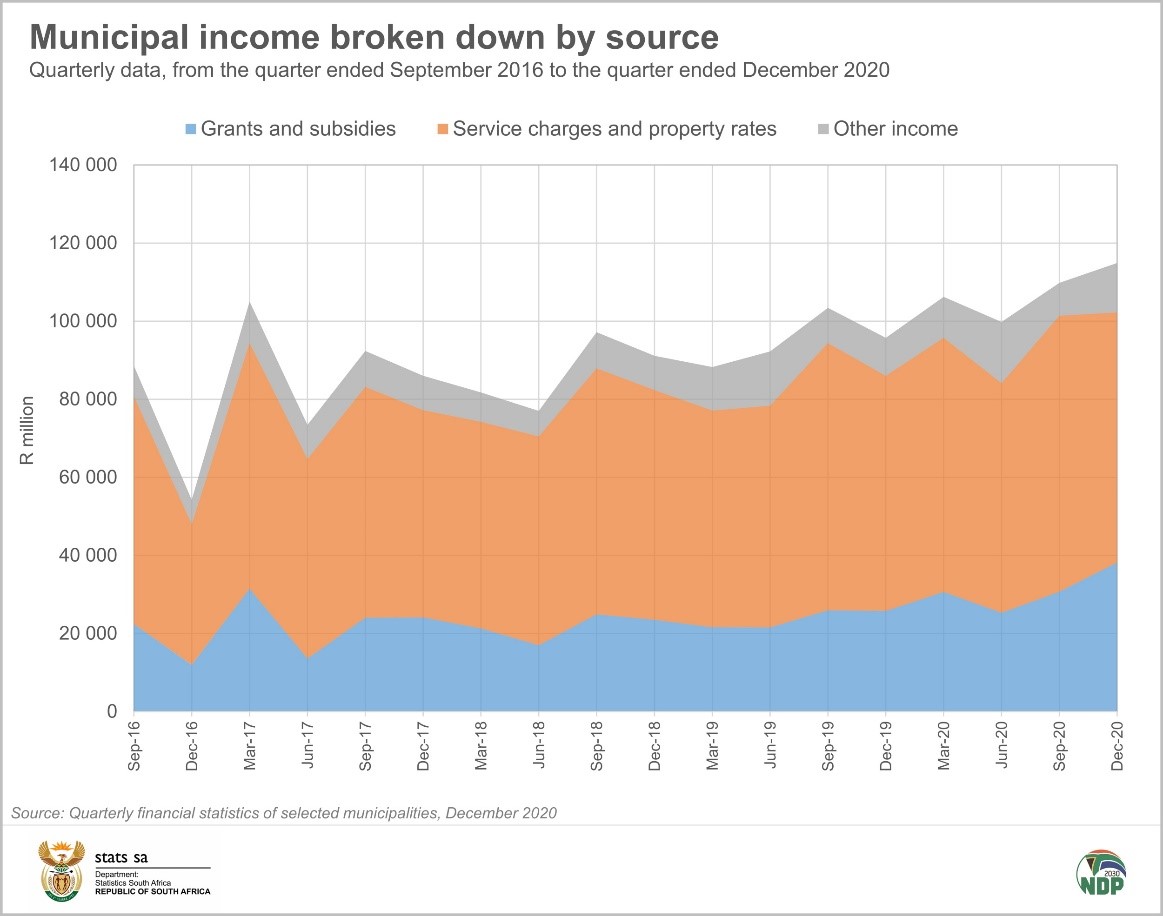
The area chart below shows municipal income over time, broken down into grants and subsides (blue), service charges & property rates (orange) and other income (grey).4 The first thing that stands out in the chart is that service charges and property rates form the biggest income item, followed by grants and subsidies.
At first, this might seem to indicate that municipalities are in a good financial position, that they are able to generate the bulk of revenue themselves.
However, as with all complex systems, there is some detail that needs to be unpacked. The local government landscape is dominated by eight large metropolitan municipalities who, as a group, contribute about 60% to total municipal income.
As urban centres, these cities (together with smaller, secondary cities) are able to generate the bulk of their income from service charges and property rates. Due to their collective size, they have a large influence on the trend reflected in national aggregates.
The much smaller, rural municipalities are typically more dependent on grants and subsidies than they are on other income sources. This is also shown in data from Stats SA’s annual financial census report that covers all municipalities.5
Moving back to the chart, the second aspect that stands out are the peaks and troughs. These bumps in the data represent seasonal patterns in municipal income.
The biggest source of income in the service charges and property rates category is sales of electricity, which contributes about a quarter of total municipal income. When sales of electricity rises and falls, it has a noticeable effect on total income.
Many municipalities act as intermediaries in the South African electricity sector: they buy power from Eskom and resell it to consumers. Electricity demand is seasonal, rising in winter and mellowing out over the summer months. Municipalities typically see a peak in sales of electricity in the quarter ending September.
Not only does the colder weather play a role in this quarter, but municipalities also implement annual tariff increases in July each year.
What about the noticeable peak in the quarter ended March 2017? This was both a result of a jump in grants and subsides and a rise in electricity sales, according to the data.
For more information, download the latest Quarterly financial statistics of selected municipalities report here.
1 The Non-financial census of municipalities report for 2019 is available here.
2 Property rates are sourced from owners of land, homes, buildings or businesses. The amounts levied for property rates are generally based on the value of the property.
3 With effect from the September 2020 quarter, Stats SA reduced the scope of this survey from 257 municipalities to the 130 largest municipalities in terms of expenditure. These municipalities represent approximately 85% of the total value when the full scope of municipalities is surveyed.
4 Other income includes (a) interest income, (b) fines and penalties and (c) public contributions and donations.
5 Stats SA, 2015. Rural municipalities continue to depend on government for revenue (read here). For updated data that cover all 257 municipalities, download the annual report and unit data here.
Similar articles are available on the Stats SA website and can be accessed here.
For a monthly overview of economic indicators and infographics, catch the latest edition of the Stats Biz newsletter here.