
Municipalities: service delivery, bucket toilets and gender representation
There are two sides to every coin. Service delivery in South Africa is often measured from the demand side, via household surveys and the Population Census. What you might not know about is that data also exist for the supply side, collected from those who provide services.
Every year Stats SA asks municipalities to provide information on the extent of their operations, particularly on their service delivery efforts. Local government is primarily responsible for providing water, electricity, sewerage, sanitation and refuse removal services to homes, businesses and industries across the country. The Non-financial census of municipalities report keeps track of all 257 municipalities, providing data on service delivery, indigent households, bucket toilets and the size of the municipal workforce.
These are three sets of facts from the latest report.
Municipalities expand service delivery, but provide less for free
Local government has made great strides in providing services. For example, municipalities supplied water to just over 9 million consumer units 1 in 2006, expanding to 13,8 million in 2019. This represents an average annual growth rate of 3,2%, outstripping the national population growth rate of 1,5% measured over the same period.
What hasn’t gone up is the number of consumer units receiving services for free. There has been a reduction in the coverage of free basic services across the board. In terms of water, for example, 6,9 million consumer units benefited from free water in 2006, falling to just over 3 million in 2019. In 2006, 76% of consumer units received free water, falling to 22% in 2019 (click on the chart to enlarge).
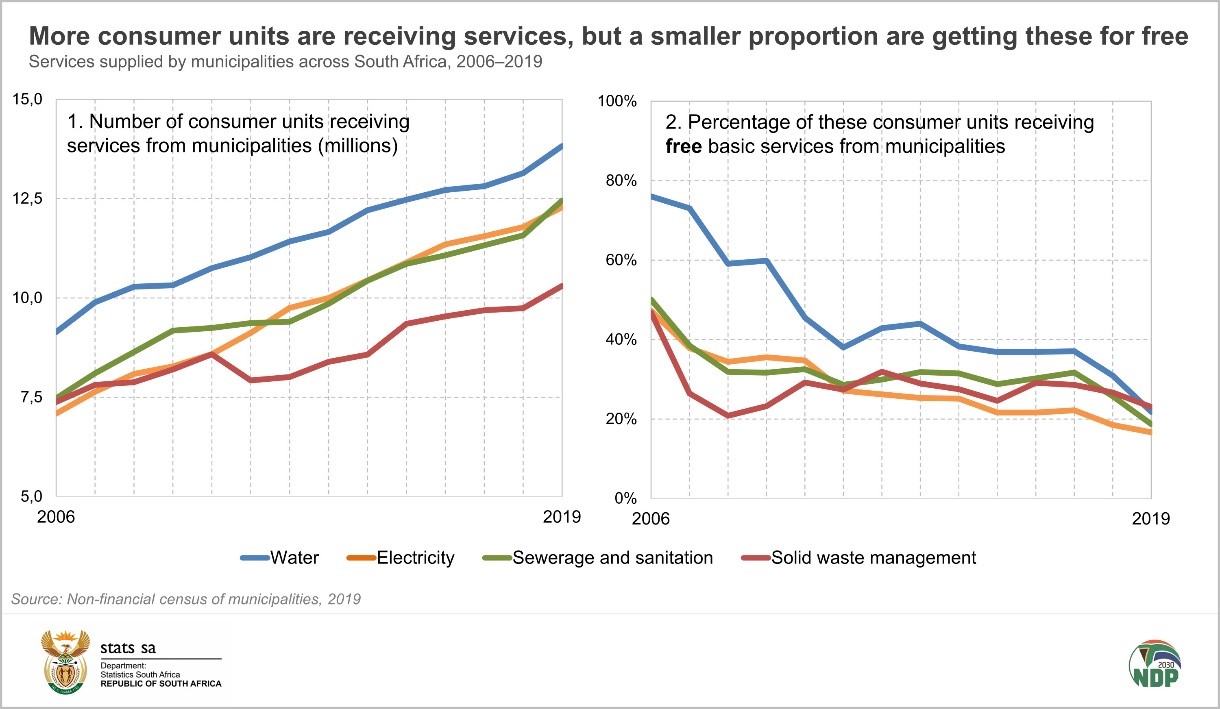
The fall is primarily due to municipalities changing the mechanisms that they use to decide who qualifies for a free service. In the past, broad-based methods were mostly used. These approaches granted free services or subsides to all consumer units in a municipality or to consumer units across an entire area. Over time, these methods have given way to more targeted approaches that identify specific households.
In other words, municipalities are now targeting the rightful beneficiaries (i.e. indigent households), instead of providing free basic services to all households regardless of their indigent status.
Bucket toilets are on the decline, but some municipalities continue to struggle
The number of consumer units using a municipal-supplied bucket toilet decreased slightly from 42 622 in 2018 to 42 434 in 2019. This follows a general trend of declining numbers since 2013 when 100 610 consumer units used a bucket toilet system. 2
One might immediately wonder why municipalities supply bucket toilets at all. Municipalities often provide bucket toilets as a temporary measure while they develop improved sanitation facilities. Sometimes, however, difficulties delay the process, making it hard to replace bucket toilets once the system has been introduced.
North West and Free State recorded an increase in the use of bucket toilets in 2019 compared with 2018. Ditsobotla municipality in North West and Nketoana municipality in Free State recorded the largest percentage increases.
Almost half of all consumer units that use a municipal-supplied bucket toilet in South Africa are located in Free State. Eleven municipalities in that province provided bucket toilets to a total of 20 688 consumer units. The map below shows those municipalities that continue to provide bucket toilets.
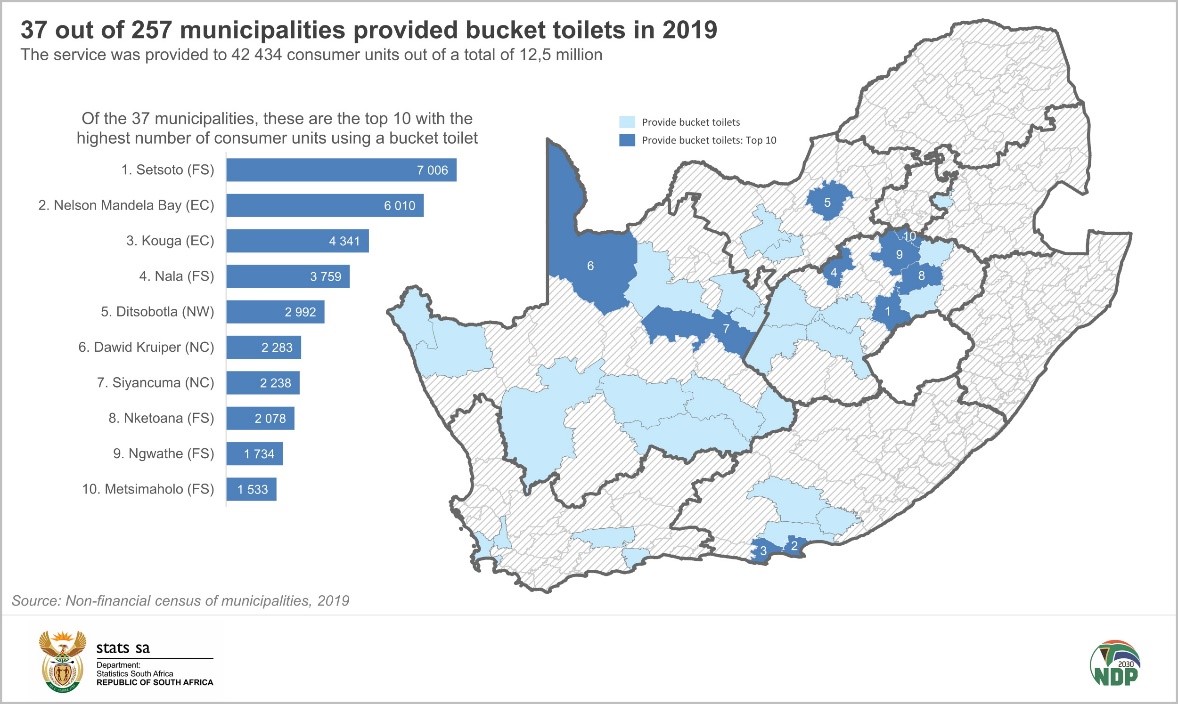
Municipalities in Western Cape, Northern Cape, Eastern Cape, and Mpumalanga recorded a decline in bucket toilet use. Gauteng, KwaZulu-Natal and Limpopo reported zero provision of bucket toilets in 2019.
One municipality, Mantsopa in Free State, managed to eradicate all the bucket toilets that it had provided to households.
Mayoral positions lag behind in gender representation
The Non-financial census of municipalities report also provides details on the structure of the municipal workforce, in particular on gender representation across various levels of management.
Gender equality is a founding principle in the Constitution. The Department of Public Service and Administration has committed to ensuring a target of 50% female representation across all senior management levels within the public sector, including local government. 3
How do municipalities square up in terms of mayoral seats? In 2019, 254 of South Africa’s 257 municipalities had a sitting mayor. Of these, 90 (35%) were female and 164 (65%) were male.
North West was the most representative, with 12 of its 22 (55%) municipalities headed by a female mayor. The province with the lowest female representation was KwaZulu-Natal (10 of 51 occupied mayoral seats, or 20%).
The graphic below shows how representation has shifted over time. There is often a fair amount of churn that occurs with mayoral appointments, but some general trends can be seen. Municipalities in North West and Limpopo have managed to achieve 50/50 gender parity for most years, while KwaZulu-Natal and Western Cape still have some way to go to reach this target. 4
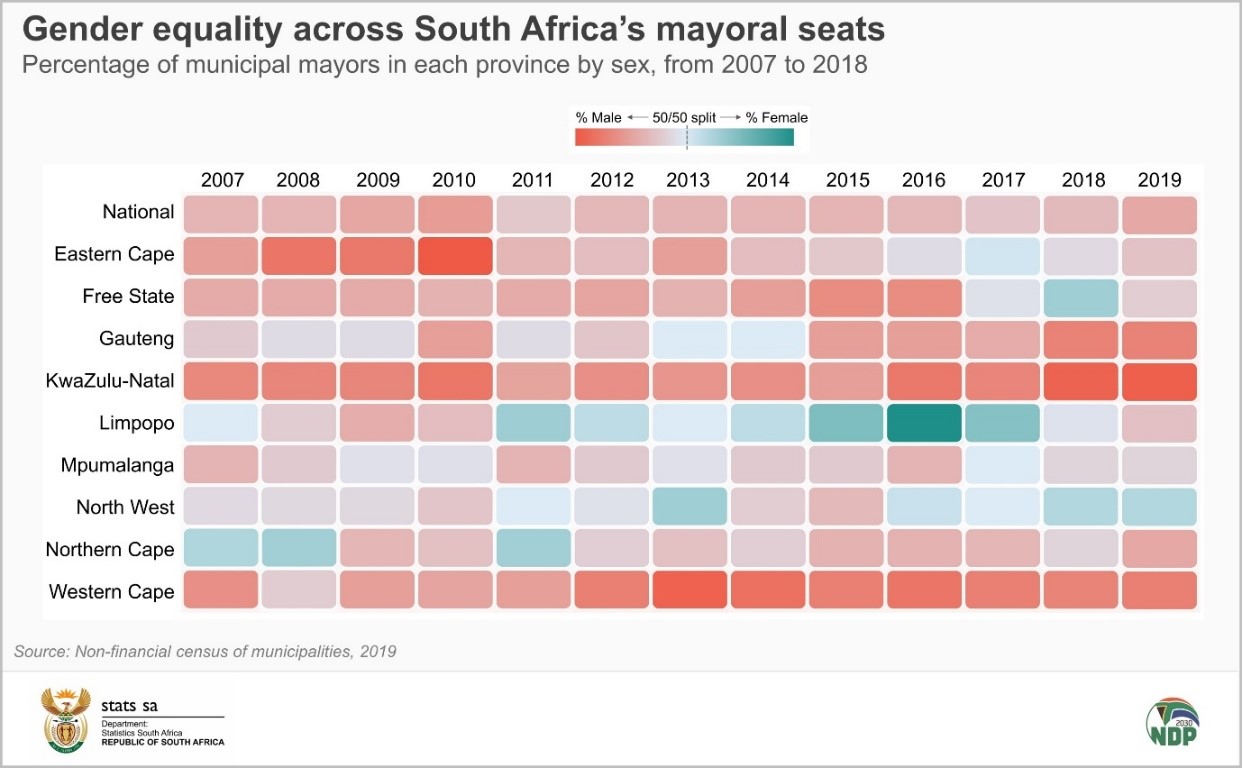
Over the 2007–2019 period, Limpopo recorded the highest female representation rate in 2016 (70%). Eastern Cape registered the lowest rate in 2010 when women occupied only 18% of mayoral seats in that province.
An important point to remember when interpreting the graphic above is that comparisons made over time are complicated by local government elections. These elections occur every five years and involve a change in the number of municipalities, often due to disestablishment or merging; in some cases, new municipalities are formed.
For more information, download the Non-financial census of municipalities, 2019 report and unit data in Excel here.
1 A consumer unit is an entity to which the service is (or would be) delivered, and which receives one utility bill. A consumer unit is alternatively known as a delivery point. This concept is often referred to as a household by municipalities, but this is not strictly correct, as households and consumer units do not coincide one-to-one, particularly in blocks of flats, on stands where there are multiple households in the same dwelling, and in cases where public taps are used.
2 The figures from the Non-financial census of municipalities report cannot be compared with data on bucket toilets from Stats SA household surveys, such as the Population Census, Community Survey, and the General Household Survey. This is because the Non-financial census of municipalities survey measures the supply side of service delivery in South Africa, and reports on only those bucket toilets provided and collected by municipalities.
3 The Department of Public Service and Administration, A strategic framework for gender equality within the public service (2006–2015): Consultation document, page 3 (read here).
4 The chart does not have data for 2006 as Stats SA only began publishing figures on mayoral positions in 2007.
Similar articles are available on the Stats SA website and can be accessed here.
For a monthly overview of economic indicators and infographics, catch the latest edition of the Stats Biz newsletter here.