
When talking economics, consider the provinces
Economic growth is often quite lumpy. A national measure of gross domestic product (GDP) is useful to gauge how a country is doing as a whole. Still, it misses the fact that economic activity varies across towns, cities and regions.
Stats SA’s most recent quarterly GDP release provides national data for the entire year of 2020. It also includes geographical nuance with provincial GDP figures for 2019.
South Africa’s real GDP grew by 0,2% in 2019. At a national level, the year was characterised by a slump in economic activity across various industries, most notably in agriculture, construction, mining and manufacturing. Increased production in finance, real estate & business services, government and personal services helped keep national GDP growth in positive territory, albeit by a whisker.
The map below shows how economic growth varies across space. Let’s consider the national growth rate only: we might breathe a sigh of relief, having narrowly escaped economic downturn as a national collective. But a quick look at the provincial data shows that five provincial economies shrank in 2019.
There was economic expansion in the three largest provinces (in terms of GDP); in 2019, Gauteng, Western Cape and KwaZulu-Natal accounted for 64% of the country’s GDP (click on the map to enlarge).
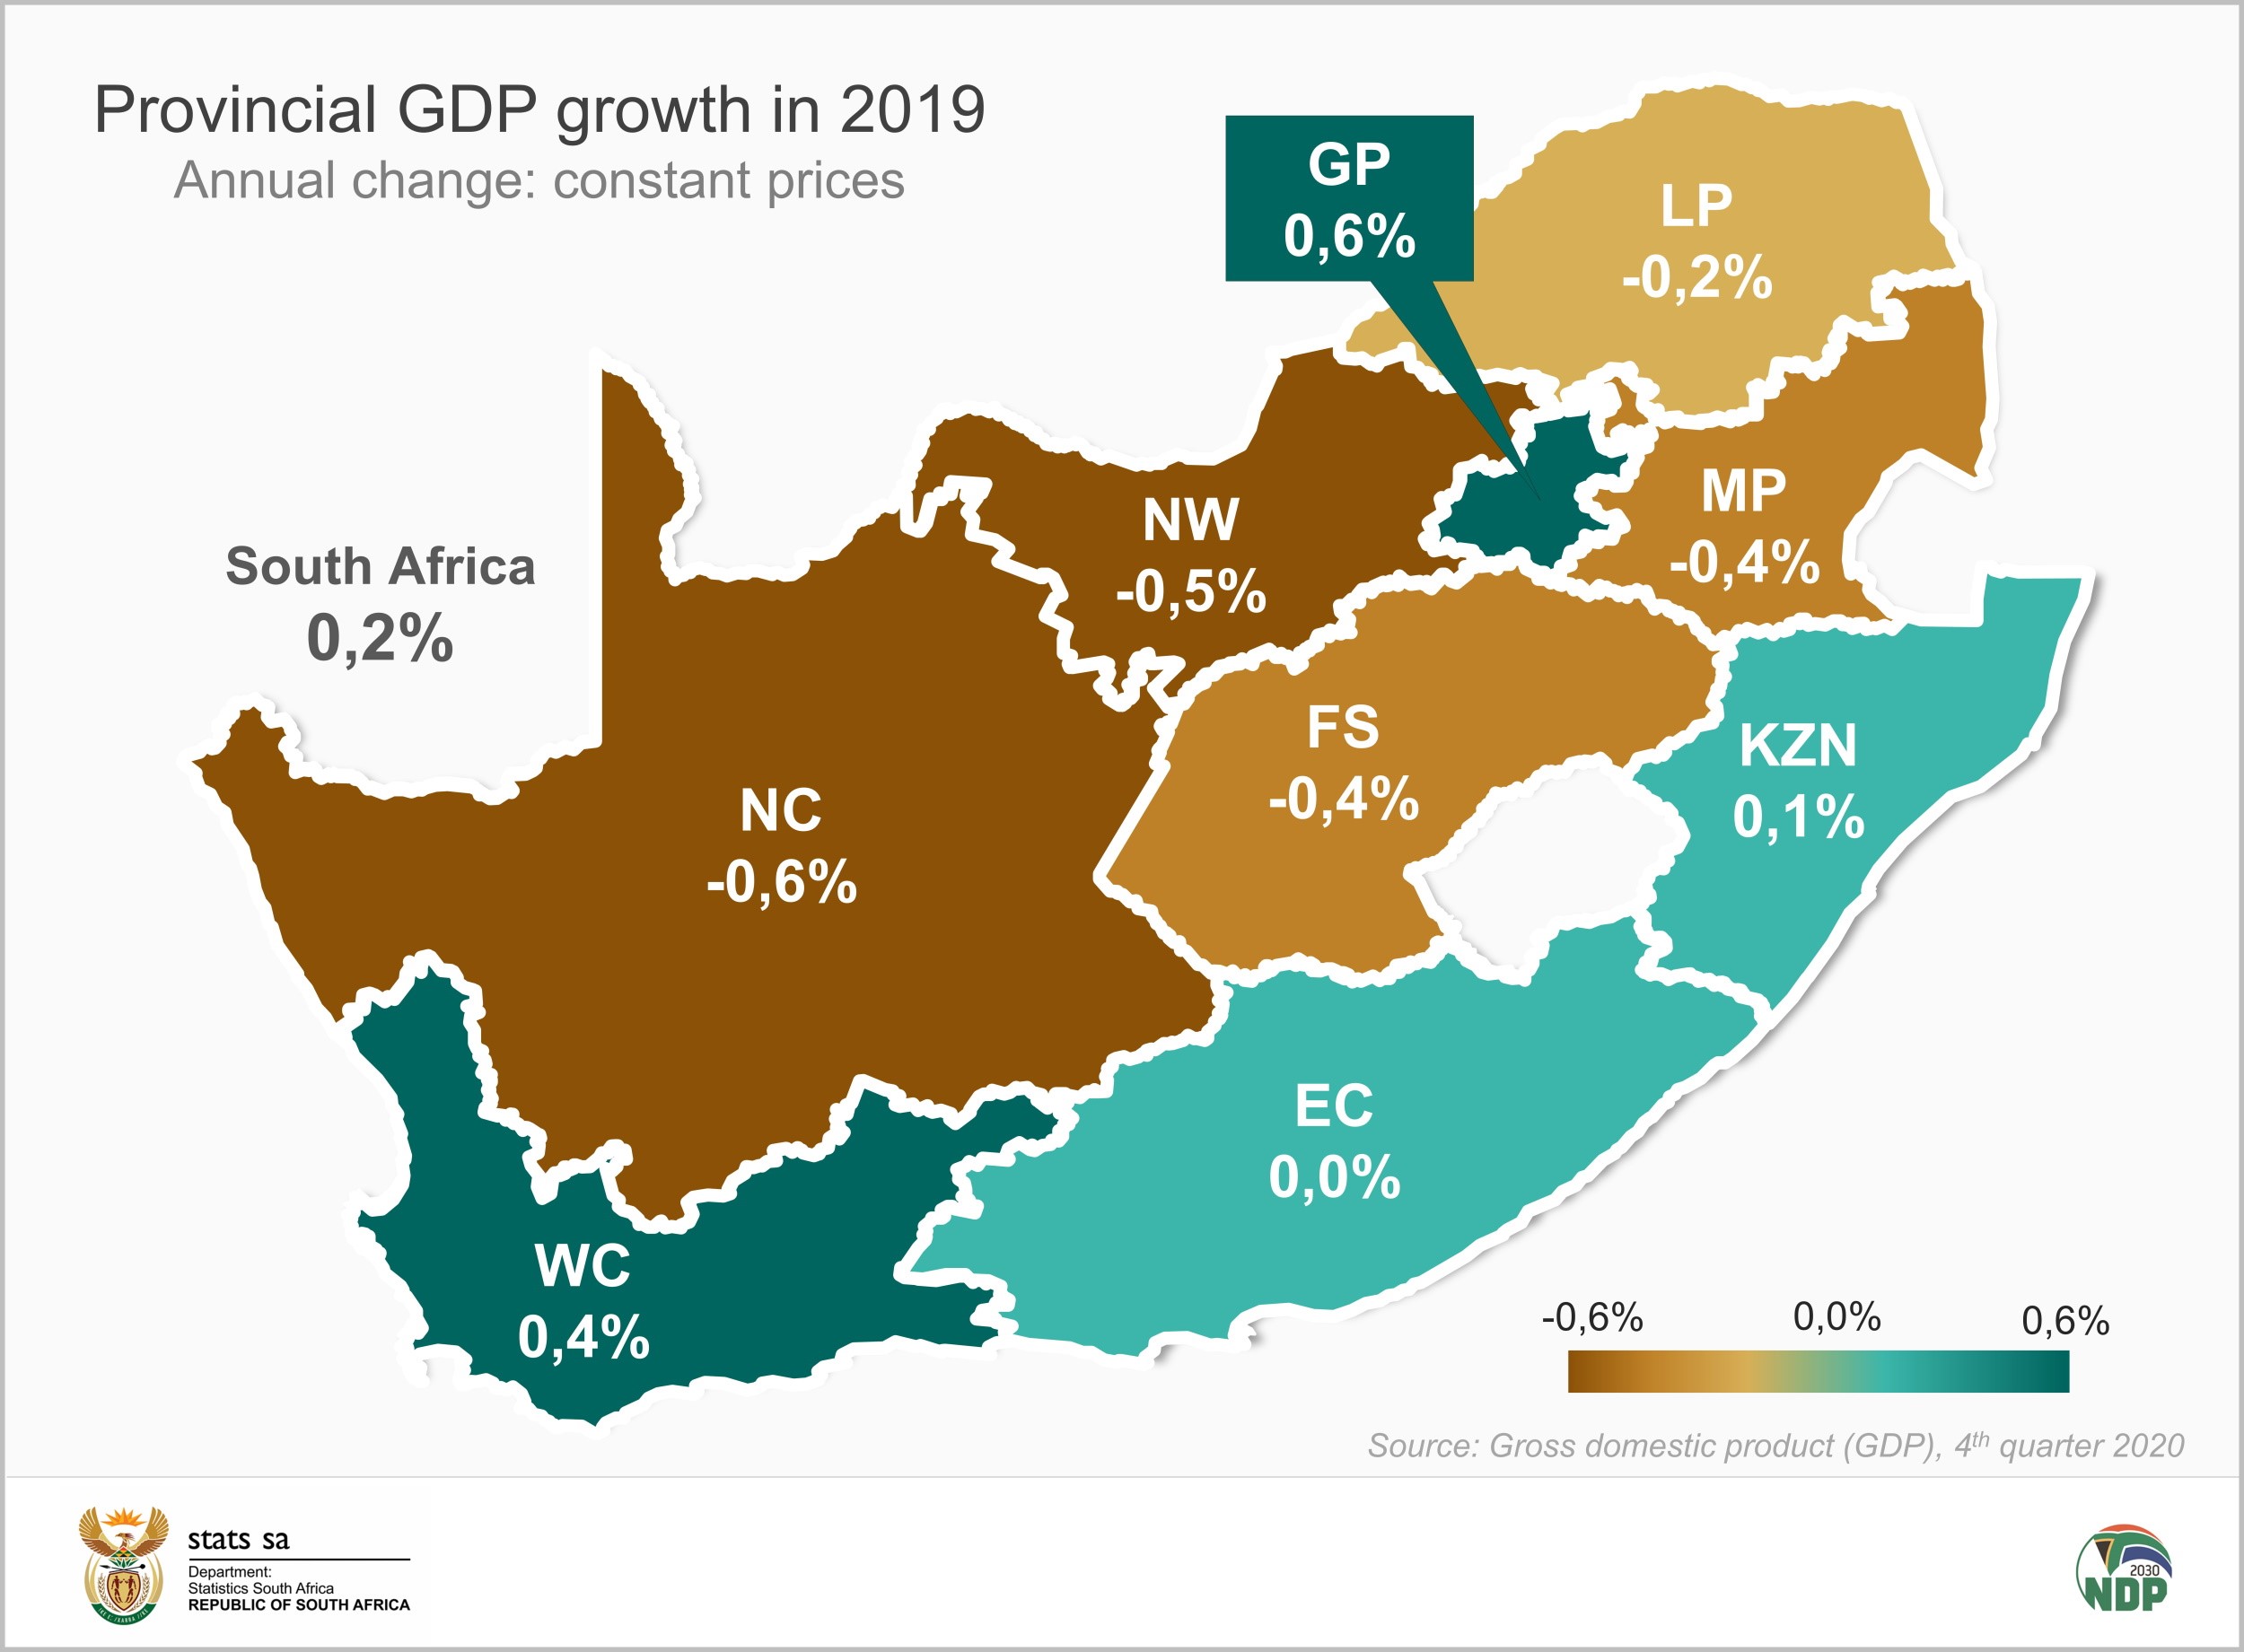
Northern Cape recorded the most significant decline in economic output, followed by North West. Both economies were dragged lower mainly by the poor performance of mining and agriculture.
In fact, mining is the largest industry in both provinces, as well as in Limpopo and Mpumalanga. Any major movements in mining activity will affect the economic fortunes of these provinces, with corresponding consequences for the living conditions of the people who live there.
Gauteng, on the other hand, recorded the highest provincial growth rate. The 0,6% rise in economic activity was mainly driven by finance, real estate & business services, which is the dominant industry in that province. Agriculture is the smallest industry in Gauteng, so its poor performance affected Gauteng far less compared with the other provinces.
Not only does economic activity vary across industries, but it also varies across space. Moreover, industries themselves are clustered in different regions of the country.
So when considering economic growth, going beyond the national figure provides a more valuable, nuanced picture.
To see an overview of the provincial GDP data, view slides 44 to 49 in the fourth quarter 2020 media presentation (download here). To access the data, see Tables 16 to 25 in the Annual quarterly and regional Fourth quarter 2019 Excel file (download here).
Download the Gross Domestic Product (GDP), 4th Quarter 2020 release and supporting documents here.
Similar articles are available on the Stats SA website and can be accessed here.
For a monthly overview of economic indicators and infographics, catch the latest edition of the Stats Biz newsletter here.