
Headline GDP growth rate will no longer be annualised
If you work with gross domestic product (GDP) data or have an interest in economic statistics, the following note might be important to you. Stats SA announced in its most recent GDP statistical release1 that it will no longer use the annualised rate as the headline rate of change.
There are several measures of economic growth used in the context of GDP. These are outlined in an earlier GDP statistical release.2 Each measure comes with its own advantages and disadvantages.
To facilitate the communication of quarterly economic performance, a statistical agency typically chooses one growth figure as its headline rate when it publishes the latest GDP numbers. For many years, Stats SA has used the annualised seasonally adjusted quarter-on-quarter percentage change in GDP (estimated by the production approach at constant prices) as its headline rate.
Annualisation shows what the annual rate would be if the quarter-on-quarter rate were to occur four times in a row. For example, the South African economy grew at a rate of 1,5% in the fourth quarter of 2020, giving an annualised rate of 6,3%.
The following chart demonstrates the impact of annualising from the first quarter of 2009 to the first quarter of 2020. Note that the two growth rates (% quarter-on-quarter; and % quarter-on-quarter annualised) always carry the same sign (i.e. both positive, or both negative, or both zero).
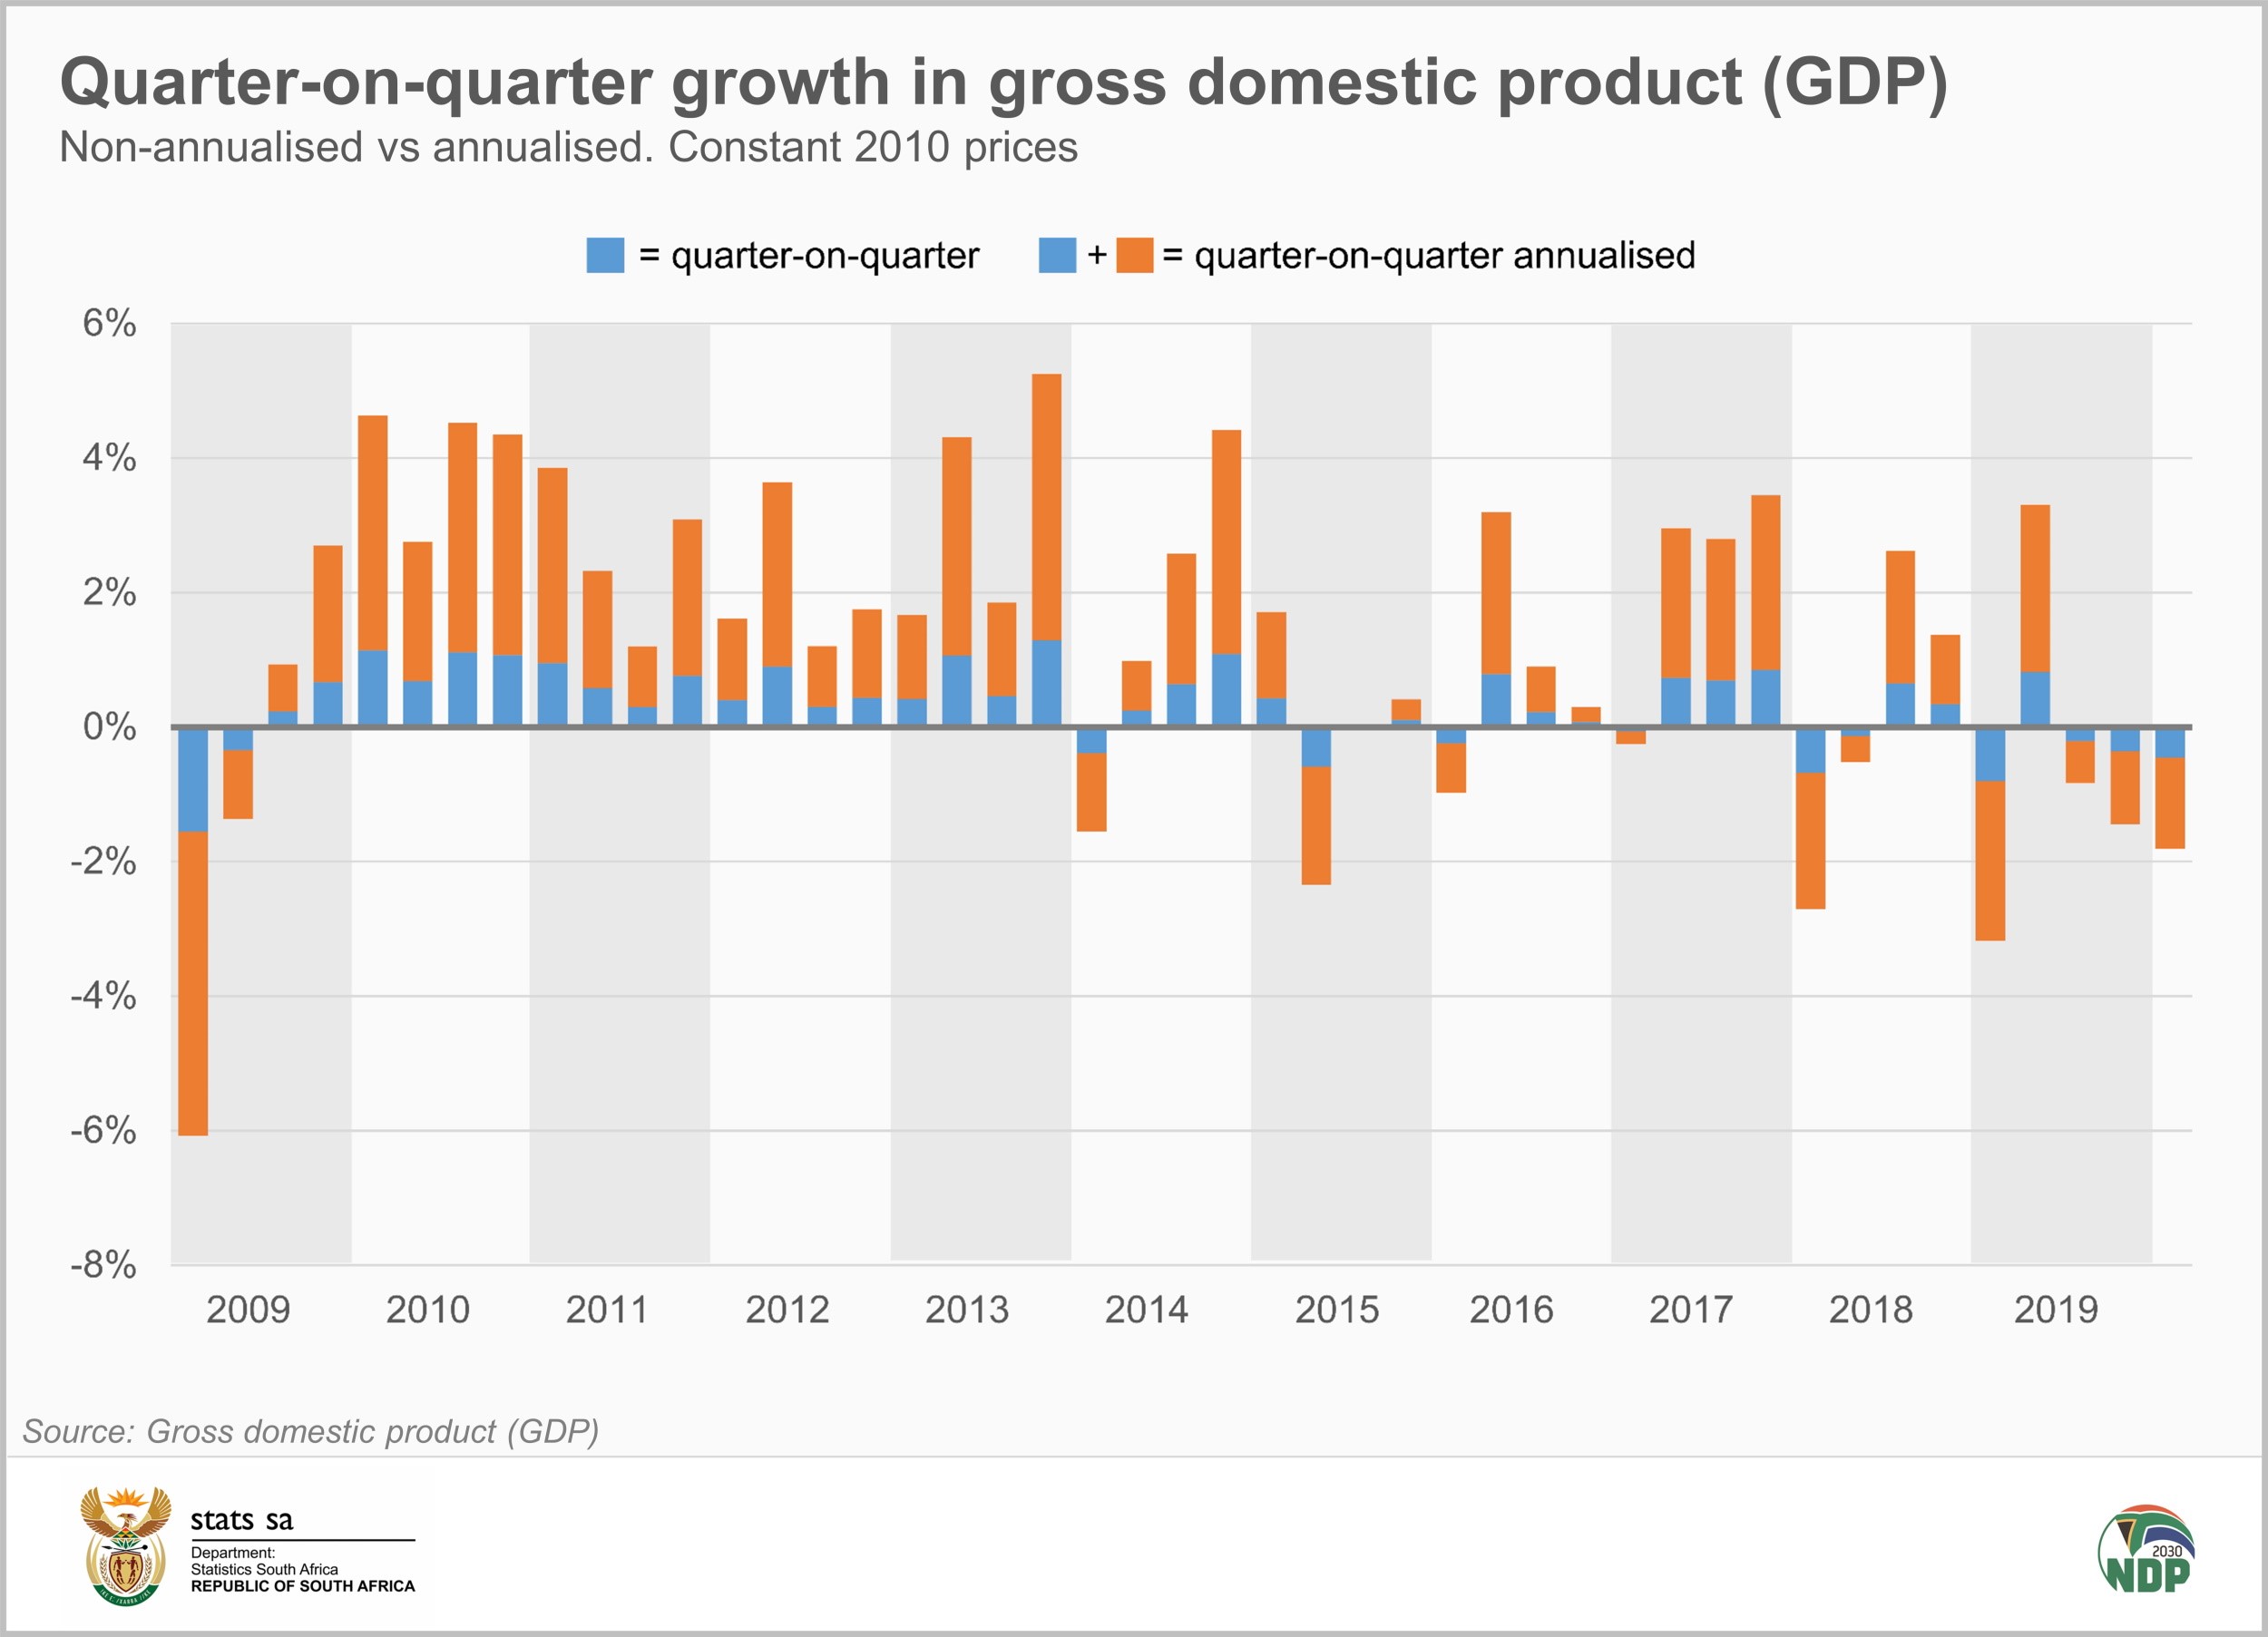
This is in contrast to the other widely used growth rate, the year-on-year rate, that could be negative when the quarter-on-quarter rate is positive, or vice versa.
During periods of steady economic growth, annualisation provides a useful way of expressing quarter-on-quarter performance in annual terms. During periods of economic instability, however, annualising can be misleading, because it exaggerates growth rates that are unlikely to be repeated.
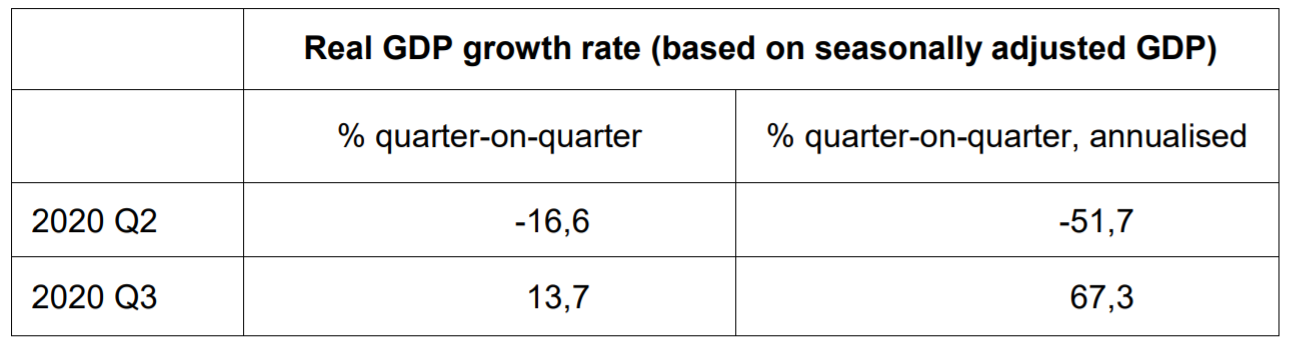
In 2020, this shortcoming was clearly visible. As a result of the COVID-19 pandemic and lockdown restrictions, real GDP contracted sharply in the second quarter of the year and rebounded strongly in the third quarter, as shown in the following table.
The debate over whether to use the annualised rate as the headline rate is not new, and Stats SA has always welcomed feedback on this question. In 2019, the organisation stated that it was considering proposals from the user community.3
In future, Stats SA will publish the quarter-on-quarter real GDP growth rate (seasonally adjusted) as the headline rate (i.e. the blue series in the chart above). This is the practice in many countries. Examples include Australia, Brazil, Canada, France, Germany, Italy, Japan, Mexico, New Zealand, Norway, Sweden, and the United Kingdom. In other words, the headline rate will no longer be the annualised rate.
Stats SA will continue to publish supplementary growth rates, namely year-on-year growth for individual quarters and for year-to-date.
1 Stats SA, Gross Domestic Product (GDP), 4th Quarter 2020, page 10 (read here)
2 Stats SA, Gross Domestic Product (GDP), 3rd Quarter 2020, page 8 (read here)
3 Stats SA’s seasonal adjustment models are part of regular rebasing, Business Day, 03 October 2019 (available here).